Copyright 0 1996 by the Genetics Society of America
Patterns
of
Nucleotide Substitution
in
Mitochondrial Protein
Coding
Genes of Vertebrates
Sudhir
Kumar
Institute of Molecular Evolutionary Genetics and Department of Biology, Pennsylvania State University, University Park, Pennsylvania 16802
Manuscript received August 7, 1995 Accepted for publication January 18, 1995
ABSTRACT
Maximum likelihood methods were used to study the differences in substitution rates among the four nucleotides and among different nucleotide sites in mitochondrial protein-coding genes of vertebrates. In the lst+2nd codon position data, the frequency of nucleotide Gis negatively correlated with evolution- ary rates of genes, substitution rates vary substantially among sites, and the transition / transversion rate bias ( R ) is two to five times larger than that expected at random. Generally, largest transition biases and greatest differences in substitution rates among sites are found in the highly conserved genes. The 3rd positions in placental mammal genes exhibit strong nucleotide composition biases and the transi- tional rates exceed transversional rates by one to two orders of magnitude. Tamura-Nei and Hasegawa- Kishino-Yano models with gamma distributed variable rates among sites (gamma parameter, a ) ade- quately describe the nucleotide substitution process in lst+Znd position data. In these data, ignoring differences in substitution rates among sites leads to largest biases while estimating substitution rates. Kimura’s two-parameter model with variable-rates among sites performs satisfactorily in likelihood estima- tion of R, a , and overall amount of evolution for lst+2nd position data. It can also be used to estimate pairwise distances with appropriate values of a for a majority of genes.
M
ITOCHONDRIAL DNA (mtDNA) sequences arewidely used in molecular evolutionary studies. These sequences have proven useful for estimating times of species and population divergences, compari- son of relative rates of evolution, and phylogenetic in- ference within and between species of vertebrates ( NEI 1987; AVISE 1994; GILLHAM 1994). In such studies, in- formation about the differences in the probability of change among four nucleotides (pattern of nucleotide substitution) and the variability of substitution rates among sites is necessary for obtaining reliable results. For example, the knowledge that transitions occur more often than transversions in primate mtDNA (BROWN et al. 1982) and that the probability of substitu- tion varies among sites in the control D-loop region of human mtDNA has been useful in obtaining better estimates of the age of the “mitochondrial Eve” (KOCHER and WILSON 1991; VIGILANT et al. 1991; NEI 1992; TAMURA and NEI 1993; H o r n et al. 1995).
The tempo and mode of amino acid and nucleotide sequence evolution in animal mitochondrial genes have been studied previously ( LANAVE et al. 1984; HASEGAWA and KrSHINO 1989; REEVES 1992; ADACHI et al. 1993; LYNCH and JARRELL 1993; SIMON et al. 1994; HONEYCUTT
et al. 1995). However, the actual pattern of nucleotide substitution and the extent of variability of substitution
rates among sites in vertebrate mitochondrial genes have yet to be determined. The availability of nucleo- tide sequences of the complete mitochondrial genome from diverse vertebrate species allows us to examine these aspects of sequence evolution in various protein- coding genes.
Rates of substitution between the four nucleotides and among different sites can be estimated by the likeli- hood and parsimony methods. In the likelihood analy- sis, the parameters of a given substitution model are estimated by maximizing the likelihood function. For this purpose, various models of nucleotide substitution and a gamma distribution of variable substitution rates among sites can be assumed ( GOLDING 1983; HOLM- QUIST et al. 1983; TAMURA and NEI 1993; WAKELEY 1993; YANG 1994a). Unlike the likelihood method, parsimony analysis does not account for uneven nucleotide fre- quencies, transition-transversion rate bias, differences in substitution rates among sites, and unequal branch lengths of a tree (e.g., COLLINS et al. 1994; PERNA and KOCHER 1995)
.
Improved parsimony-based methods have been developed (YANG and KUMAR 1996), but likelihood methods are preferable if computationally feasible, and, thus, used in the present study.Most commonly used models of nucleotide substitu- tion are special cases of the general reversible (REV) model (YANG 1994a), and this model is expected to fit a given data set better than simpler models. However,
vania State University, 328 Mueller Laboratory, University Park, PA it is to use a simp1e* but adequate,
Corresponding authw: Sudhir Kumar, Department of Biology, Pennsyl-
16802. E-mail: [email protected] of substitution in the analysis because they give, for
538 S. Kumar
Blue whale
Rainbow trout
0.1
c”
Rat
Chicken
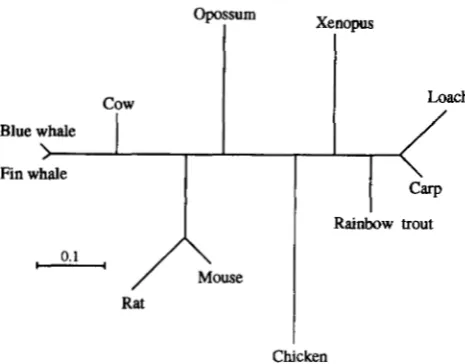
FIGURE 1.-The biological tree of 11 vertebrates species. The data set included complete mitochondrial DNA sequence (accession numbers in parentheses) of a fin whale (Balmnopt- era physalus, X61145), blue whale ( B . musculus, X72704), cow (Bos taurus, V00654 and JO1394), rat (Rattus norvegicus, X14848), mouse (Mus musculus, V00711) , opossum ( D i - debhis virginiana, Z29573), chicken ( Gallus gallus, X52392), African clawed frog (Xenopus laevis, X02890, M10217, X01600, and X01601 ) , carp ( Cyrinus carpio, X61010), loach
( Crossostoma lacustre, M91245), and rainbow trout ( Oncorhyn- chus mykiss, L29771). The lst+2nd codon position data of
Ndh5 were used for estimating branch lengths by the maxi- mum likelihood method; a general reversible model of nucle- otide substitution and gammadistributed substitution-rates among sites were assumed.
example, distance estimates with smaller variances. Sev- eral statistical tests are available to evaluate and com- pare the fit of models to a given data set ( RXTLAND and CLEGG 1987; KISHINO and HASEGAWA 1990; SACCONE et al. 1990; NAVIDI et al. 1991; REEVES 1992; GOLDMAN 1993; TAMURA 1994; RZHETSKY and NEI 1995). By using such tests, models that contain fewer parameters than the general reversible model can be identified. How- ever, for large data sets, all simple models are likely to be rejected because even small departures from the complicated model examined can be d e t e c t e d i n the statistical tests. Moreover, the choice of a m o d e l f o r different evolutionary analyses does not appear t o be universal. For example, a general m o d e l is preferred for obtaining unbiased estimates of the branch lengths of a tree ( a n d t h u s the t i m e o f d i v e r g e n c e ) , b u t i t m a y
not be best suited for inferring phylogenetic relation- ships ( NEI 1991; TATENO et ~ 2 . 1 9 9 4 ; YANC 1995a; Russo
et ul. 1 9 9 6 ) . Therefore, we have studied the perfor- m a n c e o f s i m p l e ( a n d overly simple) models, rejected by t h e statistical tests, in estimating several useful evolu- tionary quantities. Based on these results, we have made an a t t e m p t to understand the importance of different features of the nucleotide substitution process in the estimation of evolutionary parameters and to identify simple models that may be suitable for a variety of evolu- tionary analyses in which the protein-coding genes of mtDNA are used.
MATERIALS AND METHODS
The sequence data: Complete mtDNA sequences of 11 ver- tebrate species were extracted from GenBank and EMBL data- banks. The data set contained a fin whale (ARNASON et al. 1991 ) , blue whale ( A R N M o N and GULLBERG 1993), cow ( A N -
DERSON et al. 1982), rat ( GADALETA et al. 1989), mouse ( BIBB et al. 1981 ) , opossum (JANKE et al. 1994), chicken ( DESJAR- DINS and MORAIS 1990), African clawed toad (ROE et al.
1985), carp ( C H A N G et al. 1994), loach ( TZENC et al. 1992), and rainbow trout (R. ZARDOYA, J. M. BAUTISTA, and A. GAR- RIM-PERTIERRA, unpublished data). These species were cho- sen because their phylogenetic relationships are well estab- lished by studies of morphological characters and fossil records (Figure 1 ) ( STORER et al. 1971; CARROI. 1988; GIN- CERICH et al. 1990, 1994). This was done to eliminate system- atic errors that may be introduced if the phylogeny is inferred from the data itself. The mitochondrial genomes of these species contain 13 protein coding genes: subunits 6 and 8 of ATP synthase (Atp6, At@), subunits 1-3 of cytochrome c
oxidase ( Coxl-3) , cytochrome b ( Cytb) , and seven subunits
of NADH dehydrogenase (Ndhl-6 and Ndh4L). With the exception of Ndh6, these genes are encoded on the heavy strand ( H strand) of the mitochondrial genome. The relative positions of these genes are identical for all the vertebrate species studied, with one exception: the positions of Ndh6 and Cytb are reversed in the chicken.
For each gene, first the amino acid sequences were aligned by using the default option of CLUSTAL. V ( HIGGINS et al. 1992), and then the nucleotide sequences were ad- justed to reflect those alignments. All codons containing
alignment gaps in one or more species were removed from the analysis, and the data were analyzed at the nucleotide sequence level. The first (1st) and second (2nd) codon positions were pooled together for analysis. Even though these two positions are under different selective constraints, these data were combined to avoid working with sequences with small lengths. The analysis of 3rd position data was
TABLE 1
Substitution rate matrix (Q for the general reversible (REV) model
Patterns of Nucleotide Substitution 539
TABLE
2Models of nucleotide substitution
Frequency Gamma Total free
Model" Rate parameters* parameters' parameter parameters
Uniform substitution rates among sites
REV a, b, c, d, e,
f
T T ? T C , T A , T G 00 9TN93 u , f ; b = c = d = e T T , T C , T A ? T G M 6
HKY85 T T ? T A t T G M 5
4 2 1
among sites
REV+G a, b, c, d, e,
f
T T , T C I T A > T G a 10TN93
+
G u , f ; b = c = d = e T T , T C , T A , T G CY 7HKY85+G a = f b = c = d = e T T ? T C , T A > T G a 6
~ 8 1 + G a = f = b = c = d = e T T , T C , T A , T G a 5
~ 8 0
+
G a = f b = c = d = e '/4, l/4, '/4, l/4 a 3~ c 6 9
+
G a = f = b = c = d = e '/4, '/4, '/4, '/4 a 2REV (TAVARE 1986; YANG 1994a), TN93 (TAMURA and NEI 1993), HKY85 (HASEGAWA et al. 1995), ~ 8 1 (FELSENSTEIN 1981), ~ 8 0 (KIMURA 1980), and ~ c 6 9 ( JUKES and CANTOR 1969). Models with gamma distributed substitution rates among sites have suffix "+G".
* A s in Table 1.
One of the frequency parameters is redundant.
restricted to the placental mammal sequences (whales, cow, mouse, and rat) because of very high sequence divergences between these and other vertebrate species (BROWN 1985; JANKE et al. 1994). Furthermore, the analysis of the 3rd
position data is tentative because the substitution parame- ters estimated are likely to have large stochastic errors due to small sequence lengths and extremely fast rates of evolu- tion ( e . g . , IRWIN 1991 )
.
The lst+2nd position data of pla- cental mammal genes were also analyzed.Estimating the pattern of nucleotide substitution: The pattern of nucleotide substitution was estimated by using the likelihood methods implemented in the program pack- age PAML (YANG 1 9 9 5 ~ ) . For this computation, indepen- dently known tree and the general reversible ( R E V ) model with variable substitution rates among sites were assumed
(Figure 1, Table 1 ) . Furthermore, it was assumed that the pattern of nucleotide substitution has remained the same in different parts of the tree (homogeneous Markov pro- cess) and that this process is at equilibrium (stationary Mar- kov process).
In the general reversible model, two different transitional rates ( a: C-T; f : A-G) and four different transversional rates ( b : A-T; c: G-T; d: A-C; e: G-C) are considered, and frequencies of four nucleotides ( rT, 7rc, rA, r G ) are not as-
sumed to be equal (Table 1 ) (TAVARE 1986; YANG 1994a). The variable substitution rates over sites were assumed to follow a gamma distribution with the shape parameter a
(called gamma parameter) with its mean fixed to be one. For computational efficiency, the discrete gamma model with eight categories was used in the likelihood analysis (YANG
TABLE 3
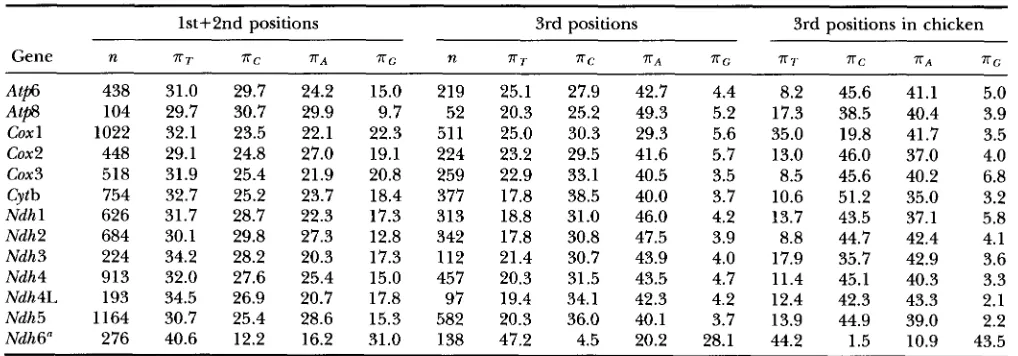
Average nucleotide compositions observed
lst+2nd positions 3rd positions 3rd positions in chicken
Gene n T T T C T A T G n T T T C T A T G T T T C X A T G
At@ A t e cox 1 cox2
cox 3 Cytb Ndh 1 Ndh2 Ndh3 Ndh4 Ndh4L Ndh5 Ndh6" 438 104 1022 448 518 754 626 684 224 913 193 1164 276
31.0 29.7
29.7 30.7
32.1 23.5
29.1 24.8
31.9 25.4
32.7 25.2
31.7 28.7
30.1 29.8
34.2 28.2
32.0 27.6
34.5 26.9
30.7 25.4
40.6 12.2
24.2 15.0
29.9 9.7
22.1 22.3
27.0 19.1
21.9 20.8
23.7 18.4
22.3 17.3
27.3 12.8
20.3 17.3
25.4 15.0
20.7 17.8
28.6 15.3
16.2 31.0
219 52 51 1 224 259 377 313 342 112 457 97 582 I38 25.1 20.3 25.0 23.2 22.9 17.8 18.8 17.8 21.4 20.3 19.4 20.3 47.2
27.9 42.7 4.4 8.2 45.6
25.2 49.3 5.2 17.3 38.5
30.3 29.3 5.6 35.0 19.8
29.5 41.6 5.7 13.0 46.0
33.1 40.5 3.5 8.5 45.6
38.5 40.0 3.7 10.6 51.2
31.0 46.0 4.2 13.7 43.5
30.8 47.5 3.9 8.8 44.7
30.7 43.9 4.0 17.9 35.7
31.5 43.5 4.7 11.4 45.1
34.1 42.3 4.2 12.4 42.3
36.0 40.1 3.7 13.9 44.9
4.5 20.2 28.1 44.2 1.5
~
41.1 5.0
40.4 3.9
41.7 3.5
37.0 4.0
40.2 6.8
35.0 3.2
37.1 5.8
42.4 4.1
42.9 3.6
40.3 3.3
43.3 2.1
39.0 2.2
10.9 43.5
540 S. Kumar
TABLE 4
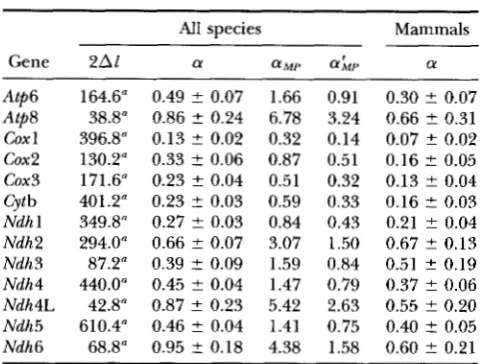
Variation in substitution rates among sites in the Ist+2nd position data
All species Mammals
Gene 2Al a aMI' a
Atp6 164.6" 0.49 t 0.07 1.66 0.91 0.30 t 0.07 Atp8 38.8" 0.86 t 0.24 6.78 3.24 0.66 t 0.31 Coxl 396.8" 0.13 t 0.02 0.32 0.14 0.07 5 0.02 Cox2 130.2" 0.33 t 0.06 0.87 0.51 0.16 t 0.05 cox3 171.6" 0.23 t 0.04 0.51 0.32 0.13 t 0.04 Cytb 401.2" 0.23 t 0.03 0.59 0.33 0.16 t 0.03 Ndhl 349.8" 0.27 t 0.03 0.84 0.43 0.21 t 0.04 Ndh2 294.0" 0.66 t 0.07 3.07 1.50 0.67 t 0.13 Ndh3 87.2" 0.39 t 0.09 1.59 0.84 0.51 2 0.19 Ndh4 440.0" 0.45 t 0.04 1.47 0.79 0.37 t 0.06 Ndh4L 42.8" 0.87 ? 0.23 5.42 2.63 0.55 t 0.20 Ndh5 610.4" 0.46 t 0.04 1.41 0.75 0.40 ? 0.05 Ndh6 68.8" 0.95 t 0.18 4.38 1.58 0.60 t 0.21
Alis the difference in log likelihoods for observing the data under general reversible models with and without gamma distribution of rates among sites (REV+G and REV, respec- tively). a is the shape parameter of gamma distribution of rates as obtained using the likelihood method under REV+G model. Maximum parsimony estimates of gamma parameter are: aMpby method-of-moments and LYh,,bYYANG and KUMAR'S (1996) method. a for "Mammals" was estimated using only placental mammal sequences.
"Rate constancy rejected at the 1% level; 2AZ > 6.6.
1994b). This model is denoted REV + G and has 10 parameters (Table 2 ) .
In the maximum likelihood analysis with the REV +G model, substitution rates ( a-f) , the gamma parameter ( a ) , and the branch lengths and log likelihood ( I ) for the given tree were estimated. Hat (
-
) was omitted from the symbols used for estimates of parameters because only the estimates are consid- ered in this paper. Because only the relative values of substitu- tion rates are important, they were scaled such that a + b+
c
+
d+
e+
f = 1. Given the average nucleotide frequencies observed ( rT, r C , 7 r A , xti j and the substitution rates ( a - f ),
the transition-transversion rate bias averaged over nucleotide frequencies ( R ) is computed by the following equation
( GOLDMAN 1993 ) :
R = ( UTT7rc f T A T G ) / ( ~ T T A
+ CTTXC
+ dTCTA
+
m c ; ~ < ; ) . (1)The total number of substitutions per site that have occurred in the evolutionary history of the gene is the arithmetic sum of the maximum likelihood estimates of the branch lengths of the tree (S; overall amount of evolution per site).
The REV +G model assumes the reversibility of the evolu- tionary process (Table 1 )
.
Use of such a general model en- sures that the effects of unequal nucleotide frequencies, bi- ases in substitution rates between four nucleotides, and the heterogeneity of rates among sites are taken into account simultaneously in the estimation of evolutionary parameters. Thus, the maximum likelihood estimates obtained can be considered to be the most reliable. Comparisons of these estimates with those obtained by simpler models allows us to evaluate the effect of various restrictions on the model of nucleotide substitution in the estimation of evolutionary pa- rameters.An unrestricted model, which does not require the reversibil-
ity assumption, could also be used for estimating the pattern of nucleotide Substitution. However, as noted by YANG
( 1994a), the use of the unrestricted model generally results in only marginal improvements of fit at the cost of adding three more parameters. This was indeed the case for the data sets analyzed here (results not shown) .
Test of variability of substitution rates among sites: A likeli- hood ratio test of uniformity of substitution rates among sites ( i . e . , a = 00) was conducted. In this test, log likelihoods of observing the data were obtained under the REV+G model
( I , ) and the REV model (
h )
, and a likelihood ratio test was constructed in which the statistic 2 A l ( AZ =1
12
- I ,I
) follows a chi-square distribution with 1 degree of freedom.Comparison of parametric models for a given data set: Sev- eral commonly used models of nucleotide substitution are special cases of the REV +G model (Table 2 ) . For instance, the Tamura-Nei model (TN93+G) imposes the restriction that four types of transversional substitution rates are equal ( b = c = d = e ) ; thus, it involves three less parameters. We evaluated the effect of these and other restrictions on the fit of a model by the likelihood ratio test, where 2Al (two times the difference in log likelihoods of observing the data under the models compared) follows a chi-square distribution with degrees of freedom equal to the difference in the number of free parameters between the two nested models compared. For example, in the comparison of TN93+G and REV +G, this amounts to 3 degrees of freedom.
GOLDMAN ( 1993) has suggested the use of parametric boot- strapping, instead of a chi-square approximation, for compar- ing models. However, the chi-square approximation for the likelihood ratio test may be reliable because the likelihoods under the two models compared may be affected in the same way when the "true tree" is given (YANG et aZ. 1995). Since the true tree is known in the present work, the chi-square test was employed for likelihood ratio tests. RZHETSKY and NEI (1995) tests for model selection were also used to evaluate the fit of different models to the data.
The estimates of R, a , and S obtained with simple models (involving two or three parameters) were compared with the corresponding estimates by REV+G. The statistical signifi- cance of the difference between the two estimates was deter- mined by the normaldeviate tests, for which the standard errors were computed by the curvature method in the likeli- hood analysis (Table 7 ) . Pairwise distances and their standard errors were computed by the MEGA program package ( KU-
MAR et al. 1994). The relationships of the pairwise distances estimated by different models were examined graphically be- cause of the lack of statistical tests for this purpose.
RESULTS
541 Patterns of Nucleotide Substitution
TABLE 5
Substitution rates for lst+2nd codon positions data under m + G model
Transitions Transversions
(
4
(f
1
( 6) ( c ) ( 4 (4
Gene A-G C-T A-T
G-T A-C G-C R S K
Atp6 0.289 0.331 0.076 0.057 0.122 0.126 1.68 1.55 3.25
Atp8 0.239 0.428 0.050 0.030 0.120 0.134 1.56 4.24 3.62
cox 1 0.401 0.293 0.063 0.054 0.136 0.053 2.47 0.43 4.63"
cox2 0.396 0.291 0.095 0.077 0.089 0.052 2.17 0.83 4.22
cox3 0.431 0.252 0.140 0.037 0.103 0.038 2.26 0.70 4.24"
Cytb 0.360 0.317 0.086 0.051 0.129 0.058 2.16 1.02 4.20
Ndh 1 0.343 0.308 0.138 0.049 0.104 0.059 1.88 1.26 3.69
Ndh2 0.325 0.266 0.095 0.111 0.140 0.063 1.42 2.62 2.91
Ndh 3 0.368 0.354 0.098 0.047 0.076 0.056 2.69 2.13 5.43
Ndh4 0.348 0.235 0.122 0.052 0.176 0.068 1.37 1.82 2.85"
Ndh4L 0.236 0.340 0.115 0.066 0.128 0.115 1.36 2.35 2.63
Ndh 5 0.365 0.199 0.128 0.050 0.202 0.056 1.14 1.82 2.64"
Ndh6 0.256 0.304 0.118 0.072 0.121 0.128 1.15 2.26 2.79
R is transition/transversion rate bias averaged over nucleotide frequencies under REV+G model (Equation 1). S is sum of the maximum likelihood estimates of the branch lengths of the tree topology given in Figure 1. K is the transition/transversion rate ratio under HKY85+G model.
" Data sets for which HKY85fG was rejected in comparison with REV+G.
geneity of base compositions across species was not re- jected for any of the genes.
In the 3rd codon positions, the average frequency of nucleotide G is the lowest and that of A is the highest. However, the nucleotide compositions vary consider- ably among species ( WOLSTENHOLME 1992)
.
As an ex- ample, the base composition in the 3rd positions of chicken genes is shown (Table 3 ) . Within mammals, nucleotide frequencies in Atp6, Coxl-2, Cytb, and Ndhl-5 in opossum were quite different from those in the placental mammals. In particular, the frequency of C was lower in opossum (this decrease was apparently compensated by an increase in the frequency of T ).
This was another reason for limiting the analysis of 3rd position data only to placental mammal sequences. In this subset, the equality of nucleotide frequencies over species was rejected for Atp6, Cox2, cox3, Ndhl, Ndh3, Ndh4L, and Ndh6 genes.The rejection of uniformity of nucleotide frequencies among species indicates that the assumption of the sta- tionarity of the evolutionary process has been violated. Such violations often occur in the analysis of distantly related sequences and for large data sets ( RZHETSKY and NEI 1995;
YANC
1995b). For example, much greater variation in base compositions among species was found in the lst+2nd position data of Atp8 (or Ndh4L) ascompared with Alp6 or Ndh5, but the stationarity was not rejected in Atp8 because of its short sequence length. In any case, the violation of the stationarity a s sumption indicates that the results should be interpre- ted with caution.
Differences in the substitution rates among sites: In the lst+2nd position data, the likelihood estimates of a are <1 and the uniformity of substitution rates among sites is rejected for every gene (Table 4 ) . T h e
traditional parsimony-based estimates of a were up to seven times larger than the likelihood estimates for these data. In placental mammals, greater variation in rates among sites was inferred (as CY values are smaller), but the difference between the estimates of a were generally not significant. Separate analysis of 1st and 2nd position data also demonstrated consider- able rate variation among sites. The estimates of a
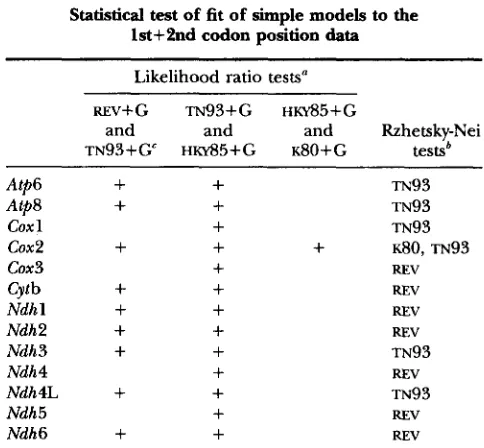
TABLE 6
Statistical test of fit of simple models to the
lst+2nd codon position data
Likelihood ratio testsa
REV+G TN93+G HKY85tG
and and and Rzhetsky-Nei
TN93+G HKYS5+G ~ 8 0 + G testsb
Atp6
+
+
TN93Atp8
+
+
TN93cox 1
+
TN93cox2
+
+
+
~ 8 0 , TN93cox3
+
REVCytb
+
+
REVNdh 1
+
+
REVNdh2
+
+
REVNdh3
+
+
TN93Ndh4
+
REVNdh4L
+
+
TN93Ndh5
+
REVNdh6
+
+
REV+ indicates that the difference in the
fits of the models compared was statistically not significant at the 1% level.Models that were not rejected are listed. Presence of REV shows that the fits of all simpler models were significantly worse.
S. Kumar
A Coxl
A
cox3
542
25
-
20 -
1
Y3
0 15 - Y
e,
l
10 -
A Ndh2
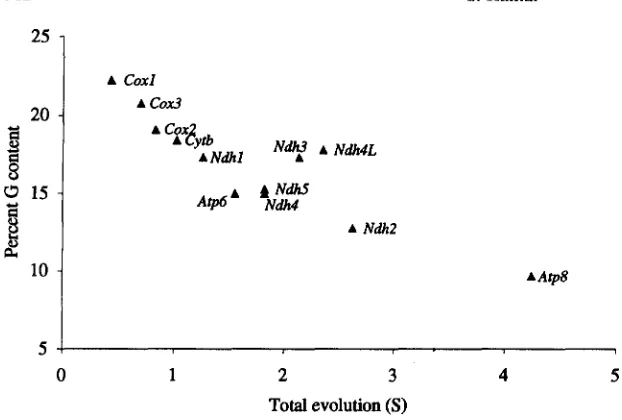
FIGURE 2.-The relation between the fre- quency of nucleotide G and the overall amount of evolution (S) in the lst+Znd co- don position data of mitochondrial genes en- coded on the H strand. The correlation coef-
AAtp8 ficient is -0.89.
5
I
0 1 2 3
Total evolution ( S )
were ( 1st and 2nd position) : Ate6 (0.66, 0.39), Atp8 (1.06, 2.19), Coxl (0.22, 0.08), Cox2 (0.54, 0.44), cox3 (0.31, 0.37), Cytb (0.27, 0.28), Ndhl (0.44, 0.17), Ndh2 (0.84, 0.68), Ndh3 (0.84, 0.31), Ndh4 (0.62, 0.39), Ndh4L (0.98, 1.02), Ndh5 (0.53, 0.45), Ndh6 (0.83, 1.08)
.
In the 3rd position data of placentals, the uniformity of substitution rates was not rejected at the 1% signifi- cance level for Atp8, Coxl, Cytb, Ndhl-6; for these genes a! was > l . Therefore, the constancy of rates
among sites was assumed in the analysis of these genes. For Atp6, Cox2, cox3, and Ndh4L, estimates of a! (+SE) were 0.51 ? 0.19, 0.57 t 0.20, 0.84 & 0.35, and 0.60 t
0.39, respectively, and the uniformity of rates was re- jected at the 1% level.
Substitution biases among four nucleotides: The esti- mates of two transitional ( a and
f )
and four transver- sional ( b e ) substitution rates for lst+Znd position data are given in Table 5. The transversional rates that involve nucleotide A (6: A-T; d: A*C) are usually larger than others. Since the frequencies of T and C are higher than that of A , the rates of A+T and A+C changes are larger than the rates of T+A and C+A changes, respectively (see Table 1 ) . In general, the transitional rates are up to five times larger than the transversional rates and the estimates of R are up to five times larger than those expected if transitional and transversional rates were equal. A similar trend was ob- served in the lst+Znd position data of placental mam- mals (results not shown).In the 3rd positions of placental mammals, a and J
were up to two orders of magnitudes higher than 6 , c, d, or e, and these rates were estimated with very large variances. Similar results were obtained in substitution pattern analyses of the two closely related whale se- quences. Furthermore, analysis of the 3rd position data of whales without two- or fourfold sites produced ex- pected results; larger transition-transversion rate biases were observed when all fourfold sites were removed and lower transition
/
transversion rate biases were observed4 5
when all twofold sites were removed from the data ana- lyzed. Comparable results were obtained when cow se- quence was included in these analyses. However, these rate estimates are not reliable because of the saturation of transitional substitutions and the small sequence lengths of the 3rd positions (which led to very large variances) and because of the problem of correctly identifylng the two- and fourfold sites in distantly re- lated sequences. For these reasons, these estimates are not presented here.
Patterns of Nucleotide Substitution 543
x
I
0.0 0.5 1 .o 1.5 2.0 2.5 3.0
X
A Ndh6
A Ndh4L
FIGURE 3.- ( A ) The density function of the gamma distribution with different val- ues of a. The mean and variance of the distribution are 1 and 1 / a , respectively.
0. ( B ) The relationship between a and the overall amount of evolution (S) for the lst+2nd codon position data of different genes. The correlation coefficient is 0.82.
f( X ) = a m
r(a)-l
, c u > o , x >0
I
0 1 2 3 4 5
Total evolution ( S )
differences in the rates of evolution. On the basis of the estimates of S , the mitochondrial protein-coding genes were arranged into three categories for conve- nience: genes evolving with low rates-Coxl-3, Cytb, and Ndhl, moderate rates-Atp6 and Ndh3-6, and fast
rates-Atp8 and Ndh2.
Comparison of models: In the likelihood ratio tests, we used a 1% significance level for rejecting the null hypothesis that a simple model describes the data as well as a more general one. In the lst+2nd position data, the general reversible model with uniform rates ( R E V ) fit the data significantly worse than the Tamura- Nei ( 1993) or Hasegawa-Kishino-Yano ( 1985) models
with gamma-distributed rates ( m 9 3 + G a n d H K Y ~ ~ + G , respectively). These two models fit the Atp6, Atp8,
(20x2, Cytb, Ndhl-3, Ndh4L, and Ndh6 data well (Table
6 )
,
and all other models were rejected in the likelihood ratio tests. RZHETSKY-NEI’S (1995) test also produced similar results (Table 6 ) .All simple models of substitution were rejected for Coxl, Cox3, Ndh4, and Ndh5 data. This is partly due to larger transversional rates b and d (A-T, C) as com- pared with c and e ( W T , C) and partly because of longer sequence lengths of Coxl, Ndh4, and Ndh5. By contrast, ~ 8 0 + G is not rejected for Cox2 because this gene is relatively short and because the transversional rates are quite similar and considerably smaller than the transitional rates.
544 S. Kumar
m 3
2
1
0
a 1
0
2
&
1
0
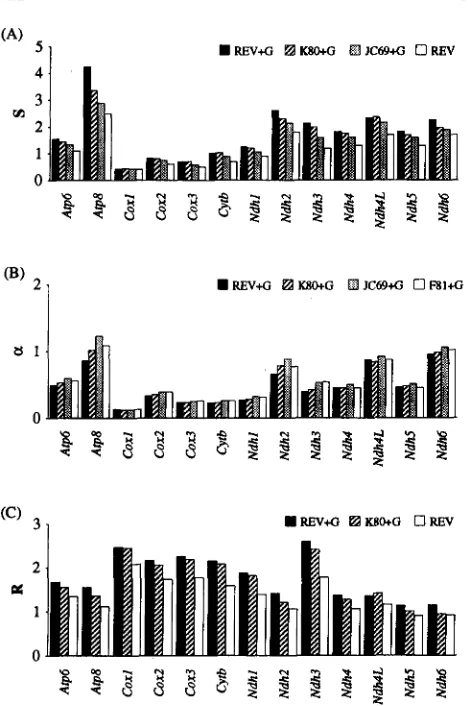
FIGURE 4.-Estimates of evolutionary quantities under dif- ferent models of nucleotide substitution. ( A ) overall amount of evolution, S. ( B ) shape parameter of the gamma distrib uted substitution-rates among sites, a. ( C ) transition-transver- sion rate bias averaged over nucleotide frequencies, R.
equally well. In the 3rd position data of these mammals, TN93 and ~ ~ were not rejected in the likelihood 8 5 ratio tests (results not shown)
.
DISCUSSION
Nucleotide frequencies: In the lst+2nd position data, the frequency of G is negatively correlated with overall amount of evolution for individual genes (Fig- ure 2 ) ; no such trend was detected for frequencies of nucleotides A , T , or C. Furthermore, the frequency of G declines gradually from fishes
>
Xenopus>
chicken>
mammals; this tendency was more noticeable in the faster evolving genes. The fact that a change from G to A , T , or C in the first two codon positions causes an amino acid substitution and that the rates of amino acid substitution are lower in the basal lineages of the vertebrate phylogeny (ADACHI et al. 1993) may partly explain observed cline in the frequency of Gin different lineages. However, reasons for the high substitution rates from G to A , T , or Care not yet clear. The suscepti- bility of nucleotide G to change is also highlighted in the 3rd codon positions where fast rates of sequence evolution have resulted in very low frequency of G.Variability of substitution rates: The gamma parame- ter is inversely related to the extent of rate variation among sites. An a 5 1 indicates that most sites evolve
with low rates, while some sites change with high rates (“hot spots”). If all sites are equally mutable or only small differences in substitution rates exist among sites, the value of a will be
>
1 (Figure 3A).
When we com- bine the 1st and 2nd codon positions, substitution rates among sites are expected to be different because purify- ing selection operates with different intensities in the three positions. However, differences in rates of evolu- tion between 1st and 2nd position cannot solely explain these observations since significant rate variation among sites was also found within 1st positions (0.225 a 5 1.06) and within 2nd positions (0.08 5 a 5
2.19). Moreover, the observed rate variation in the 1st position data cannot be attributed to the faster rates of evolution in the twofold redundant 1st positions in the Leucine codons. Leucine make up -10-20% of all mi- tochondrial protein coding genes. However, only a few sites are twofold redundant in the Leucine codons be- cause of low Gcontent in the third position, which re- sults in a skewed relative synonymous codon usage. The estimates of gamma parameters for data sets with and without 1st positions of Leucine clearly showed that the Leucine codons are not contributing substantially to the rate heterogeneity among sites in the 1st position data.
Different regions of mitochondrial genes are under different functional constraints because of their trans- membrane location, positions within the multimeric en- zyme complexes of the electron transport chain, and co-evolution with some nuclear genes (see GILLHAM 1992 for review). The composite effect of these factors is reflected in rather small estimates of a when 1st and 2nd positions are analyzed together (Table 4) or indi- vidually (see results; a
<
1 for most genes). The esti- mates of a for Coxl, cox3, Cytb, and Cox2 (0.13, 0.23, 0.23, 0.33) show a correspondence with the number of putative transmembrane domains, 12, 7, 7-8, and 2, respectively ( ESPOSTI et al. 1993; GILLHAM 1994).
At any rate, of seven subunits of NADH dehydrogenase, the highest rate variation among sites is seen in Ndhl, which is thought to be functionally important in the activity of the mitochondrial NADH-ubiquinone reductase com- plex of the electron transport chain ( RAGAN 1987). Atp8 codes for the smallest peptides in the mitochondria and is the least conserved of all proteincoding genes. It appears to be under relaxed selective constraints and has not been found in the mtDNA of nematodes.Patterns of Nucleotide Substitution
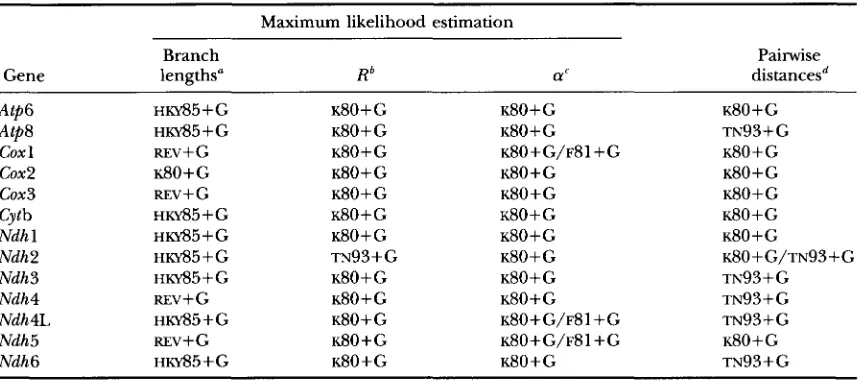
TABLE 7
Performance of simple models in the lst+2nd position data analysis
Maximum likelihood estimation
Branch Pairwise
Gene lengths" R* a' distancesd
Atp6 HKY85+G ~ 8 0 + G ~ 8 0 + G ~ 8 0
+
GAtp8 HKY85-t-G ~ 8 0
+
G ~ 8 0+
G TN93i-Gcox 1 REv+G ~ 8 0
+
G K80+G/F81+G ~ 8 0 + Gcox2 ~ 8 0
+
G ~ 8 0+
G ~ 8 0 + G ~ 8 0 + Gcox3 REV+ G ~ 8 0 + G ~ 8 0
+
G ~ 8 0 + GCytb HKY85+G ~ 8 0 + G ~ 8 0
+
G ~ 8 0+
GNdh 1 HKY85-kG ~ 8 0
+
G ~ 8 0 + G ~ 8 0+
GNdh2 HKY85+G TN93
+
G ~ 8 0+
G K80+G/TN93+GNdh 3 HKY85+G ~ 8 0 + G ~ 8 0
+
G TN93+
GNdh4 REv+G ~ 8 0 + G ~ 8 0
+
G TN93 GNdh4L HKY85+G ~ 8 0 + G K80+G/F81+G TN93
+
GNdh5 m v + G ~ 8 0 + G K80+G/F81+G ~ 8 0 + G
Ndh6 HKY85-l-G ~ 8 0
+
G ~ 8 0 + G TN93+Ga Simplest model not rejected when compared with REV+G (from Table 6).
*
z = ( R T N g J + G - &o+c)/SE(&o+c), where SE is the standard error estimated by the curvature method in the PAML program. If z>
1.96, we rejected ~ 8 0 + G model at 5% level. The standard error of the estimate of R T N 9 3 + c was not considered, which makes this test liberal in rejecting the use of simpler model for analysis.'Same as above, but with values of a ; both ~ 8 1 + G and ~ 8 0 + G were examined.
dModels were chosen based on Figure 5. The TN%+G model was selected whenever the choice was not obvious, because the variances of pairwise distances estimated by ~ 8 0 + G and TN93+G were quite similar.
545
in rates among sites (Table 4 )
.
It appears that the faster evolutionary rates in mammalian genomes have lead to greater acceleration of rates in the faster evolving sitesas compared with other sites, which has resulted in larger differences in rates among sites.
Patterns of nucleotide substitution: In the 1st and 2nd positions, the rates of transitional and transver- sional substitutions are substantially different and the magnitudes of a and f and b, c, d , and e are disparate. The fact that the fit of TN93I-G is not rejected for nine out of 13 genes indicate that the differences in the transversional rates ( b , c, d , and e ) are not significant. The two transitional substitution rates ( a and
f )
are also not significantly different because H K Y S ~ + G and TN93fG fit these genes equally well. However, the equality of four nucleotide frequencies is rejected for all but one gene ( Cox2) as is evident from the compari- son of fits of H K Y S ~ + G and KSO+G models. Similarly, the significantly worse fit of ~ c 6 9 + G as compared with H K Y S ~ + G ( a n d other models) clearly shows significant transition-transversion rate bias.Thus, the H K Y ~ ~ + G model, which accounts for differ- ences in the transitional ( a =
f )
and transversional ( b= c = d = e ) rates and the nucleotide composition bias, may adequately model the process of nucleotide substitution at lst+2nd codon positions in a majority of mitochondrial proteincoding genes. In this model, a single transition/ transversion rate ratio ( K = a / b ) describes the substitution rate biases among four nucle- otides, which are given in Table 5. From equation 1, it is clear that K will be equal to 2 R if the four nucleotide occur with equal frequencies and if a = f and b = c =
d = e . In fact, the estimates of K are generally close to 2R (Table 5 ) , because H K Y S ~ + G fits the lst+2nd position data well and because the nucleotide composi- tions are not highly skewed.
It was argued previously that in slow evolving genes only a few sites are free to change and that these sites evolve very rapidly in slow evolving genes. It is clear from Figure 4 that the extent of transition/ transversion rate bias ( R or K ) is negatively correlated with S as well as
with a , which suggest that the fast changmg sites in highly conserved genes evolve with larger transitional-transver- sional rate bias than those in fast evolving genes.
Choosing models for analysis: In general, the m93+G
and HKY93+G models fit the lst+2nd and the 3rd posi- tion data as well as the REV +G model (Table 6 ) . How- ever, it is desirable to use simpler models of nucleotide substitutions because they give, among others, distance estimates with smaller variances. Therefore, we studied the effects of assumptions made in the substitution model on estimates of
a ,
R, S, and painvise distances when the lst+2nd position data are used for evolutionary analyses.546 S. Kumar
0.0
0.0 d 1.0
0.0 0.3
IU1
Ndhz0.0
I
0.0 1 .o1
1
Ndh4I
0.0 1.01
6.0
0.0
0.0 6.0
0.0 0.5
0.5
0.0 .
0.0 0.5
0.0 0.5
1.5
0.0
0.0 1.5
2 0
0.0 ."
0.0 2.0
"
"
''O NdM
I
p
0.0
0.0 1.0
Patterns of Nucleotide Substitution 547
ever, the underestimation of
S
was not caused by the underestimation of each branch length. Instead, there was a tendency for simple models to overestimate short branches and underestimate long branches (results not shown).
The underestimation of long branches was much more serious than the underestimation (or over- estimation) of short branches ( TATENO et al. 1994; YANG1995a). Therefore, complex models found adequate in statistical tests should be employed for estimation of branch lengths and, thus, the sum of branch lengths and the rates of evolution (Tables 6 and
7 ) .
The ~ 8 0 + G , ~ 8 1 +G and ~ c 6 9 + G models were almost always rejected in the likelihood ratio tests, and a was overestimated by these simple models (Figure 4 B ) . However, differences in the estimates of a by ~ 8 0 + G
(and ~ 8 1 + G ) and REV +G were not statistically signifi- cant (Table
7 )
.
In general, neglecting transition/ trans- version rate bias resulted in larger overestimation of a than ignoring the nucleotide composition bias (com- pare ~ 8 0 + G and ~ 8 1 + G in Figure 4 B ) . Of course, dis- regarding the nucleotide composition as well as the transition/
transversion rate biases ( ~ c 6 9 + G ) leads to greater overestimates of a ( WAKELEY 1994). However, these likelihood estimates were still remarkably less bi- ased than those obtained from the parsimony-based analyses for genes evolving with moderate or fast rates( WAKELEY 1993). One reason for the biased estimates of a in the parsimony analysis is that the number of substitutions at a site inferred by parsimony are in fact the number of diJfmences between the ancestral and the descendant sequences, which does not follow the nega- tive-binomial distribution when rates are gamma distrib- uted (YANG and KUMAR 1996). When a correct distribu- tion of number of differences is derived, the bias in the computation of a becomes considerably smaller (com- pare ahp and aMP to a in Table 4 ) . In fact, for slowly evolving genes
ahp
overestimates a only slightly. In gen- eral, parsimony methods underestimate the extent of rate variation because the number of changes inferred at the fast evolving sites are severely underestimation due to long and unequal branches in the tree and the nucleotide frequency and transition rate biases (WAKE- LEY 1993), especially for genes evolving at moderate or fast rates (Table 4 ) .In the estimation of R, ignoring rate variation among sites resulted in more severe underestimation than ig- noring the nucleotide frequency bias and/ or the differ- ences in substitution rates between nucleotides; REV R W ~ + G R R E V + G (Figure 4 C ) . This is because large varia- tion in rates among sites in mtDNA genes causes more severe underestimation of the number of transitional substitutions than the number of transversional substi- tutions at the rapidly evolving sites (WAKELEY 1994). Thus, estimates of R by K80+G and REV show the small- est differences for genes with largest values of a (i.e., least variation of rates among sites; Table
7 ) .
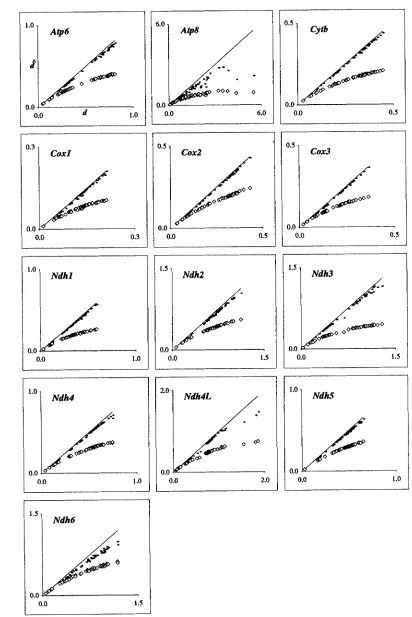
To examine the underestimation of painvise dis- tances by simple models, we assumed that TN93+G
model provides the most reliable estimates of painvise distances ( d )
.
m 9 3 + G was chosen because it is the most complex (and adequate) model for which analyti- cal expressions for computing painvise distances are available. The pairwise distances ( and their variances )estimated by ~ 8 0 + G are quite close to the TN93+G estimates for Atp6, Cytb, Coxl-3, N d h l , and Ndh5 data (Figure 5, Table
7 ) .
Assumption of rate uniformity among sites resulted in 40430% underestimation in painvise distances (compare ~ 8 0 + G and ~ 8 0 ),
and, as expected, this underestimation was greater for distantly related species and in faster evolving genes ( Figure 5 ).
Pairwise distances estimated by K 8 0 and TN93 were al- most identical, and the estimates of painvise distances by ~ c 6 9 + G model were larger than those by ~ 8 0 (and TN93) but lower than those by ~ 8 0 + G and TN934-G
(results not shown). Therefore, the consideration of rate variation among sites along with the transition/ transversion rate bias appear to be of foremost impor- tance in the estimation of pairwise distances from the lst+2nd position data.
I thank Z. YANG, M. NEI, C. A. M. RUSSO, S. B. HEDGES, and J.
ZHANG for helpful discussions and critically reading an earlier draft of this paper. This work was supported by National Science Founda- tion and National Institute of Health grants to M. NEI.
LITERATURE CITED
ADACHI, J., Y. CAo and M. HASEGAWA, 1993 Tempo and mode of mitochondrial DNA evolution in vertebrates at the amino acid sequence level: rapid evolution in warm-blooded vertebrates. J.
ANDERSON, S., M. H. L. BRUIJN, A. R. COULSON, I. C. EPERON, F. SANGER et al., 1982 Complete sequence of the bovine mitochon- drial DNA conserved features of the mammalian mitochondrial genome. J. Mol. Biol. 156 683-717.
ASO ON, U., and A. GULLBERG, 1993 Comparison between the complete mtDNA sequences of the blue and the fin whale, two species that can hybridize in nature. J. Mol. Evol. 37: 312-322.
ARNASON, U., A. GULLBERG and B. WIDEGREN, 1991 The complete nucleotide sequence of the mitochondrial DNA of the fin whale, Balaenqptera physalus. J. Mol. Evol. 3 3 556-568.
AVISE, J. C., 1994 Molecular Markers, Natural Histoly, and Evolution.
Chapman and Hall, New York.
BIBB, M. J., R. A. V. ETTEN, C. T. WRIGHT, M. W. WALBERG and D. A. CLAYTON, 1981 Sequence and gene organization of the mouse mitochondrial DNA. Cell 26: 167-180.
BROWN, W. M., 1985 The mitochondrial genome ofanimals, pp. 95- 130 in MolecularEuolutionaIy Genetics, edited by R. J. M A c I N ~ ~ E . Plenum, New York.
BROWN, W. M., E. M. PRAGER, A. WANG and A. C. WILSON, 1982
Mitochondrial DNA sequences of primates: tempo and mode of evolution. J. Mol. Evol. 18: 225-239.
CARROL, R. L., 1988 Vertebrate Paleontology and Evolution. Freeman, New York.
C W G , Y., F. HUANG and T. LO, 1994 The complete nucleotide sequence and gene organization of Carp ( Cyp-iinus carpio) mito- chondrial genome. J. Mol. Evol. 3 8 138-155.
COLLINS, T. M., F. KRAUs and G. ESTABROOK, 1994 Compositional effects and weighting of nucleotide sequences for phylogenetic analyis. Syst. Biol. 43: 482-496.
DESJARDINS, P., and R. MOMS, 1990 Sequence and gene organiza- tion of the chicken mitochondrial genome: a novel gene order in higher vertebrates. J. Mol. Biol. 212: 599-634.
ESPOSTI, M. D., S. DEVRIES, M. C R " , A. GHELLI, T. PATARNELLO et al., 1993 Mitochondirial cytochrome 6: evolution and structure of the protein. Biochim. Biophys. Acta 1143 243-271.
FELSENSTEIN, J., 1981 Evolutionary trees from DNA sequences: a maximum likelihood approach. J. Mol. Evol. 17: 368-376.
548 S. Kumar
FRYE, M. S., and S. B. HEDGES, 1995 Monophyly of the order Ro- dentia inferred from mitochondrial DNA sequences of the genes for 12s rRNA, 16s rRNA, and tRNA-Valine. Mol. Biol. Evol. 1 2
GADALETA, G., G. PEPE, G . D. CANDIA, C. QUAGLIARIELLO, E. SBISA et al.,
1989 The complete nucleotide sequence of the RattzcF norueg2cu.s
mitochondrial genome: cryptic signals revealed by comparative analysis between vertebrates. J. Mol. Evol. 28: 497-516.
GILLHAM, N. W., 1994 Organelle Genes and Genomes. Oxford Univer- sity Press, Oxford.
GINGERICH, P. D., B. H. SMITH and E. L. SIMONS, 1990 Hind limbs of Eocene Basilosaurus: evidence of feet in whales. Science 249
GINGERICH, P. D., S. M. RAZA, M. ARJF, M. ANWAR and X. ZHOU,
1994 New whale from the Eocene of Pakistan and the origin of cetacean swimming. Nature 368: 844-847.
GOLDING, G. B., 1983 Estimates of DNA and protein sequence diver- gence: an examination of some assumptions. Mol. Biol. Evol. 1:
125-142.
GOLDMAN, N., 1993 Statistical tests of models of DNA substitution. J. Mol. Evol. 36: 182-198.
HASEGAWA, M., and H. KISHINO, 1989 Heterogeneity of tempo and mode of mitochondrial DNA evolution among mammalian or- ders. Jpn. J. Genet. 6 4 243-258.
HASEGAWA, M., H. KISHINO and T. YANO, 1985 Dating the human- ape splitting by a molecular clock of mitochondrial DNA. J. Mol.
HIGGINS, D. G., A. J. BLEASBY and R. FUCHS, 1992 CLUSTAL V: improved software for multiple sequence alignment. Comput. Appl. Biosci. 8: 189-191.
HOLMQUIST, R., M. GOODMAN, T. CONRY and J. CZELUSNIAK, 1983
The spatial distribution of fixed mutations within genes coding for proteins. J. Mol. Evol. 1 9 137-148.
HONEYCUTT, R. L., M. A. NEDBAI., R. M. ADKINS and L. L. JANECEK,
1995 Mammalian mitochondrial DNA evolution: a comparison of the cytochrome b and cytochrome c oxidase I1 genes. J. Mol. Evol. 40: 260-272.
HORAI, S., K. HAYASAKA, R. KONDO, K. TSUGANE and N. TAKAHATA,
1995 Recent african origin of modem humans revealed by complete sequences of hominoid mitochondrial DNAs. Proc. Natl. Acad. Sci. USA 9 2 532-536.
IRWIN, D. M., 1991 Evolution of the cytochrome bgene of mammals. J. Mol. Evol. 32: 128-144.
JANKE, A,, G . FELDMAIER-FUCHS, W. K. THOMAS, A. VON-HAESELER and S. PAABO, 1994 The marsupial mitochondrial genome and the evolution of placental mammals. Genetics 137: 243-256.
JUKES, T. H., and C. R. CANTOR, 1969 Evolution of protein mole- cules, pp. 21-132 in Mammalian Protein Metabolism, edited by H. N. MUNRO. Academic Press, New York.
KIMURA, M., 1980 A simple method for estimating evolutionary rates of base substitutions through comparative studies of nucleotide sequences. J. Mol. Evol. 1 6 111-120.
KISHINO, H., and M. HASEGAWA, 1990 Converting distance to time: an application to human evolution. Methods Enzymol. 183 550-570.
KOCHER, T. D., and A. C. WIISON, 1991 Sequence evolution of mito- chondrial DNA in human and chimpanzees: control region and a proteincoding region, pp. 391-413 in Evolution of Lije, edited by S. OSAWA and T. HONJO. Springer-Verlag, New York. KUMAR, S., K. TAMURA and M. NEI, 1994 MEGA molecular evolu-
tionary genetics analysis software for microcomputers. Comput. Appl. Biosci. 10: 189-191.
LANAVE, C., G. PREPARATA, C. SACCONE and G . SERIO, 1984 A new method for calculating evolutionary substitution rates. J. Mol.
LYNCH, M., and P. E. JARRELL, 1993 A method for calibrating molec- ular clocks and its application to animal mitochondrial DNA. Genetics 135: 1197-1208.
MARTIN, R. D., 1993 Primate origins: plugging the gaps. Nature 363:
NAVIDI, W. C., G . A. CHURCHIL and A. VON HAESELER, 1991 Methods for inferring phylogenies from nucleic acid sequence data by using maximum likelihood and linear invariant. Mol. Biol. Evol.
8: 128-143.
NEI, M., 1987 Molecular Euolutionaly Genetics. Cambridge University Press, New York.
NEI, M., 1991 Relative efficiencies of different tree making methods
168-176.
154-157.
EvoI. 22: 160-174.
EvoI. 20: 86-93.
223-234.
for molecular data, pp. 133-147 in Recent Advances in Phylogenetic
Studies of DNA Sequences, edited by M. M. MNAMOTO and J. L. CRACRAFT. Oxford University Press, Oxford.
NEI, M., 1992 Age of the common ancestor of human mitochondrial DNA. Mol. Biol. Evol. 9: 1176-1178.
PERNA, N. T., and T. D. KOCHER, 1995 Unequal base frequencies and the estimation of substitution rates. Mol. Biol. Evol. 1 2 359-361.
RAGAN, C. I., 1987 Structure of NADH-ubiquinone reductase (Com- plex I ) . Curr. Top. Bioenerg. 15: 17-35.
REEVES, J. H., 1992 Heterogeneity of the substitution process of amino acid sites of proteins coded for by mitochondrial DNA.
&TIAND, IC, and M. T. CI.EGG, 1987 Evolutionary analysis of plant DNA sequences. Am. Nat. 130: S744100.
ROE, B. A,, D.-P. M A , R. K. WILSON and J. F.-H. WONG, 1985 The complete nucleotide sequence of the Xenopus laevis mitochon- drial genome. J. Biol. Chem. 260: 9759-9774.
Russo, C. A. M., N. T m m and M. NEI, 1996 Efficiencies of differ- ent genes and different tree-building methods in recovering a known vertebrate phylogeny. Mol. Biol. Evol. (In press). RZHETSKY, A,, and M. NEI, 1995 Tests of applicability of several s u b
stitution models for DNA sequence data. Mol. Biol. Evol. 12:
131-151.
SACCONE, C., C. LANAVE, G . PESOLE and G . PREPARATA, 1990 Influ- ence of base composition o n quantitative estimates of gene evolu- tion. Methods Enzymol. 183: 570-583.
SIMON, C., F. FRATI, A. BECKENBACH, B. CRESPI, H. LIU rt al., 1994
Evolution, weighting, and phylogenetic utility of mitochondrial gene sequences and a compilation of conserved polymerase chain reaction primers. Ann. Entomol. Soc. Am. 87: 651-701.
STORER, T. I., R. L. USINGER, R. C. STEBBINS and J. W. NYBAKKEN,
1971 General Zoology. McGraw Hili, New York.
TAMURA, K, 1994 Model selection in the estimation of the number of nucleotide substitutions. Mol. Biol. Evol. 11: 154-157.
TAMURA, K., and M. NEI, 1993 Estimation of the number of nucleo- tide substitutions in the control region of mitochondrial DNA in humans and chimpanzees. Mol. Biol. Evol. 10: 512-526.
TATENO, Y., N. TAKE- and M. NEI, 1994 Relative efficiencies of the maximum likelihood, neighbor-joining, and maximum parsi- mony methods when substitution rate varies with site. Mol. Biol. Evol. 11: 261-277.
TAVARE, S., 1986 Some probabilistic and statistical problems on the analysis of DNA sequences. Lect. Math. Life Sci. 17: 57-86.
TZENG, C.S., C.-F. HUI, S.-C. SHEN and P. C. HUANG, 1992 The complete nucleotide sequence of the Crossostoma lacustrr mito- chondrial genome: conservation and variation among verte- brates. Nucleic Acids Res. 20: 4853-4858.
VIGILANT, L., M. STONEKING, H. HARPENDING, K. HAWKES and A. C. WILSON, 1991 African populations and the evolution of human mitochondrial DNA. Science 253: 1503-1507.
WAKELEY, J., 1993 Substitution rate variation among sites in hypervd- riable region I of human mitochondrial DNA. J. Mol. Evol. 37:
613-623.
WAKFLEY, J,, 1994 Substitution rate variation among sites and the estimation of transition bias. Mol. Biol. Evol. 11: 436-442.
WOI.STENHOI.ME, D. R., 1992 Animal mitochondiral DNA structure and evolution. Int. Rev. Cytol. 141: 173-216.
YANG, Z., 1994a Estimating the pattern of nucleotide substitution.
YANG, Z., 1994b Maximum likelihood phylogenetic estimation from DNA sequences with variable rates over sites: approximate meth- ods. J. Mol. Evol. 39: 306-314.
YANG, Z., 1995a Evaluation of several methods for estimating phylo- genetic trees when substitution rates differ over nucleotide sites.
YANG, Z., 1995b O n the use of nucleic acid sequences to infer early branchings in the tree of life. Mol. Biol. Evol. 12: 451-458.
YANG, Z., 1 9 9 5 ~ PAML: Phylogenetic Analysis b~ Maximum Likelihood.
Institute of Molecular Evolutionary Genetics, The Pennsylvania State University, University Park.
YANG, Z., and S. KUMAR, 1996 Approximate methods for estimating the pattern of nucleotide substitution and the variation of substi-
YANC, Z., N. GOLDMAN and A. E. FRIDAY, 1995 Maximum likelihood tution rates among sites. Mol. Biol. Evol. (in press).
trees from DNA sequences: a peculiar statistical estimation p r o b lem. Syst. Biol. 44: 384-399.
J. Mol. EvoI. 35: 17-31.
J. Mol. EvoI. 3 9 105-111.
J. Mol. EvoI. 40: 689-697.