Electrical Distribution Reliability
Ashraf Abd Almageed Ahmad1, Dr.Eltahar Mohammed Hussein2
Graduate College Studies, Al-Neelain University, Khartoum, Sudan
Faculty of Engineering, Sudan University of Science and Technology, Khartoum Sudan
ABSTRACT: The continuous power outages and interruptions in the instantaneous electrical parts distribution network always adversely affect the health, safety and economic activity and the low level of production in the industrial sector .the paper discusses the reliability of the electric distribution network through the study of indicators of reliability analysis technology which is characterized as a fast, efficient and know that by SAIFI, SAIDI, CAIDI, MAIFI, CTAIDI, in order to repeat the failures at different times for Lines 33KV and 11KV, from readings to the control station for the automated distribution network for the Omdurman area.
KEYWORDS:SAIFI, SAIDI, CAIDI, CAIFI, MAIFI, CTAIDI, distribution, reliability.
I.INTRODUCTION
Provide consumers with electric power in the range of distribution of electrical networks in a way that the quality of service and high reliability, and that the importance of the reliability of electrical distribution networks as a factor of development and economic growth, as studies have shown which confirmed that 80% of interruptions in the supply of electric power resulting from the problems and breakdowns in the electrical distribution networks [1,2] .
Electrical distribution systems are usually radially so exposed to the rates of interruption because of system components of transformers and breakers and switching devices, the growing demand for customers to provide high-quality service makes requirements for improvements in the electrical distribution network.
The main objective of assessing the reliability of the electrical distribution network, a qualitative analysis of indicators of to improve the reliability of supply voltage and planning system after analysis, there are two types of analysis: -
1 Monte Carlo approach to simulate the user to calculate the reliability indices.
2 Bayesian network approach, a more effective way of theoretical models to see replacement based on theoretical possibilities.
The main problems in the supply of energy are the consequences of errors in one or part of the components of a network failure overhead lines or cables[1,2,10,11,13,14].
II. METHODOLOGY
Using the analysis of the automatic control system for electrical distribution networks by using reliability indices in the case study area of Omdurman distribution network by describing the data readings and analytical tables.
III. RELIABILITY INDICES
The main reason for power outages due to the fact that there are errors in the distribution network, such as wind, rain, trees, animals, and called for all the mistakes claim indirectly for the disappearance of electrical disappear either ill unforced errors such as car accidents, equipment breakdowns .
Indicators are used to assess the reliability of the electric distribution network and analyse the data set of network, The indicators used in the analysis of the electrical distribution network[3,4,5] .
1- System Average Interruption Frequency Index ( SAIFI ):-
Represents the average frequency of interruptions faced by every consumer subscribers in the electrical distribution system in a specific area and a specific time.
SAIFI =
… (1)
= ∑ ...(2)
N ≡ The number of consumers affected by the rupture of nutrition during the time period studied
N ≡ The total number of consumers associated the studied area.
2- System Average Interruption Duration Index (SAIDI ) :-
Is an indication of the time required to restore electricity to consumers affected by the electrical interruption.
SAIDI =
...(3)
= ∑ …(4) r ≡ Duration of interruption of nutrition in each case interruption
3- Customer Average Interruption Duration Index (CAIDI) :-
Index shows the average time required to restore electric current to consumers affected by the interruption.
CAIDI= TotalDurationofInterruptions
TotalNumberofInterruptions …(5)
=∑∑ = …(6)
4- Customer Total Average Interruption Duration Index (CTAIDI ):-
Represents the average amount of time consumers have suffered a interruption .
CTAIDI =
… (7)
5- Customer Average Interruption Frequency Index (CAIFI
):-Measures the average number of interruptions per.
CAIFI =
(8)
6- Momentary Average Interruption Frequency Index (MAIFI ):-
MAIFI =
…(9)
=∑ …(10)
ID ≡ Number of interrupting device operations.
7- Average Service Availability Index (ASAI ):-
The average service availability index is the ratio of the number of hours that the service is available to consumers on the total hours required to be provided to consumers during a specific time period. This is sometimes called the service reliability index [6,12,15].
ASAI = …(11)
= = …(12)
= (∑ ) 100 …(13) T = Time period under study, hours.
IV. CASE STUDY OF ELECTRICAL DISTRIBUTION OMDURMAN AREA RELIABILITY
Electricity distribution network consists of Omdurman stations distributional represents the link between the transmission and distribution lines, and these stations of different capacities are converted 110kv to 33kv and 11kv. Consider the study to the distribution system through the network reliability medium voltage lines 110kv to 33kv and 11kv, 33kv lines that supply the transformers reduction to 11kv and at distribution sub-stations. The 11kv lines that supply the transformers reduction to 240v and 415v line to line.
Network and the distribution of Omdurman area exposed some areas where interruption .
where it is to drop the following cases :-1- transient errors
2- maintenance work
3- commends the work
4- equipment failures and breakdowns General(Faults directly) [7,8].
The following table(1) shows illustrates the inter drop to 33kv lines during the year (2011).
The table(2) shows the values of readings CAIDI during the year to 33KV lines. Paper find that the system of distribution network in Omdurman area with high reliability during the month of January and February and then declining in March and then start with increase reliability and so decrease the values CAIDI and affected by the change in the values of SAIFI and SAIDI and that in the months of April and May until you reach the highest reliability during the year in June to start downward in July to reach its lowest value in the months of August and September, and that with the highest value for Said. The value remains CAIDI the seesaw in the average rate in the months October, November and December shown that at Figure (3) and Figure (4) .
Table (1) 33kv Lines readings in 2011 from the control room of Omdurman
The total number of interruptions The total
number Outage
Runtime total The total time
of the breakdowns month
19 16
12 11904
26:47:00 January
16 16
12 37632
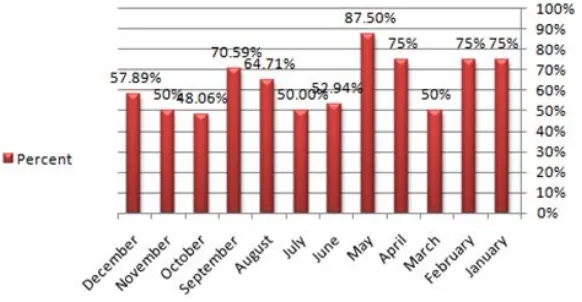
Figure (1):- The proportion of the total number to the total number of interruptions at 33kv
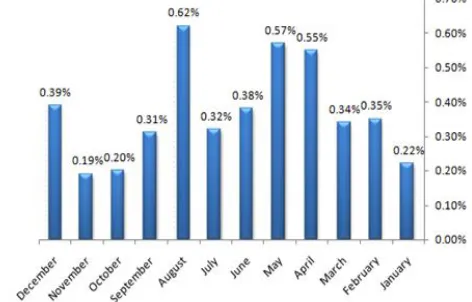
Figure (2):- The proportion of the total time of interruptions to the total operation time
1.47 .00157
.00107 .769
.529 2.78
June
.58 .002320
.004 2.97
.5 1.161
July
2.47 .005322
.00822 1.55
.647 3.818
August
1.7 .00961
.00565 4.07
.706 2.417
September
1.06 .002286
.0021567 1.521
.47 2.25
October
.889 .003945
.00444 3.196
.5 1.778
November
1.7368 .00521
.00299 2.23
.5789 3
December
Figure (3):- SAIFI ,CTAIDI ,CAIFI Sketch shows during the year 2011 to lines 33kv
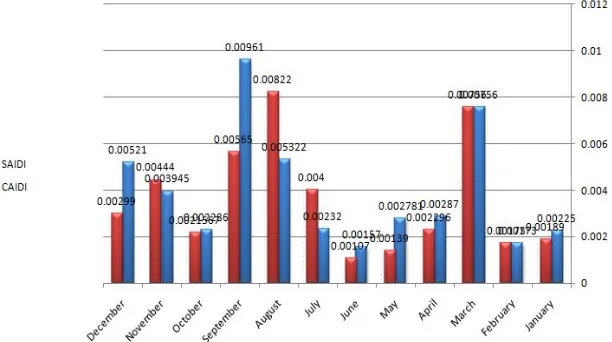
Figure (4):- SAIDI ,CAIDI Sketch shows during the year 2011 to lines 33kv
Table (3) 11kv Lines readings in 2011 from the control room of Omdurman
Figure (5):- The proportion of the total number to the total number of interruptions at 11kv
Figure (6):- The proportion of the total time of interruptions to the total operation time at 33kv The total number
of interruptions The total
number Outage
Runtime total The total time of
the breakdowns Month
131 82
52 61008
131:39:00 January
141 82
49 55104
191:31:00 February
209 82
58 61008
210:23:00 March
255 82
63 59040
326:00:00 April
347 82
65 61008
348:42:00 May
284 93
65 66960
254:24:00 June
384 214
130 159216
508:58:00 July
398 93
75 66960
412:46:00 August
269 93
57 66960
209:20:00 September
237 94
64 69936
138:47:00 October
124 94
46 67680
128:10:00 November
159 98
57 72912
Table (4) CAIFI ,MAIFI ,CTAIDI ,CAIDI ,SAIDI ,SAIFI For 33kv of the distribution network Omdurman
SAIFI SAIDI
CAIDI CTAIDI
MAIFI CAIFI
month
1.5976 .002157
.00135 1.005
.634 2.52
January
1.7196 .003476
.00202 1.36
.598 2.878
February
2.549 .00345
.00135 1.007
.7 3.6
March
3.11 .00552
.00177 1.28
.768 4.05
April
4.23 .0057
.00135 1.005
.79 5.34
May
3.0212 .003799
.00126 .896
.69 9 4.37
June
1.7935 .0032
.00178 1.325
.6 2.95
July
4.279 .006165
.00144 1.052
.8 5.3
August
2.892 .003126
.0011 .778
.613 4.72
September
2.521 .001984
.000787 .586
.68 3.7
October
1.319 .00948
.007187 1.034
.489 2.696
November
1.622 .00395
.00235 1.81
.58 2.78
December
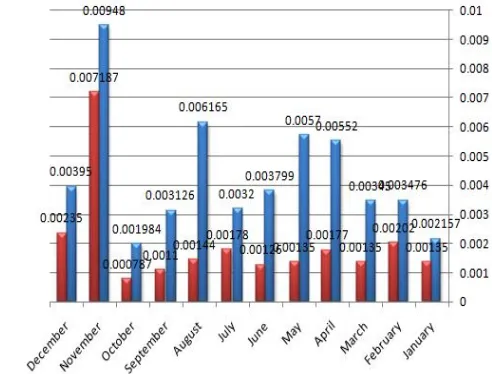
Figure (7):- SAIFI ,CTAIDI ,CAIFI Sketch shows during the year 2011 to lines 11kv
V.CONCLUSION
The study observed that CAIDI representing an indicator to measure the automated transformation of the electricity supply interruptions for customers and automated transformation process reduces the number of consumers affected by the interruptions.
Also, for the automated control a prominent role in the operation more efficient and by isolating and shutting down and restarting the affected areas interruptions , The transformation process in the feed Power Supply divided into sections according to consumer areas can reduce the interruptions thereby increasing reliability as measured by MAIFI , SAIFI. The reliability study will help in the work of the future plans in network expansion and rehabilitation, as well as maintenance of the lines with a number of times the most interruption.
VI .RECOMMENDATIONS
To increase the reliability of the distribution network Omdurman This means reducing the period of interruption for consumers and that corrective maintenance and preventive maintenance of the lines most of the time of interruption during the study and the establishment of a secondary feed lines to minimize outage time.
VII .ACKNOWLEDGEMENT
Authors thank the staff of the company for the Sudanese Electricity Distribution - Co. Ltd., which helped get loads of energy and logs errors for a year of study.
REFERENCES
1. Eng. Nasr nashat, “ Using specialized software in Evaluating the reliability of electric networks of the Syrian system,” , 2013, Damascus
University Journal of Engineering Science Volume 29, Issue I.
2. C. Bhargava, P.S.R. Murthy and V. Krishna Murthy,. “ Reliability Analysis of Distribution Automation on Different Feeders ,” 2011, Bonfring
International Journal of Power Systems and Integrated Circuits, Vol. 1, Special Issue .
3. Roy Billinton and Ronald N. Allan , , “ Reliability Evaluation of Power Systems Second Edition,”,1996 Plenum Press, New York.
4. T.A. Short, “ Electric POWER distribution handbook,” , 2004 , Boca Raton London New York Washington, D.C.
5. IEEE std 1366-1998, IEEE trial use guide for electric power distribution reliability indices.
6. C.Bhargava, P.S.R Murty2, K.Rajender3, “ Reliability Enhancement of Radial Distribution System Considering Different Alternatives,”
International Journal of Advanced Research in Electrical, Electronics and Instrumentation Engineering, Vol. 2, Issue 8, August 2013.
7. Onime Franklin and Adegboyega Gabriel A. September, “ Reliability Analysis of Power Distribution System in Nigeria: A Case Study of
Ekpoma Network, Edo State”, International Journal of Electronics and Electrical Engineering Vol. 2, No. 3, September, 2014
8. J. Duncan Glover, Mulukutla S. Sarma, Thomas J. Overbye “ POWER SYSTEM ANALYSIS AND DESIGN ,” .
9. C. R. Bayliss CEng FIET and B. J. Hardy ACGI CEng FIET, “ Transmission and Distribution Electrical Engineering Third edition ,” 2007
Charon Tec Ltd (A Macmillan Company), Chennai, India.
10. M. H. Shwehdi, Dr. Suliaman Forteah, S. Raja Mohammad., “ DG Placements Impact on the Reliability of Typical Industrial Distribution
System in Saudi Arabia , ” International Journal of Automation and Power Engineering (IJAPE) Volume 3 Issue 2, March 2014.
11. C.Bhargava, P.S.R Murty, K.Rajender , “ Reliability Enhancement of Radial DistributionSystem Considering Different Alternatives , ”
International Journal of Advanced Research in Electrical,Electronics and Instrumentation Engineering, Vol. 2, Issue 8, August 2013.
12. Basudev Das, Dr Bimal C Deka , “ Impact of Location of Distributed Generation On Reliability of Distribution System,” International Journal
of Engineering Research and Development, Volume 9, Issue 5 (December 2013), PP. 01-08.
13. L. Gao - Y. Zhou - C. Li - L. Huo , “RELIABILITY ASSESSMENT OF DISTRIBUTION SYSTEMS WITH DISTRIBUTED GENERATION
BASED ON BAYESIAN NETWORKS,” Engineering Review, Vol. 34, Issue 1, 55-62, 2014.
14. Atthapol Ngaopitakkul, Boonlert Suechoey, “A Reliability Impact and Assessment of Distributed Generation Integration to Distribution
System,” Energy and Power Engineering, 2013, 5, 1043-1047.
15. T. Lantharthong, N. Phanthuna. “Techniques for Reliability Evaluation in Distribution System Planning ,” World Academy of Science,