Copyright1998 by the Genetics Society of America
The Number of Self-Incompatibility Alleles in a Finite, Subdivided Population
Mikkel Heide Schierup
Department of Ecology and Genetics, Institute of Biology, University of Aarhus, DK-8000 Aarhus C, Denmark Manuscript received November 10, 1997
Accepted for publication February 27, 1998
ABSTRACT
The actual and effective number of gametophytic self-incompatibility alleles maintained at mutation-drift-selection equilibrium in a finite population subdivided as in the island model is investigated by stochastic simulations. The existing theory founded byWrightpredicts that for a given population size the number of alleles maintained increases monotonically with decreasing migration as is the case for neutral alleles. The simulation results here show that this is not true. At migration rates above Nm 5 0.01–0.1, the actual and effective number of alleles is lower than for an undivided population with the same number of individuals, and, contrary toWright’s theoretical expectation, the number of alleles is not much higher than for an undivided population unless Nm,0.001. The same pattern is observed in a model where the alleles display symmetrical overdominant selection. This broadens the applicability of the results to include proposed models for the major histocompatibility (MHC) loci. For a subdivided population over a large range of migration rates, it appears that the number of self-incompatibility alleles (or MHC-alleles) observed can provide a rough estimate of the total number of individuals in the population but it underestimates the neutral effective size of the subdivided population.
I
N a controversial paper,Wright (1939) presented minor correction to the variance component his formu-lae predict the number of S -alleles very well despite a mathematical model for the number of alleles ina single-locus multi-allelic gametophytic self-incompati- their violation of the assumptions behind the diffusion approximation. The accuracy of his formulae was later bility (GSI) system that can be maintained at
equilib-rium between selection, mutation and drift in a finite confirmed by computer simulations (EwensandEwens 1966;Mayo 1966;Crosby 1966), and the debate was population. He used a diffusion approximation to
de-rive the stationary frequency distribution from which laid to rest. A more tractable and slightly improved form-ula to estimate the number of S-alleles in a finite popform-ula- popula-the number of alleles can be determined as popula-the
recip-rocal of the mean of the distribution integrated from tion was later given byYokoyamaandNei(1979), and YokoyamaandHetherington(1982) investigated the 1/(2N ) to 1, where N is the number of individuals. His
motivation for the work was to explain the finding by expected number of S -alleles in a sample.
Although Wright’s treatment showed that a large Emerson(1939) of 37 alleles in a sample from a
popula-tion of only about 500 individuals. His results showed number of alleles is maintained under GSI, the number of alleles observed byEmersonin an isolated population that a large number of alleles is indeed maintained due
to the very strong frequency-dependent selection. The of 500 individuals could not be explained under biologi-cally reasonable values of the mutation rate (u,1025). work was, however, criticized first byFisher(1958) and
later byMoran (1962). They maintained that the use Therefore,Wrightextended his theory in the second part of the 1939 paper to investigate the effect of popula-of the diffusion approximation was invalid because
se-lection is strong enough to change the frequency of an tion subdivision. A basic observation from his theory for an undivided population is that the relation between allele drastically in one generation, e.g., from 1/(2N )
to 1/2 in one generation with three alleles, and because population size and the number of S-alleles is concave. Therefore, in a finite subdivided population, the num-the frequency change of an allele in one generation
depends not only on its own frequency but also on the ber of S-alleles maintained in the population will be greatest when the population is divided into completely frequency of all other alleles, i.e., the problem has a
dimension equal to the total number of self-incompa- isolated subpopulations because subpopulations under the infinite alleles model will contain, after sufficient tibility (S-) alleles in the population. Wright (1960,
1964) replied to these criticisms and showed, by compar- time, a unique set of alleles each. Migration between subpopulations will oppose this effect and reduce the ison toFisher’s derivations, that with the addition of a
total number of alleles, but Wright posited that the number of S-alleles maintained in any subdivided popu-Address for correspondence: Mikkel Heide Schierup, Department of lation will still exceed that of an undivided population
Ecology and Genetics, University of Aarhus, Building 540, Ny
Munke-of equal total size. This conjecture was later shown to
gade, DK-8000 Aarhus C., Denmark.
E-mail: [email protected] be correct for neutral alleles (Nagylaki1985).Wright
(1939) produced formulae that quantitatively describe and quantitative effects of population subdivision on the number of S -alleles maintained at equilibrium in a the effect of migration using a finite island model with
pollen migration. He concluded that subdivision with finite population. To date, only Wright’s theory has modelled the number of alleles maintained by balanc-small, but reasonable pollen migration rates (mp 5
0.002–0.02) can greatly increase the number of S-alleles ing selection in a subdivided population, and therefore his theory has also been referred to in discussions of in the population. But his conclusions were based on
four numerically solved examples of a set of formulae symmetrical overdominant selection (Takahata1993). The (unknown) mechanism responsible for the high derived using a number of crude approximations. Their
accuracy has never been checked in detail.Ewensand polymorphism and allelic diversity of several loci in the major histocompatibility complex (MHC, and the ho-Ewens (1966) performed a single simulation of the
finite island model of S-alleles and concluded that the mologous HLA system in humans) is mimicked by sym-metrical overdominance or the closely related model of effect of subdivision is small. However, they used a very
high migration rate and did not relate their results to frequency-dependent selection by minority advantage (Takahata1990;TakahataandNei1990), assuming Wright’s.
In recent years, the loci believed to be responsible for selection coefficients in the range of 0.1–10% ( Maru-yama and Nei 1981; Takahata et al. 1992; Satta et the incompatibility reaction have been cloned in the
single-locus, multi-allelic GSI systems of Solanaceae al. 1994). Inferences about long-term human evolution
based on MHC allele surveys have been made assuming (Anderson et al. 1986) and Papaveraceae (Papaver
rhoeas; Foote et al. 1994), which revealed that these symmetrical overdominance in an undivided popula-tion (Kleinet al. 1990; Takahata1993; Ayala 1995; systems evolved independently. The frequency
depen-dent selection is theoretically expected to give extremely AyalaandEscalante1996), so it is also important to study the effect of subdivision on the number of alleles long coalescence times of alleles (Vekemansand
Slat-kin1994). This prediction is consistent with analyses of maintained under symmetrical overdominance. I have used stochastic simulations to characterize the nucleotide sequences in the Solanaceae (Ioergeret al.
1990) where alleles show some transspecific polymor- dynamics of S-alleles in a finite island model at mu-tation-selection-drift equilibrium. Following Wright phisms and coalescence times of all S-alleles within a
species have been estimated to be 40–80 million years. (1939), a finite island model of equally sized demes with pollen migration is considered, and the results are Recently,Richmanet al. (1995, 1996a,b) found highly
divergent nucleotide sequences between alleles in natu- compared to values obtained from his formulae. The quantitative effects of subdivision of a fixed number of ral populations of two Solanaceous species. Using the
theory byWright(1939) andVekemansandSlatkin individuals are considered, and the stationary frequency distributions of alleles under different migration rates (1994), they estimated the coalescence time of all alleles
to infer the long-term effective population size, and and population sizes are analyzed. Furthermore, the effect of relaxing the assumption of a fixed migration they estimated the total number of S-alleles from their
sample to derive the short-term effective population size rate is studied. For S-alleles, the effective migration rate after mating exceeds the proportion of migrating pollen for each species. They concluded that the two species
had very different population histories and size and if migrants are more likely to be compatible than nonmi-grants. A model of symmetrical overdominance is also argued that these differences might partly be explained
by differences in their ecology (Richmanet al. 1996b; studied, and the qualitative results of both models are compared to the theory for neutral variation in a subdi-Richman and Kohn 1996). However, these estimates
assume that each species forms a single panmictic popu- vided population. lation. This is unlikely, because individuals of both
spe-cies inhabit large fragmented areas.
THEORY In Papaveraceae, the number of S-alleles and their
fre-quencies have been estimated from controlled crosses Single population: Gametophytic self-incompatibility: Consider in four populations of Papaver rhoeas (Lawrence and a population of N diploid individuals with a gametophytic self-incompatibility system with naalleles, S1, S2,...,Sna. In this system
O’Donnell1981;Lawrenceet al. 1993;Laneand
Law-the compatibility reaction is determined by matching eiLaw-ther rence1993). Contrary to the expectation for a
panmic-of the two alleles in the style with the allele in the pollen. If tic population, these studies showed that the
frequen-either allele matches, the combination is incompatible. No cies of S -alleles are highly unequal. Furthermore, even other selection occurs. Mutation is at the rate u, with new widely separated populations share a large fraction of S-alleles generated according to the infinite alleles model, i.e.,
no back-mutation is allowed. the alleles. The two alleles so far sequenced only show
At least three alleles are necessary for the system to work, 55% similarity in the deduced amino acid sequence,
and all individuals are heterozygous. Selection under GSI is but two copies of one of the alleles, from a British and
mansandSlatkin1994). The stationary frequency spectrum the deme, and the corresponding equations at equilibrium between mutation and loss of alleles in the total population.
φ(q) of a given allele was derived by Wright (1939) using
diffusion approximation. At equilibrium, the mutation rate Neutrality and symmetrical overdominance: Neutrality was ana-lyzed byMaruyama(1970) who obtained explicit expressions balances the loss of alleles due to drift:
for the effective number of alleles under the finite island and stepping stone models, andNagylaki(1985) proved that nE for a subdivided population under any migration pattern al-u5 n(n23)
4N(n21) 1 2Nφ
1
1
2N
2
. ways exceeds the value for an undivided population, though the increase is significant only when Nm ,1. Symmetrical (Wright1939). The number of alleles can be found bynu-overdominance in a subdivided population has not been merical solution of this equation and the condition treated analytically.
#
1/2 1/2Nφ(q)dq51
COMPUTER SIMULATIONS on the gene frequency spectrumφ.YokoyamaandNei(1979)
The evolutionary dynamics of S-alleles were simulated for provide a simpler formula that gives slightly different results
a diploid population of P demes each with N individuals, giv-because it is based on a different variance component more
ing a total population size of Nt5 PN. The mating process
appropriate for a self-incompatibility system (Fisher 1958;
for a single generation was as follows: For each deme a random Wright 1960). However, to allow a direct comparison,
individual among the N present was chosen as the maternal Wright’s formulae are used in this study.
parent. A pollen genotype was then randomly chosen with Neutrality and symmetrical overdominance: The expectation for
probability (12mp) from the same deme and with probability
the effective number of alleles nE(nE51/F, where F is the
mpfrom the total population. For the GSI model the pollen
population fixation index) maintained in a population of N
is then checked for compatibility with the maternal plant by individuals was derived by Kimura andCrow (1964) for a
matching the haploid pollen genotype with each of the alleles neutral locus and a locus with symmetrical overdominance.
of the maternal parent. If the combination is compatible, For the neutral locus nE 5 1/(4Nu1 1). For symmetrical
one of the two alleles of the maternal parent is then picked overdominance nEis found by a diffusion approximation
ap-randomly and combined with the pollen allele to form a new proach very similar to the one described for GSI.Ewens(1964)
zygote. If the combination is incompatible, the pollen is dis-obtained expressions for the actual number of alleles nafor
carded and the ovule retained, i.e., the pollen elimination both neutrality and symmetrical overdominance.
model ofFinney(1952). Depending on the migration model,
Subdivided population:Population subdivision is modelled
a new pollen donor can either be chosen to have the same using the finite island model with P equally sized
subpopula-migratory status (“pollen packet” migration model), or else tions. Migration between the subpopulations occurs
exclu-the migratory status of exclu-the pollen donor is again randomly sively via pollen, i.e., a pollen cloud of migrants, at a constant
determined (“single pollen” migration model). The “pollen rate mp. The migration rate m by both sexes that is usually
packet” migration model was assumed byWrightand can be used in the island model differs from mpbut to a good
approxi-thought of as migration mediated by a pollinator carrying mation,
pollen grains from several sources, whereas “single pollen” migration assumes that pollen arrives to a given stigma inde-m51
2mp pendently, e.g., by wind. The difference between the migration models is that, with the “pollen packet” model, the proportion of successful matings by migrating pollen is mpwhereas with
(Wright 1939). I refer to this migration rate as m
pexcept
“single pollen” migration the proportion of successful matings when discussing the number of migrants, which is usually
by migrating pollen is larger than mpif a pollen grain is less
denoted by
likely to get a fertile mating in a within-deme cross than in a between-deme cross. The mating process is repeated until N Nm51
2Nmp. new zygotes are produced in each deme. Each gene is then subjected to mutation with probability u, with each mutation Gametophytic self-incompatibility: Wright(1939) extended the giving rise to a new allelic type (the infinite alleles model). theory to a subdivided population by constructing the station- The maximal migration rate is mp51, in which case all pollen
ary frequency distribution for an allele in the total population. grains are drawn randomly from the population, but ovules To be able to use the diffusion approximation for this prob- remain within demes (equivalent to m50.5).
lem,Wrightassumed the following: (1) The proportion of For the symmetric overdominance model, a combination demes where a given allele is present is proportional to its of maternal and paternal gametes is retained if the gametes frequency; (2) a given allele has roughly the same frequency have different genotypes; otherwise the homozygous zygote is in all the demes in which it occurs; and (3) an incoming discarded with probability s, the selection coefficient against migrant allele is equally likely to be of any extant type. homozygotes. In this case, only the “pollen packet” migration
model is used. If the mutation rate is small, these assumptions imply that
the stationary frequency distribution of an allele in the total Number of alleles: Each run was started with either 2Nt
different alleles or, in the case of large population sizes, with population is expected to be approximately symmetric, as in
a single population. 20 (GSI) or 7 (overdominance) alleles, in order to reach equilibrium faster. The population was allowed to evolve for These approximations allow the problem to be reduced to
one dimension, where the process is determined by the bal- the larger of 100/(Ntu) and 60,000 generations before starting
to record the average number of alleles per deme, the total ance between migration/mutation and drift in the local demes
and by the balance between mutation and drift in the total number of alleles, and the corresponding effective number of alleles. These statistics were then recorded every 1/(1000u) population. The number of alleles maintained can then be
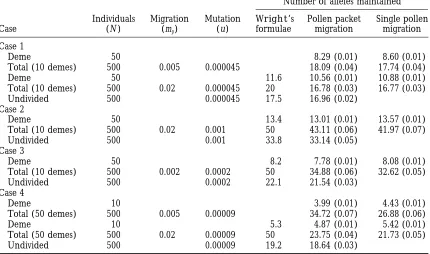
TABLE 1
Comparison of Wright’s theory with simulations
Number of alleles maintained
Individuals Migration Mutation Wright’s Pollen packet Single pollen Case (N ) (mp) (u) formulae migration migration
Case 1
Deme 50 8.29 (0.01) 8.60 (0.01)
Total (10 demes) 500 0.005 0.000045 18.09 (0.04) 17.74 (0.04)
Deme 50 11.6 10.56 (0.01) 10.88 (0.01)
Total (10 demes) 500 0.02 0.000045 20 16.78 (0.03) 16.77 (0.03) Undivided 500 0.000045 17.5 16.96 (0.02)
Case 2
Deme 50 13.4 13.01 (0.01) 13.57 (0.01)
Total (10 demes) 500 0.02 0.001 50 43.11 (0.06) 41.97 (0.07)
Undivided 500 0.001 33.8 33.14 (0.05)
Case 3
Deme 50 8.2 7.78 (0.01) 8.08 (0.01)
Total (10 demes) 500 0.002 0.0002 50 34.88 (0.06) 32.62 (0.05)
Undivided 500 0.0002 22.1 21.54 (0.03)
Case 4
Deme 10 3.99 (0.01) 4.43 (0.01)
Total (50 demes) 500 0.005 0.00009 34.72 (0.07) 26.88 (0.06)
Deme 10 5.3 4.87 (0.01) 5.42 (0.01)
Total (50 demes) 500 0.02 0.00009 50 23.75 (0.04) 21.73 (0.05) Undivided 500 0.00009 19.2 18.64 (0.03)
The number of alleles obtained fromWright’s theory and the number of alleles at equilibrium (SE) from simulations using the “pollen packet” and “single pollen” migration models are compared for the four cases previously reported byWright(1939). For each case, the number of alleles in an undivided population, the average number of alleles within demes and the number in the total population for each subdivided population are given. For Case 1 and 4, results from simulations are also given for a fourfold reduction in migration rate. The number of alleles calculated byWrightare also included. The pollen migration rate is m
p52m, where
m is the migration rate for both sexes.
parameter set 30 (for Nt 52,000) or 100 (otherwise) such sets for whichWright(1939) gave a numerical solution. replicates were performed and standard deviations calculated Results are given with both the “pollen packet” migra-over these replicates.
tion model (assumed byWright) and the “single
pol-Stationary frequency distributions:For a few parameter sets,
len” migration model and results of simulations with a the stationary frequency distribution at equilibrium was
re-corded by observing the frequencies of each allele (both in fourfold reduction in migration rate are also given for the deme and in the total population) at 200 generation inter- two of the parameter sets (Cases 1 and 4). The results vals over 20,000 generations with five replicates as defined for the undivided populations are slightly lower than above so that at least 10,000 allele frequencies were recorded
Wright’s predictions in all four cases, but less than 5% for each parameter set investigated. To checkWright’s
as-different. For the subdivided populations, however, the sumption 1, the corresponding values of the frequency of a
given allele, and the number of demes where it is present simulated results differ markedly fromWright’s predic-were recorded, and to check Wright’s assumption 2, the
tions in that the increase in the number of alleles main-frequency of each allele in each deme where it is present was
tained in the total population is far less than predicted, also recorded.
although the number of alleles in the local deme is The computer program was written so that it could check for
more accurately predicted by Wright’s formula. The its ability to produce results in concordance with the existing
theory for neutral alleles by switching off the test for compati- fit to the prediction is poorest when the mutation rate is bility of two gametes. Furthermore, an independently devel- low and subdivision is greatest (Case 4). Even a fourfold oped program by X.Vekemans(Universite´ Libre De Bruxelles,
decrease in migration rate does not give the total num-Belgium) was found to give identical results. The computer
ber of alleles predicted byWright. The “single pollen” program is written in the C language, and is available from
me by request. model (Table 1, last column) leads to an increase in the number of alleles in the local deme, but the number of alleles maintained in the total population is further RESULTS
decreased. The remaining results are all based on the “pollen packet” migration model.
Gametophytic self-incompatibility: Table 1
Figure3.—The number of S-alleles n
ain the total
popula-tion (6 SE), the effective number of S -alleles in the total Figure 1.—Stationary frequency distributions for an
undi-population nE, and the average number of S -alleles in the
vided population (N5500) and a subdivided population (50
demes (6SE) as a function of the pollen migration rate mp.
demes with 10 individuals) for a pollen migration rate mp5
The population is divided into 40 demes with 50 individuals, 0.02. Results from simulations and calculated fromWright’s
and u51026. theory are shown.
creases from 1025 to 1026. Furthermore, only when frequency distribution for an undivided population and
Nm, 0.02 (u 5 1025) and Nm , 0.002 (u 5 1026), for a subdivided population with mp50.02. The
station-respectively, is the number of alleles maintained in the ary frequency distributions obtained using Wright’s
total population larger than the value in an undivided formulae are also included in Figure 1. Again, for the
population of the same size. To illustrate the quantita-undivided population, the theory fits the simulated data
tive effect in a larger and more subdivided population, well. For the subdivided population, however, a large
Figure 3 shows results for a population of 2000 individu-discrepancy is evident. The simulated distribution has
als divided into 40 demes, and with a mutation rate of a much larger variance and is highly positively skewed.
1026. Also included is the pattern of change in the aver-The effect of various degrees of subdivision, i.e.,
age number of alleles in a single deme, and the effective changing migration rate, on the total number of alleles
number of alleles (nE) in the total population. The
pat-is shown in Figure 2 for two demes of 100 individuals
tern observed for the total number of alleles is qualita-with three different mutation rates (u 5 1024, 1025,
tively similar to Figure 2, with the minimum number of 1026). A surprising pattern is evident for u51025and
alleles maintained at a migration rate of approximately 1026in that the number of alleles maintained is smallest
mp 5 0.002. At this point, only about 20 alleles are at intermediate migration rates, which is qualitatively
maintained, compared to 25 alleles in an undivided the opposite of the expectation fromWright’s theory.
population of the same size. The average number of The migration rate where a minimum number of alleles
alleles in a single deme decreases monotonically with is maintained decreases from approximately mp50.002
decreasing migration. The effective number of alleles (Nm 5 0.1) to mp 5 0.0004 (Nm5 0.02) when u
de-is included for comparde-ison with neutral theory, where
nEmonotonously increases with decreasing mp. In Figure
3, however, nEin the total population shows a pattern
similar to that for the actual number of alleles, but with the minimum shifted to approximately mp5 0.001.
For the same parameter values as used in Figure 3, Figure 4 shows the stationary frequencies distributions of an allele in the total population for four different migration rates, and Figure 5 shows the stationary allele frequency distribution in a deme, for the same migra-tion rates. The four migramigra-tion rates correspond to the migration rate limit (mp51), the migration rate where
the decrease in the number of alleles in Figure 3 is steepest (mp50.05), a migration rate where the number
of alleles is close to its minimum (mp 5 0.001), and a
migration rate where the number of alleles exceeds that Figure2.—The number of S-alleles (6SE) maintained in
for an undivided population (mp 5 0.0001). Figure 4
a population of 2 demes with 100 individuals as a function of
confirms the results from Figure 1 that decreasing the the pollen migration rate mp. Results are shown for three
Figure6.—The relation between the frequency of an allele and the number of demes where it is present for four different Figure 4.—The simulated stationary frequency spectra of
pollen migration rates mp. The population is divided into 40
an allele in the total population for four different pollen
demes with 50 individuals, and u51026. migration rates mp. The population is divided into 40 demes
with 50 individuals, and u51026.
tion rates above the threshold migration rate yielding the minimum number of alleles (mp50.002), there is
the stationary frequency distribution. For the smallest
a bias such that the expected number of occupied demes migration rate there are therefore alleles of higher
increases faster when the allele is rare than when it is frequency than with the highest migration rate, even
common. though the mean frequency of alleles is substantially
Symmetrical overdominance and neutrality:Figure 7 smaller. The stationary frequency distribution in the
shows the relation of the different statistics for the same local population also displays some striking patterns.
parameters as Figure 3, but for the symmetrical over-For high (mp 5 1) and low (mp 5 0.001 and 0.0001)
dominance model with the selection against homozy-migration rates, the distribution appears bell-shaped,
gotes s50.2 (Ns510). The qualitative pattern in this as expected under symmetric balancing selection, but
model is very similar to the GSI model, but the number there is a smaller mean at the high migration rate
be-of alleles maintained is generally lower because selec-cause more alleles are maintained in each deme.
How-tion is weaker. The threshold migraHow-tion rate that yields ever, at an intermediate migration rate (mp 5 0.05),
the minimum number of alleles is of the same magni-the shape of magni-the distribution is very different, with a
tude as in the GSI model. The relative decline in number large proportion of alleles at low frequency. This
funda-of alleles maintained at the minimum (approximately mentally violatesWright’s assumption 2, that an allele
mp5 0.002), compared to the undivided population should have the same frequency in all demes where it case (indistinguishable from m
p 51), is about 20–25%
is present.
in both models (6 vs. 8 in the overdominance model, Wright’s assumption 1, that the number of copies
20 vs. 25 in GSI). of an allele is linearly proportional to the number of
demes in which it is present, is illustrated in Figure 6 for the same migration rates. It appears that, for
migra-Figure 7.—Symmetrical overdominance model, s 5 0.2. The number of alleles nain the total population (6SE), the
effective number of alleles in the total population nE, and the
Figure 5.—The simulated stationary frequency spectra of
an allele in a deme for four different pollen migration rates average number of alleles in the demes (6SE) as a function of the pollen migration rate mp. The population is divided
mp. The population is divided into 40 demes with 50
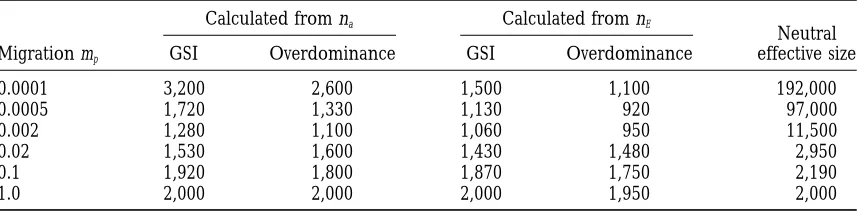
TABLE 2
The effective population size of a subdivided population
Calculated from na Calculated from nE
Neutral Migration mp GSI Overdominance GSI Overdominance effective size
0.0001 3,200 2,600 1,500 1,100 192,000
0.0005 1,720 1,330 1,130 920 97,000
0.002 1,280 1,100 1,060 950 11,500
0.02 1,530 1,600 1,430 1,480 2,950
0.1 1,920 1,800 1,870 1,750 2,190
1.0 2,000 2,000 2,000 1,950 2,000
The population sizes of an undivided population that would maintain the same number of alleles (na) and
effective number of alleles (nE) as a subdivided population with 40 demes of 50 individuals each for various
pollen migration rates mp52m, where m is the migration rate for both sexes. Estimated population sizes are
shown for both the effective and actual number of alleles for the GSI and symmetrical overdominance (s 5 0.2) case, respectively, letting u51026. The effective size of the subdivided population with respect to neutral variation is calculated using formula 6 ofNeiandTakahata(1993).
The relation between nEand m for the same u for a tive size for a neutral locus, which increases dramatically
with decreasing mp.
neutral locus calculated fromMaruyama’s (1970) exact formula is almost completely horizontal when Nm.1, but increases quickly with decreasing m when Nm, 1
DISCUSSION (results not shown).
Effective population size:The population size of an
The simulation study shows that the theory provided undivided population that would maintain the same
by Wright (1939) for a GSI-system in a subdivided number (actual or effective) of alleles as a subdivided
population is insufficient.Wright’s work supported the population is shown as a function of the migration rate
intuitively reasonable prediction that the number of in Table 2, for 40 demes with 50 individuals and u5 S-alleles maintained under the finite island model al-1026. Estimated population sizes are included for both
ways increases with decreasing migration rate between the GSI and the symmetrical overdominance model with demes. Although this is correct for the effective number
s50.2. The population sizes are estimated by compar- of neutral alleles (Maruyama1970;Nagylaki 1985), ing the actual and effective number of alleles main- the simulation results show that there exists an interme-tained at various migration rates, as shown in Figures 3 diate migration rate at which the number of S-alleles and 7 with corresponding Figures (not shown) of the reaches a minimum, and that only below this migration relation between population size and the number of rate is the conjecture correct. The migration rate at alleles (and effective alleles) for an undivided popula- which this minimum number of S -alleles occurs de-tion with u51026. For instance, with GSI an undivided
creases with the mutation rate (Figure 2), which means population of approximately 1280 individuals maintains thatWright’s conjecture is more inaccurate for small about 20 alleles which is the same number as the subdi- and biologically realistic mutation rates than for the vided population with mp 5 0.002. These population four cases he analyzed (Wright1939).
sizes can thus be viewed as the effective population size The effect of two different migration models chosen of the subdivided population with respect to the SI- to represent extreme scenarios is shown in Table 1. system (or to a locus with symmetrical overdominance). The “pollen packet” migration model assumes that m
p
The last column of Table 2 shows the effective pop- is equal to the proportion of pollen migrants that are ulation size of a subdivided population, assuming the successful in fertilization, whereas the “single pollen” mi-neutral model of genetic variation as calculated using gration model assumes that mpis equal to the proportion
Nei andTakahata’s (1993) formula 6. Table 2 shows of migrant pollen in the total pollen pool. Although that the effective population sizes estimated from nafor the latter model seems more biologically plausible
un-GSI and symmetrical overdominance are lower (20– der most circumstances, the former was assumed by 40%) than the actual number of individuals, at interme- Wrightsince it is easier to model. Table 1 shows that diate migration rates. For effective sizes estimated from when u, mp and deme size are small, the number of nEthe decrease at intermediate migration rates is even alleles maintained in the total population for a given more pronounced and the effective size is below the mpis lower under the “single pollen” migration model number of individuals even at mp50.0001. When Nm, than under the “pollen packet” migration model. This
effec-within the deme is small when mpis small, and migrating their population frequency under Wright’s
assump-tion 1. pollen have a larger probability of compatibility than
It appears that Wright’s theory fails for different nonmigrating pollen because demes are differentiated,
reasons in different ranges of the migration spectrum. leading to an increase in the “effective” migration rate
Unfortunately, it has not been possible to combine these under “single pollen” migration. Therefore, “single
pol-observations into an explanation of why the number of len” migration decreases the threshold migration rate
alleles maintained in GSI (and symmetrical overdomi-below which subdivision has the effect of increasing
nance) has a minimum at intermediate migration rates, the number of alleles above the value in an undivided
in contrast to neutrality. One important difference be-population.
tween balancing selection and neutrality is that with The results using a symmetrical overdominant model
balancing selection the probability of invasion of a new show that the pattern of an intermediate migration rate
mutant allele in a specific deme is dependent on the that maintains a minimum of alleles is not an effect
number of alleles already present in the deme, i.e., the of the specific kind of frequency-dependent selection
higher the number of alleles, the smaller the probability under GSI, but rather an effect of balancing selection.
of invasion against genetic drift because selection for a This broadens the perspectives of the study to other
rare allele is weaker. At the high migration limit, the systems than GSI, e.g., sporophytic SI andMHC.
Taka-population behaves (almost) as an undivided one and hata(1993) used simulations similar to the ones
de-the probability of invasion is determined by de-the number scribed here, but he gives results only for Nm#1, and
of alleles in the total population. At the low migration did not observe an intermediate minimum number of
limit (mp 5 0.0001), the fate of a new allele is almost
alleles with intermediate migration rates. However, his
completely determined by the probability of invasion finding that a substantial increase in the number of
into a deme, and although the demes contain few alleles, alleles happens only when Nm,,0.1 is in accordance
the total number of alleles is large because demes are with the present study.
highly differentiated. At intermediate migration rates, To help understand why Wright’s theory fails, the
the probability of invasion of a new mutant allele is still stationary frequency distributions of an allele in a deme
primarily determined by its probability of invading the and in the total population were investigated (Figures
deme, but because mp..u, migration maintains many
1, 4 and 5). WhileWright’s theory accurately predicts
more alleles in the deme than at the low migration limit, the stationary distribution in an undivided population
and the probability of invasion in the deme is reduced, (Figure 1), it underestimates the variance of the
station-while at the same time migration is high enough that ary distribution for a subdivided population, and the
demes are not sufficiently differentiated to contain discrepancy increases with decreasing migration. The
many unique alleles. stationary distribution within demes shows the striking
The pattern for the effective number of alleles main-pattern that at an intermediate migration rate (mp 5 tained was included mainly for comparison with neutral
0.05), it has a significant skew with a distribution
dotheory. The qualitative pattern as a function of the mi-nated by low frequency alleles, whereas at the highest gration rate is similar to the pattern for the actual num-and lowest migration rates it is bell-shaped (Figure 5). ber of alleles. The quantitative differences arise because Combining these observations, the conclusion is that at the variance in the stationary distribution of an allele in low migration rates (Figure 5, mp50.0001 and 0.001), the total population increases with decreasing migration
the variation in allele frequencies within demes is small, rate, and this has the effect of decreasing n
Emore than
but the variation in the number of demes where the na. Therefore, the difference between these two mea-allele occurs is very large, violating Wright’s
assump-sures is largest for symmetrical overdominance, where tion 3. At intermediate migration rates (Figure 5, mp5 selection is weaker than for GSI, resulting in a larger
0.05), on the other hand, the variance in the frequency variance in the stationary distribution (Ewens1964). of an allele in the total population is dominated by the In Papaver rhoeas, the only species in which S-allele variance within demes. This violatesWright’s
assump-frequencies have been estimated from multiple natural tion 2, which substitutes an allele’s frequency in a deme populations, the variance in S-allele frequencies in local by its mean value, which is clearly not appropriate when populations is indeed significantly larger than expected the true distribution is highly asymmetrical with a large from Wright’s theory for an undivided population variance. At the high migration limit (mp51.0), Figure (Lawrence and O’Donnell 1981). Furthermore, a 6 shows thatWright’s assumption 1 that an allele occu- large overlap in allele specificities is present among four pies a number of demes proportional to its frequency populations (Lawrence et al. 1993; Lane and Law-is violated. ThLaw-is Law-is easily understood because when the rence1993). These results are consistent with the re-migration rate is high a new allele is likely to spread sults of this study for a subdivided population with an to other demes before it has attained its equilibrium intermediate migration rate (mp 50.05). In this case,
Ayala, F. J.,1995 The myth of Eve: molecular biology and human
numbers of alleles per deme, and in the total
popula-origins. Science 270: 1930–1936.
tion, are 15 and 24, respectively; i.e., a significant overlap Ayala, F. J.,andA. A. Escalante,1996 The evolution of human populations: a molecular perspective. Mol. Phylogenet. Evol. 5:
in allele specificities among the demes is expected.
188–201.
Brooks et al. (1996) report only a small increase in
Brooks, R. J., A. M. TobiasandM. J. Lawrence,1996 The
popula-the variance in popula-the stationary frequency distribution tion genetics of the self-incompatibility polymorphism in Papaver rhoeas. XI. The effects of limited pollen and seed dispersal, over-of alleles in a model with restricted pollen and seed
lapping generations and variation in plant size on the variance
dispersal, but they only considered restricted dispersal
of S -allele frequencies in populations at equilibrium. Heredity
within a local population and not migration between 76:367–376.
Clark, A. G.,1993 Evolutionary inferences from molecular
charac-populations.
terisation of self-incompatibility alleles, pp. 79–108 in Mechanisms
The numbers of alleles and their sequence divergence
of Molecular Evolution, edited byN. TakahataandA. G. Clark.
in species with GSI and for MHC-loci have been used Sinauer Associates, Inc., Sunderland, MA.
Crosby, J. L.,1966 Self-incompatibility alleles in the population of
to put broad bounds on the current (short-term) and
Oenothera organensis. Evolution 20: 567–579. long-term effective population sizes and the likelihood
Emerson, S.,1939 A preliminary survey of the Oenothera organensis
of population bottlenecks during speciation (Richman
population. Genetics 24: 524–537.
Ewens, W. J.,1964 The maintenance of alleles by mutation. Genetics et al. 1996b and Richman andKohn 1996 for GSI in
50:891–898.
Solanaceae; Takahata 1993 for MHC in humans).
Ewens, W. J.,andP. M. Ewens,1966 The maintenance of alleles
While this article does not address the estimation of the by mutation - Monte-Carlo results for normal and self-sterility
populations. Heredity 21: 371–378.
long-term effective population size, the results of Table
Finney, D. J.,1952 The equilibrium of a self-incompatible
polymor-2 show that short-term effective sizes calculated from
phic species. Genetica 26: 33–64.
the total number of S -alleles in the population may be Fisher, R. A.,1958 The Genetical Theory of Natural Selection. Dover Publications Inc., New York.
much smaller than the effective size for a neutral locus
Foote, H. C. C., J. P. Ride, V. E. Franklin-Tong, E. A. Walker, M. J.
if the species in question has a subdivided population
Lawrenceet al., 1994 Cloning and expression of a distinctive
structure, as indeed, seems to be the case in the above- class of self-incompatibility (S) gene from Papaver rhoeas L. Proc.
Natl. Acad. Sci. USA 91: 2265–2269.
mentioned studies. Therefore, calculations of the
short-Ioerger, T. R., A. G. ClarkandT.-H. Kao,1990 Polymorphism at
term effective size from the number of S -alleles do not
the self-incompatibility locus in Solanaceae predates speciation.
yield a precise estimate if the population is subdivided, Proc. Natl. Acad. Sci. USA 87: 9732–9735.
Kimura, M.,andJ. F. Crow,1964 The number of alleles that can
in particular because the bias depends, qualitatively, on
be maintained in a finite population. Genetics 49: 725–738.
the migration rate. It should be stressed that natural
Klein, J., J. GutknectandN. Fischer,1990 The major
histocom-populations are rarely expected to conform to the sim- patibility complex and human evolution. Trends Genet. 6: 7–11.
Lane, M. D.,andM. J. Lawrence,1993 The population genetics
ple island model analyzed in this study, and that the
of the self-incompatibility polymorphism in Papaver rhoeas. VII.
conclusions cannot be directly extended to include the The number of S-alleles in the species. Heredity 71: 596–602. effect of geographic subdivision, e.g., a stepping-stone Lawrence, M. J.,andS. O’Donnell,1981 The population genetics
of the self-incompatibility polymorphism in Papaver rhoeas. III.
model, on the number of S -alleles maintained. Still, the
The number and frequency of S-alleles in two further natural
results show that the number of S -alleles (or MHC- populations (R102 and R104). Heredity 47: 53–61.
alleles) maintained seems to be a good estimator of the Lawrence, M. J., M. D. Lane, S. O’DonnellandV. E. Franklin-Tong,1993 The population genetics of the self-incompatibility
number of individuals in the total population over a
polymorphism in Papaver rhoeas. V. Cross-classification of the
large range of migration rates (Nm . 0.005). For a S-alleles of samples from three natural populations. Heredity 71: subdivided population, the number of S-alleles (or 581–590.
Maruyama, M.,1970 Effective number of alleles in subdivided
popu-MHC-alleles) may therefore provide a different and
sup-lations. Theor. Popul. Biol. 1: 273–306.
plementary kind of information than can be obtained Maruyama, T., andM. Nei, 1981 Genetic variability maintained from the analysis of neutral variation. by mutation and overdominant selection in finite populations.
Genetics 98: 441–459. This study was initially developed through discussions withM.
Tur-Mayo, O.,1966 On the problem of self-incompatibility alleles. Bio-elli.I thankF. B. ChristiansenandX. Vekemansfor numerous
metrics 22: 111–120.
discussions and comments to previous versions of the manuscript, Moran, P. A. P.,1962 The Statistical Processes of Evolutionary Theory. andD. Charlesworth, C. Damgaardand two anonymous reviewers Clarendon Press, Oxford.
Nagylaki, T.,1985 Homozygosity, effective number of alleles, and for many valuable comments to the manuscript.X. Vekemanskindly
interdeme differentiation in subdivided populations. Proc. Natl. provided a simulation program to test the results of my simulation
Acad. Sci. USA 82: 8611–8613. program. The Department of Computer Sciences, University of
Aar-Nei, M.,andN. Takahata,1993 Effective population size, genetic hus provided computing facilities. This study was supported by grants
diversity, and coalescence time in subdivided populations. J. Mol. nos. 9400065 and 9401631 from the Danish Natural Science Research Evol. 37: 240–244.
Council. Richman, A. D., T.-H. Kao, S. W. SchaefferandM. K. Uyenoyama,
1995 S-allele sequence diversity in natural populations of
Sola-num carolinense (Horsenettle). Heredity 75: 405–415.
Richman, A. D.,andJ. R. Kohn,1996 Learning from rejection: the evolutionary biology of single-locus incompatibility. TREE 11:
LITERATURE CITED
497–502.
Anderson, M. A., E. C. Cornish, S.-L. Mau, E. G. Williams, R. Richman, A. D., M. K. UyenoyamaandJ. R. Kohn,1996a S-allele
Hoggartet al., 1986 Cloning of cDNA for a stylar glycoprotein diversity in a natural population of Physalis crassifolia (Solanaceae) associated with expression of self-incompatibility in Nicotiana (ground cherry) assessed by RT-PCR. Heredity 76: 497–505.
Richman, A. D., M. K. UyenoyamaandJ. R. Kohn,1996b Allelic
diversity and gene genealogy at the self-incompatibility locus in Walker, E. A., J. P. Ride, S. Kurup, V. E. Franklin-Tong, M. J. Lawrenceet al., 1996 Molecular analysis of two functional ho-the Solanaceae. Science 273: 1212–1216.
Satta, Y., C. O’Huigin, N. TakahataandJ. Klein,1994 Intensity mologues of the S3 allele of the Papaver rhoeas self-incompatibility gene isolated from different populations. Plant Mol. Biol. 30: of natural selection at the major histocompatibility loci. Proc.
Natl. Acad. Sci. USA 91: 7184–7188. 983–994.
Wright, S.,1939 The distribution of self-sterility alleles in popula-Takahata, N.,1990 Allelic genealogy and MHC polymorphism, pp.
267–286 in Population Biology of Genes and Molecules, edited byN. tions. Genetics 24: 538–552.
Wright, S.,1960 On the number of self-incompatibility alleles main-TakahataandJ. F. Crow.Baifukan Co. Ltd., Tokyo.
Takahata, N.,1993 Evolutionary genetics of human paleo-popula- tained in equilibrium by a given mutation rate in a population tions, pp. 1–22 in Mechanisms of Molecular Evolution, edited byN. of given size: A reexamination. Biometrics 16: 61–85.
TakahataandA. G. Clark.Sinauer Associates, Inc., Sunderland, Wright, S.,1964 The distribution of self-incompatibility alleles in
MA. populations. Evolution 18: 609–619.
Takahata, N.,andM. Nei,1990 Allelic genealogy under overdomi- Yokoyama, S.,andL. E. Hetherington,1982 The expected num-nant and frequency-dependent selection and polymorphism of ber of self-incompatibility alleles in finite plant populations. He-major histocompatibility complex loci. Genetics 124: 967–978. redity 48: 299–303.
Takahata, N., Y. SattaandJ. Klein,1992 Polymorphism and bal- Yokoyama, S.,andM. Nei,1979 Population dynamics of sex-deter-ancing selection at major histocompatibility complex loci. Genet- mining alleles in honey bees and self-incompatibility alleles in
ics 130: 925–938. plants. Genetics 91: 609–626.
Vekemans, X.,andM. Slatkin,1994 Gene and allelic genealogies