Copyright1998 by the Genetics Society of America
Multiple Marker Mapping of Quantitative Trait Loci in a Cross Between
Outbred Wild Boar and Large White Pigs
Sara A. Knott,* Lena Marklund,
†Chris S. Haley,
‡Kjell Andersson,
†William Davies,
§Hans Ellegren,
†Merete Fredholm,** Ingemar Hansson,
††Bjorn Hoyheim,
§Kerstin Lundstro
¨ m,
††Maria Moller
†and Leif Andersson
†*Institute of Cell, Animal and Population Biology, University of Edinburgh, Edinburgh EH9 3JT, United Kingdom,†Department of Animal Breeding and Genetics and††Department of Food Science, Swedish University of Agricultural Sciences, Uppsala 750 07, Sweden,‡Roslin Institute (Edinburgh), Midlothian EM9 2ER, United Kingdom,§Department of Biochemistry, Physiology and Nutrition, Norwegian College
of Veterinary Medicine, Oslo 0033, Norway and **Department of Animal Production and Animal Health, Division of Animal Genetics, The Royal Veterinary and Agricultural University, 5 DK-1870 Frederiksberg, Denmark
Manuscript received May 5, 1997 Accepted for publication February 20, 1998
ABSTRACT
A quantitative trait locus (QTL) analysis of growth and fatness data from a three generation pig experiment is presented. The population of 199 F2animals was derived from a cross between wild boar and Large White pigs. Animals were typed for 240 markers spanning 23 Morgans of 18 autosomes and the X chromosome. A series of analyses are presented within a least squares framework. First, these identify chromosomes containing loci controlling trait variation and subsequently attempt to map QTLs to locations within chromosomes. This population gives evidence for a large QTL affecting back fat and another for abdominal fat segregating on chromosome 4. The best locations for these QTLs are within 4 cM of each other and, hence, this is likely to be a single QTL affecting both traits. The allele inherited from the wild boar causes an increase in fat deposition. A QTL for intestinal length was also located in the same region on chromosome 4 and could be the same QTL with pleiotropic effects. Significant effects, owing to multiple QTLs, for intestinal length were identified on chromosomes 3 and 5. A single QTL affecting growth rate to 30 kg was located on chromosome 13 such that the Large White allele increased early growth rate, another QTL on chromosome 10 affected growth rate from 30 to 70 kg and another on chromosome 4 affected growth rate to 70 kg.
T
HE use of molecular genetic markers to dissect lundet al. 1996), and a more complete analysis will bepresented here. quantitative trait variation is well known. Initially,
most of the analytical methods were developed for use In the first stage of the analysis, the approach de-scribed by Haleyet al. (1994) using multiple markers
with populations derived from inbred lines. Outbred
populations, such as those found in livestock, pose addi- is used to obtain the probabilities of the alternative genotypes for each offspring at fixed locations through tional problems, which, although theoretically possible
to overcome, mean that large numbers of animals are the genome. These probabilities are used to investigate the information content of the markers when used to-required to characterize quantitative trait loci (QTLs).
To make such analyses tractable, structured populations gether and to check for regions where there is evidence of segregation distortion. Subsequently, the probabili-have been used, such as the large half-sub families found
ties are used in a least squares framework to investigate in dairy cattle (Georgeset al. 1995). Alternatively,
ex-the genetic model underlying ex-the trait of interest. perimental populations can be created for some species,
VisscherandHaley(1996) propose a hierarchy of
and a common example is the three generation
pedi-tests that test for the presence of genetic variation associ-gree, derived from a cross between breeds or lines that
ated with a chromosome. If present, they test whether differ for one or more traits of interest.
this variation can be explained by a small region of the An experiment was initiated in order to determine
chromosome (possibly one or two QTLs) or whether it genes differing between the wild boar and the
domesti-is compatible with a polygenic model, where the QTLs cated Large White pig. A preliminary analysis of these
are dispersed along the chromosome, so that all regions data has been reported (Anderssonet al. 1994).
Subse-contribute the same genetic variance. Analyses to deter-quently, the marker map has been extended (
Mark-mine the contributions from different chromosomes, whether polygenic, oligogenic or monogenic, are pre-sented.
Corresponding author: S. A. Knott, Institute of Cell, Animal and
Popu-Subsequently, more traditional genome scans looking
lation Biology, University of Edinburgh, West Mains Rd., Edinburgh
EH9 3JT, UK. E-mail: [email protected] for single or more QTLs are carried out. If two QTLs
genome, the probability of an F2offspring being each of four
are located on the same chromosome, then fitting one
possible QTL genotypes (accounting for origin) is calculated
at the best location while searching for a second may
conditionally on the marker genotypes. In the second stage,
give biased results (Haleyand Knott 1992); hence,
these probabilities are used in a least squares framework to
two QTL models are fitted. For single QTL detected, investigate the genetic model underlying the trait of interest.
Genotyping offspring:Within one family, at any location
confidence intervals are obtained by bootstrapping
in the genome, up to four alleles could be segregating in the
(Visscheret al. 1996).
offspring generation, one coming from each of the
grand-The inclusion of cofactors has been suggested for the
parents. Using multiple marker information as described in
analysis of crosses between inbred lines (Jansen1993;
Haley et al. (1994) for a given location in the genome, we
Zeng1993). Both propose to fit markers in addition to can calculate the probability of the two alleles in an offspring coming from any of the four possible pairs of grandparents.
those flanking the region of interest. This can remove
If the alleles are located at a fully informative marker, the
biases due to QTLs linked to the region and take
ac-probabilities would depend on information from this marker
count of unlinked genetic variation, and hence
poten-only. Otherwise the probabilities are functions of the
recombi-tially reduce the residual variance and increase power. nation rates between the location under consideration and the Following the same principles, cofactors are included flanking informative markers. Assuming Haldane’s mapping
function for any given position in a linkage group, only two
in all analyses in order to account for QTLs on other
informative markers (one on either side of the position) are
chromosomes. Multiple QTL models are fitted for QTLs
needed for each of the sire and the dam sides of the pedigree.
on the same chromosome.
Thus, up to four markers are needed for each individual progeny, although the four markers used will vary from prog-eny to progprog-eny.
MATERIALS At a QTL we assume that the grandparental breeds are fixed
for alternative alleles. Hence, only two alleles are segregating Mapping population:Two European wild boars were crossed
and these are the same across all families. FollowingFalconer
with eight Large White sows. From their offspring four F1
andMackay(1996) and denoting the effect of QQ as a, the
boars were mated to 22 F1sows, producing 199 recorded F2
effect of Qq as d and the effect of qq as2a, the expected value offspring in 26 families. There were up to two parities per
of an offspring can be written as a linear model in terms of family. Within each parity were two feeding treatments.
the additive and the dominance contributions at a QTL, Map construction: Linkage maps were constructed using
Cri-map (Greenet al. 1990). Full maps are reported in
Mark-yi5 m 1caia1cdid, (1)
lundet al. (1996), including a averaged map and
sex-specific maps. The final map comprised 18 autosomes and where m is the mean, cai is the coefficient for the additive
the sex chromosome. The sex-averaged map spanned 2300 component for individual i at the given location that, denot-cM and contained 240 markers. ing the probability of an individual being genotype XX as Traits: Pigs were weighed at birth, at two weekly intervals prob(XX), is equal to prob(QQ) 2prob(qq), and cdi is the
during the growth period and at slaughter. Growth rates were coefficient for the dominance component for individual i at calculated using the recorded weights closest to 30 kg and 70 the given location, which is equal to prob(Qq).
kg. Fat measurements and the length of the small intestine Sex-different recombination rates: As suggested byHaleyet al.
were taken at slaughter. The traits considered in this analysis, (1994) it is relatively simple to accommodate differences in along with the number of F2individuals with records for each the male and female recombination rates. Using the sex-spe-trait, are given in Table 1 [seeAndersson et al. (1994) for cific maps and looking at each interval in turn, for every
further details]. centimorgan along the average distance between the two
markers, the corresponding distance for the male and for the female map can be obtained. Subsequently, when calculating the probability of being a given genotype, given adjacent mark-STATISTICAL METHODS
ers, the sex-specific distances are used and converted into recombination rates. The relevant probability can then be An approach for the analysis of a three generation pedigree
derived from a cross between outbred lines has been devel- used depending on whether the allele is passed through the male or female parent. This model enables us to use the oped byHaleyet al. (1994). The analysis can be considered
in two stages. In the first stage, at locations throughout the correct model for the Y chromosome, with no recombination
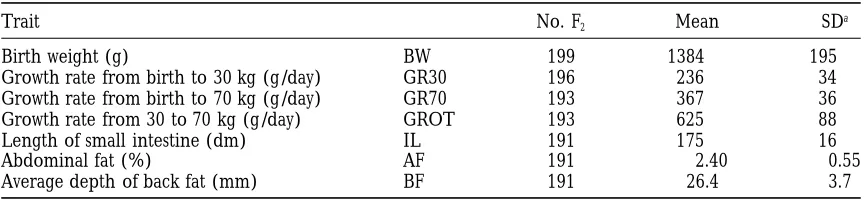
TABLE 1
Traits analyzed with their mean, standard deviation and the number of individuals with records
Trait No. F2 Mean SDa
Birth weight (g) BW 199 1384 195
Growth rate from birth to 30 kg (g/day) GR30 196 236 34
Growth rate from birth to 70 kg (g/day) GR70 193 367 36
Growth rate from 30 to 70 kg (g/day) GROT 193 625 88
Length of small intestine (dm) IL 191 175 16
Abdominal fat (%) AF 191 2.40 0.55
Average depth of back fat (mm) BF 191 26.4 3.7
except in the pseudoautosomal region, while allowing recom- spring and three-quarters of the offspring are homozygous, with equal numbers in each class.
bination between the X chromosomes in females.
Additionally, the coefficients of a and d can be used to give For the autosomes and pseudoautosomal section of the sex
an indication of any segregation distortion in the F2. Two chromosome, the same model as in Equation 1 can be fitted.
measures of distortion were considered. The first (DIS ) con-For the sex chromosome, because all male grandparents were
siders whether there is an excess of alleles from either of the wild boar and all female grandparents were Large White pigs,
original lines and the second (HET) looks for an excess or in each sex only two genotypes will be present. For females,
lack of heterozygotes. one X chromosome must have originated in a Large White
With equal contribution from the two lines, the mean addi-pig, and locations on the other chromosome could be from
tive coefficient over progeny (DIS ) should be zero: either breed. For males, locations on the X chromosome could
come from either breed. For each sex, therefore, only one
effect can be fitted: the difference between the two possible DIS5
o
N i51cai
N genotypes. Because these effects are not necessarily the same
for the two sexes, however, a separate effect is fitted for each With an excess of one line DIS tends to 1, and with excess of
sex. the other line DIS tends to21.
Information content and segregation distortion:The four Under the two allele model being assumed for putative genotype probabilities calculated can be used to give an indica- QTLs, the coefficient of d is expected, on average, to be 0.5, tion as to how informative the multiple markers are at any
location. If the coefficient for an individual is 1 or 21 for a, HET5
o
Ni512(cdi20.5) N or 1 for d, the genotype of the individual at that location isknow, that is, there is complete information for that individual.
so that with no distortion HET50, with an excess of heterozy-Alternatively, as the coefficient of a tends to 0.0 and that of
gotes HET tends to 1 and with a lack of heterozygotes HET d tends to 0.5, there is no information available. The variance
tends to21. of these coefficients across the F2progeny gives a measure of
Tests for segregation distortion were carried out every centi-information for a and d. When there is no centi-information from
morgan throughout the genome. Four regions were signifi-markers, the variances are zero, and when the genotype of all
cant at the 0.05 pointwise level for DIS and 11 for HET. From individuals is known at the location being considered, the
subsequent analyses a single scan through the genome was variance is expected to be 0.5 for the additive component and
equivalent toz250 independent tests, in which case the num-0.25 for the dominance component. Figure 1 illustrates the
ber of observed significant regions was no more than expected benefits of including multiple marker information over using
by chance. Adjusting the significance threshold to give a 0.05 markers singly for chromosome 4, using a combined measure
genome-wide level gave no significant regions. Hence, in these of variance from the two components (variance of a plus twice
data there was no evidence for segregation distortion. the variance of d). It is possible for this measure to be greater Basic least-squares model fitted:As the subsequent analyses than one because in the situation where there are more homo- are carried out within a least-squares framework, it is simple zygous individuals than expected, the contribution from the to incorporate fixed effects and covariates into the models. additive component can be .0.5. The maximum is 1.125, Equation (1) can be extended to include fixed effects and obtained when the locus is fully informative, typed in all off- covariates. For all traits the model fitted included the fixed effect of sex and parity and the random effect of family. In addition, the effect of a feed treatment was included for all traits except BW and GR30. The following covariates were also included in the basic model fitted: the litter size the individual is born into for BW, the exact weight,z30 kg, used to obtain the growth rates for GR30 and GROT, the exact weight,z70 kg, for GROT and GR70 and weight at slaughter for IL, AF, and BF.
For all analyses the coefficients for the sex-different maps have been used. The pseudoautosomal region of the sex chro-mosome has been analyzed as an autosome, whereas the alter-native, sex-specific model has been fitted for the rest of the sex chromosome. Hence, the genetic map has been treated as if there were 20 chromosomes, with chromosome 19 being the pseudoautosome and chromosome 20 being the sex chro-mosome.
Exploratory analyses
Genome substitution effects:The first analyses were carried out to look at the net effect of all chromosomes inherited from each breed and to consider evidence for heterosis. The mean coefficient of a and of d for each individual over all locations in the genome, excluding the sex chromosomes (i.e., calculated from the coefficients obtained at each location, every centimorgan in this case), were obtained and the
pheno-Figure1.—Information content for pig chromosome 4
us-ing markers sus-ingly (shown by a cross) and usus-ing all marker type for each offspring regressed onto them. If all QTLs were linked in association in the grandparents, this would give the information simultaneously (the solid line). The marker map
the coefficients calculated using all markers at the location regating on this chromosome, the single region and polygenic models were compared with it to see if they provide of a true marker) as cofactors. For each trait, first marker
locations were selected from each chromosome indepen- an adequate description of the data. If there was one QTL or several linked together in a small region of a chromosome, dently. A marker location was eliminated if its omission did
not significantly (at the 0.05 level) worsen the fit of the model. then fitting coefficients from markers flanking this region would explain most of the genetic variance associated with Second, all retained locations (across all chromosomes) were
included in a single analysis and markers excluded by back- the chromosome, and, hence, the multiple QTL model would not be a significant improvement over the single region model. ward elimination with a 0.05 significance threshold. The
re-maining marker locations were used to account for variation Alternatively, if there were many QTLs linked in association in the grandparents, the polygenic model would provide an caused by QTLs on chromosomes not currently being analyzed,
and, hence, locations on the chromosome being searched adequate description of the data and would not be rejected in favor of the multiple QTL model.
were not included.
Comparison of alternative genetic models:The exploratory Repeating this procedure for each chromosome and for each trait gives an indication as to the important chromosomes analyses proposed by Visscherand Haley (1996) can be
extended to accommodate the three generation outbred pedi- and suggests possible underlying genetic models. gree currently under analysis. In the inbred line cross,
informa-tion from single markers can be used, as all markers are
com-QTL analyses pletely informative. In our situation, however, markers were
not completely informative, and the information available to Single QTL:Initially, the mapped genome was searched to genotype individuals at given locations can be increased by identify regions where the markers explain a large proportion using all markers in the linkage group together. At sites of of the phenotypic variance. Every cM the offspring phenotypes markers, information content tends to be higher (see Figure were regressed onto the coefficients of a and of d. A simple 1), and, hence, marker locations were selected to be evenly F ratio was calculated to compare a model with a QTL at this spaced throughout the chromosome (at between 10 and 20 location vs. a model without the QTL. Estimates were obtained cM) with high information. for the additive and dominance effect of the putative QTL at
Using models analogous to those proposed by Visscher
this location in the F2population. The best estimate for the
andHaley(1996), we carried out the following sequence of
position of the QTL was taken to be the location giving the analyses for each chromosome, in turn. highest F ratio. Cofactors were fitted on chromosomes not Multiple QTL model: Offspring phenotypes were regressed currently being searched to account for variation caused by simultaneously onto the coefficients of a and of d for all marker unlinked QTLs.
locations selected from each chromosome. This is a test for Single QTL with interaction: To investigate whether the the presence of genetic variation on the chromosome affecting effect of the putative QTL was different in male vs. female the trait under consideration. The degrees of freedom for the offspring, additive and dominance effects can be estimated genetic component of this model are twice the number of for each sex separately. Comparing this model with one with selected marker locations on the chromosome. no QTL gives a test with four degrees of freedom for the Single region: The coefficients of a and of d from the two interaction of QTL effect and sex. If significant, this was tested selected marker locations flanking an interval were fitted. This against the best model with sex-equal effects for that chromo-tests for an effect associated with the flanked interval. The some.
analysis was repeated once for each marker interval (i.e., the Imprinting: As originally presented, the expected perfor-number of selected markers minus one). The genetic compo- mance of an offspring was written in terms of the additive nent of this model has four degrees of freedom. and dominance contributions at the postulated QTL. How-Polygenic model: This model tested whether the effect of each ever, when accounting for the grandparental origin of the chromosome was explained by the proportion of each geno- alleles, there are four possible genotypes in the offspring gen-type present along the chromosome (i.e., each equal length eration, and it is possible to fit three effects. The additional of a chromosome from one breed is assumed to have the same degree of freedom allows us to test whether there is any differ-effect in the same direction). Note that if there are QTLs ence between the two classes of heterozygotes at the putative from a breed with opposite effects they may mask each other QTL. The difference in these two classes is in the origin of in this test. If all marker locations were used, this would be the two alleles; in one, the wild boar allele has been inherited equivalent to calculating the mean coefficients for a and for through the F1mother and in the other through the father, d for the chromosome and regressing onto these. For the and the reverse for the Large White alleles. For the autosomes, polygenic model to be nested within the multiple QTL model, therefore, the difference between these heterozygotes should however, only selected marker locations were used, and, indicate whether imprinting is an important effect (i.e., passag-hence, a weighted mean of the coefficients at the selected ing through the male is different from through the female). markers was required to account for the fact that markers (Note that this analysis is only possible because we are analyz-were not equally spaced [Visscher1996 and Knott et al. ing an outbred cross in which up to four alleles segregate. It
(1997) for a derivation of these weights for the three genera- would not be possible in the analysis of an intercross between tion pedigree]. The genetic component of this model has two inbred lines because the two types of heterozygotes are
indis-degrees of freedom. tinguishable.)
For all three models the relevant fixed effects, random effect A model fitting imprinting in addition to the additive and and covariates were fitted. Additionally, cofactors were fitted, dominance effects of a putative QTL was compared with a except on the chromosome being analyzed. For a given trait model with no QTL (with three degrees of freedom). If sig-these fixed and random effects, covariances and cofactors nificant, this imprinting model was compared with the best are the same for all models. The multiple QTL model was QTL model without imprinting to see whether the imprinting compared with a model with no genetic component on the effect was significant.
seg-significant, the improvement of the model, including the sec- Direct effect of the halothane locus ond QTL over that of the best single QTL, was considered.
The pedigree was typed for the calcium release channel Confidence intervals:Confidence intervals for the location
mutation (located on chromosome 6 at 81 cM), which identi-parameter were obtained by bootstrapping (Visscheret al.
fies the “halothane” genotype (Fujiiet al. 1991). One of the
1996). Five hundred resamples were used. The 0.95
confi-founder boars was heterozygous at this marker; all other grand-dence interval was taken to be the region such that, in both
parents were homozygous normal. The halothane mutation directions, 0.025 of estimated positions were more extreme.
is known to be associated with leanness. The effect of the locus in our data was estimated in an analysis fitting the halo-thane locus. Additionally, the QTL analyses described above Significance thresholds
were repeated for the fat traits fitting the genotype at the halothane locus as an additional fixed effect.
Following Lander and Kruglyak (1995) suggestive and
significant linkages will be presented. The suggestive level (where, by chance, we expect to obtain one significant result
per genome analysis) was obtained by considering that we RESULTS
were analyzing 19 (independent) chromosomes, each with a
Exploratory analyses: Genome substitution effects: Table probability P of having a significant result. Assuming the
num-ber of significant chromosomes to follow a binomial distribu- 2 gives the net additive and dominance effects for the
tion, we wish to set the required threshold, P, such that the whole genome. This provides an estimate of half the expected number of significant chromosomes, 19p, is equal
breed difference and any effects of heterosis for the
to one. Therefore, P isz0.05, indicating that we can use the
traits being considered. A negative estimate indicates
0.05 level for each chromosome to give the threshold for the
that the net effect of alleles inherited from the wild
suggestive level.
The threshold for the significant level (where, by chance, boar causes a decrease in the phenotype. Hence, the
we expect 0.05 significant results per genome analysis) was wild boar has, on average, slightly lighter piglets that obtained using the Bonferoni correction; assuming 19 chro- grow more slowly than those of the white pig, and the mosomes are being analyzed (i.e., there are 19 independent
adult pig is more fat and has a shorter intestinal length.
tests), the chromosomal test significance level would be 0.0027
For all traits except birth weight, there is a significant
to give the genome-wide 0.05 level ((1 2 0.0027)19 5 1 2
difference between breeds. The standard error
associ-0.05).
For the various tests we need to find the F ratio correspond- ated with the estimate of the effect of dominance is ing to these significance thresholds. For the exploratory analy- large, but there is an indication of nearly complete ses, where one test was initially being carried out per
chromo-dominance for back fat, growth rate on test and birth
some, the F values were obtained from a standard F
weight. Table 2 also gives the percentage of the residual
distribution. For the QTL searches, a large number of
corre-mean square after fitting the fixed and random effects
lated tests was being performed, and, hence, the standard F
distribution cannot be used to obtain the threshold F values. and covariates explained by the additive and dominance
The correct null hypothesis distribution to obtain suitable substitution effects and the joint significance of them, thresholds was therefore obtained empirically by a permuta- assuming an F distribution with two degrees of freedom tion test (ChurchillandDorerge1994). In our approach,
in the numerator.
all the genetic information is obtained within the calculated
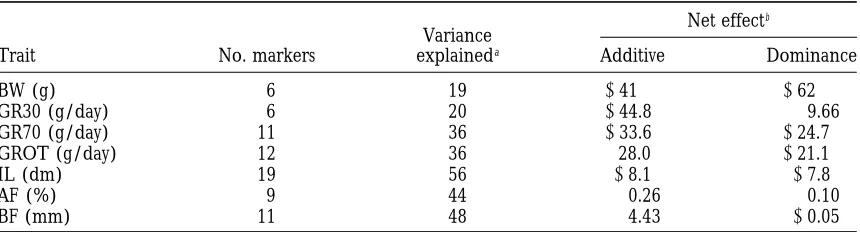
Cofactor selection: Table 3 gives the number of marker
coefficients; hence, these can be calculated once and then
permuted with respect to the phenotypes. For each permuta- locations selected for each trait after the two rounds of
tion, the entire genome is searched, and the highest F ratio backward elimination. The percentage of the residual for each chromosome noted. A genome-wide 0.05 level was mean square explained after fitting the fixed effects, obtained by picking the highest F ratio each permutation for
random effect and covariates, and the total joint effect
the whole genome. The suggestive level thresholds were from
of the cofactors is also given. The direction of effect is
the 0.05 level obtained for each chromosome separately. One
generally in agreement with the estimates obtained for
thousand permutations were studied for each trait. The
rele-vant fixed effects, random effect and covariates were fitted. the whole genome effect when fitting a polygenic model Cofactors were fitted in the same way as for the QTL analyses, (see Table 2), but for all traits the estimated cofactor that is, by omitting them from the chromosome being
additive effects were both positive and negative in
direc-searched, and were permuted with the phenotype, such that
tion (not shown). The cofactors explain a greater
pro-prior to fitting the QTL the residual variance was constant
portion of the variance than the genome substitution
across replicates.
For the alternative single QTL analyses, that is, interaction effects.
with sex or with imprinting, an approximate significance Comparison of alternative genetic models: The results from threshold can be obtained by converting the threshold F ratio
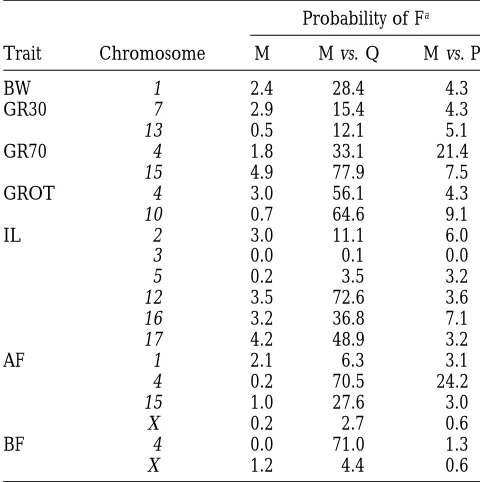
the hierarchy of exploratory tests are given in Table 4,
obtained from the null hypothesis simulations described above
which includes all sets of tests where fitting all selected
into a probability of the F ratio under a standard F distribution
marker locations simultaneously (the multiple QTL
with two degrees of freedom for the numerator. It is then
possible to obtain the F ratio that would give this probability model) is significant at the suggestive level (P ¿0.05
under a distribution with three, four or eight degrees of free- chromosome test). The results from the single region dom as required for the relevant test. explaining the highest proportion of the variance have
For one chromosome (chromosome 4) and one trait (BF),
been presented, and additional regions may also show
a permutation test was carried out in order to obtain an
indica-significant effects. For only three traits (AF, BF, and IL)
tion of the relevant significant level when two QTLs were
TABLE 2
Estimated genome substitution effects
Trait Additivea Dominancea Variance explainedb Probabilityc
BW (g) 2242 (144) 2284 (247) 1 0.11
GR30 (g/day) 287.1 (24.9) 47.3 (42.3) 6 0.002
GR70 (g/day) 2117.2 (26.2) 3.6 (44.2) 10 0.000
GROT (g/day) 2148.7 (67.5) 2145.5 (113.6) 3 0.04
IL (dm) 236.9 (13.2) 222.1 (20.5) 4 0.01
AF (%) 1.06 (0.46) 0.40 (0.71) 2 0.06
BF (mm) 8.69 (3.05) 7.22 (4.76) 5 0.006
aWith the standard error of the estimate in parentheses. bJoint significance of additive and dominance effects.
cGiven as the percentage of the residual mean square after fitting the fixed and random effects and covariates.
the genome-wide level) than a nongenetical model for and the single region model, again suggesting that sev-eral QTLs are responsible.
any chromosome (P¿0.0027 chromosome test). For
both AF and BF an effect on chromosome 4 was de- QTL analyses: Null hypothesis: The genome-wide 0.05
significance thresholds obtained using the sex different tected. For AF the multiple QTL model was not,
how-ever, a significant improvement over either the best map are given in Table 5. Thresholds do not differ much across traits. These F values are equivalent to a single region model or the polygenic model, suggesting
that the data can be explained by either one or a few probability of between 0.00018 and 0.00034 under the standard F distribution with two degrees of freedom in QTLs in a small region of the chromosome or by many
dispersed throughout the chromosome. The single re- the numerator or about 250 independent tests. The chromosomal suggestive thresholds, except for the gion model, however, explains more of the residual
variance. For BF, the polygenic model would be rejected pseudoautosomal region of X/Y, range from z4.2 to 6.0, depending on the trait and chromosome being in favor of the multiple QTL model, whereas the single
region model would not be rejected, leading to the analyzed. The pseudoautosomal region of X/Y has a suggestive threshold of z3.5 for all traits.
conclusion that a small region of the genome is
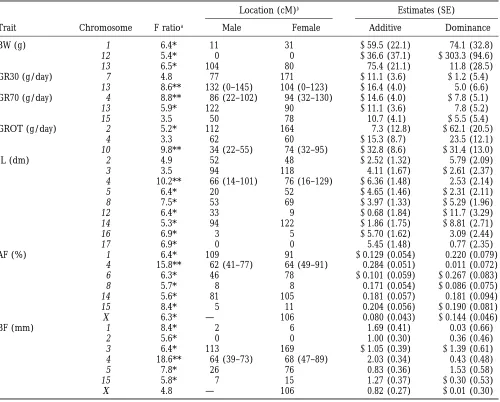
impor-tant. For IL there are significant effects when all marker Single QTL: Table 6 presents the location giving the
highest test statistic and the parameter estimates ob-locations on chromosome 3 or on chromosome 5 are
fitted together. In both cases, this model provides a tained at this location for chromosomes with a QTL significant at the suggestive level. Location estimates are significantly better explanation of the data than either
the single region or the polygenic model, suggesting relative to the sex-specific maps given by Marklund et al. (1996). In addition, all chromosomes previously
that several QTLs with both positive and negative effects
are segregating on these chromosomes. The sex chro- identified as being significant at the suggestive level when fitting the multiple QTL model (Table 4) have mosome has a significant genetic effect on AF. The
multiple QTL is significantly better than the polygenic been included. For five of the seven traits, GR30, GROT,
TABLE 3
Selected cofactors
Net effectb
Variance
Trait No. markers explaineda Additive Dominance
BW (g) 6 19 241 262
GR30 (g/day) 6 20 244.8 9.66
GR70 (g/day) 11 36 233.6 224.7
GROT (g/day) 12 36 28.0 221.1
IL (dm) 19 56 28.1 27.8
AF (%) 9 44 0.26 0.10
BF (mm) 11 48 4.43 20.05
aGiven as the percentage of the residual mean square after fitting the other fixed and random effects and
covariates.
TABLE 4 dominant. A positive additive estimate means that the wild boar alleles are causing an increase in the trait
Comparison of models
value. That is, the individuals homozygous for the wild boar alleles at the fat QTLs on chromosome 4 have, on
Probability of Fa
average, more abdominal fat (0.6%) and thicker backfat
Trait Chromosome M M vs. Q M vs. P
(4.0 mm) than those homozygous for the Large White alleles. In contrast, the wild boar QTL alleles decrease
BW 1 2.4 28.4 4.3
GR30 7 2.9 15.4 4.3 growth rate compared with the Large White pig and
13 0.5 12.1 5.1 cause shorter intestinal length.
GR70 4 1.8 33.1 21.4 Confidence intervals (0.95) for the location
parame-15 4.9 77.9 7.5
ter are given in Table 6 for those QTLs attaining
ge-GROT 4 3.0 56.1 4.3
nome-wide 0.05 significance. For the two fat traits a
10 0.7 64.6 9.1
region of about 40 cM (averaged over the the male and
IL 2 3.0 11.1 6.0
female map) is spanned by this 0.95 confidence interval,
3 0.0 0.1 0.0
5 0.2 3.5 3.2 and for growth rate on test z50 cM is covered. For
12 3.5 72.6 3.6 growth rate to 30 kg, growth rate to 70 kg and intestinal 16 3.2 36.8 7.1 length, the confidence interval included 90 cM or more
17 4.2 48.9 3.2
(on the average map), which is a large proportion of
AF 1 2.1 6.3 3.1
the total chromosome length (171 cM, 128 cM and 128
4 0.2 70.5 24.2
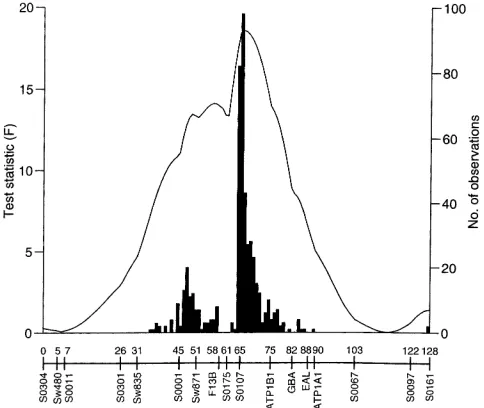
cM, respectively.) Figure 2 gives the frequency
distribu-15 1.0 27.6 3.0
tion of the bootstrap results for the best location for
X 0.2 2.7 0.6
BF 4 0.0 71.0 1.3 the QTL for BF on chromosome 4 using the average of
X 1.2 4.4 0.6 the male and female map. This distribution is a more
extreme version of the F ratio profile, with most of the
aThe probability (3100) of the F ratio obtained for various
replicates giving a maximum test statisticz66 cM, but
tests: M, the multiple QTL model against the null hypothesis
of no genetic effect; M vs. Q, multiple QTL against the null another, much smaller peak being observedz48 cM.
hypothesis of the “best” single region model; M vs. P, multiple Single QTL with interaction with sex: Converting the 0.05 QTL against the null hypothesis of the polygenic model. significance thresholds to be suitable for the test of a
single QTL interacting with sex vs. no QTL gives F values of between 5.5 and 5.9 for the genome-wide level for IL, AF and BF, one region of the genome was significant
the seven traits. One region of the genome for each of and for GR70 one region approached significance. The
three of the traits (IL, AF and BF) gave a test statistic QTLs affecting the fat traits and IL are in a similar
greater than this threshold. For AF and BF the QTLs location on chromosome 4. The QTL for GR70 is also
detected are at the same location on chromosome 4 as on chromosome 4 with the best location 20 to 30 cM
when an interaction was not fitted (see Table 6), and away from the fatness QTL. A significant QTL for GROT
fitting the interaction with sex does not provide a sig-is found on chromosome 10 and for GR30 on
chromo-nificantly better explanation of the data. The highest F some 13. Suggestive QTLs for BW and GR70 are also
ratio on chromosome 8 now reaches significance for IL located in this region on chromosome 13. Figure 2 gives
when an effect for each sex was fitted. This location the F ratio profile for BF on chromosome 4.
gave a suggestive result when the interaction with sex The significant QTLs are essentially additive in their
was omitted, and the improvement in fit obtained by action, except for the QTL on chromosome 10 affecting
fitting the interaction is significant (with an F ratio statis-GROT where the allele from the wild boar is completely
tic of 6.4 with two and 124 degrees of freedom). The model with the same effect fitted in both sexes gave
TABLE 5 a completely dominant model with the heterozygote having the same effect as the wild boar (Table 6). When
Threshold F values for QTL analyses
a separate effect is estimated in the two sexes, the QTL has an additive effect in males with increased effect
Significance threshold
(a 5 25.7 6 1.7 dm, d 5 20.7 6 2.5 dm), whereas
Trait 10% 5% 1% in females the additive effect was much smaller (a 5
22.0 6 2.0 dm) but heterozygotes were estimated to
BW 7.8 8.7 10.0
GR30 7.8 8.4 10.6 have an intestinal length shorter than the
midhomozy-GR70 7.9 8.8 11.0 gote effect (d5 212.662.9 dm).
GROT 7.9 8.7 10.8 The regions significant for IL (chromosome 4), GR30 IL 8.2 9.1 11.1 (chromosome 13) and GROT (chromosome 10), when
AF 8.0 9.0 11.6
fitting the same effect for each sex, fell below the
BF 7.9 8.6 10.8
TABLE 6
Results from fitting a single QTL
Location (cM)b Estimates (SE)
Trait Chromosome F ratioa Male Female Additive Dominance
BW (g) 1 6.4* 11 31 259.5 (22.1) 74.1 (32.8)
12 5.4* 0 0 236.6 (37.1) 2303.3 (94.6)
13 6.5* 104 80 75.4 (21.1) 11.8 (28.5)
GR30 (g/day) 7 4.8 77 171 211.1 (3.6) 21.2 (5.4)
13 8.6** 132 (0–145) 104 (0–123) 216.4 (4.0) 5.0 (6.6)
GR70 (g/day) 4 8.8** 86 (22–102) 94 (32–130) 214.6 (4.0) 27.8 (5.1)
13 5.9* 122 90 211.1 (3.6) 7.8 (5.2)
15 3.5 50 78 10.7 (4.1) 25.5 (5.4)
GROT (g/day) 2 5.2* 112 164 7.3 (12.8) 262.1 (20.5)
4 3.3 62 60 215.3 (8.7) 23.5 (12.1)
10 9.8** 34 (22–55) 74 (32–95) 232.8 (8.6) 231.4 (13.0)
IL (dm) 2 4.9 52 48 22.52 (1.32) 5.79 (2.09)
3 3.5 94 118 4.11 (1.67) 22.61 (2.37)
4 10.2** 66 (14–101) 76 (16–129) 26.36 (1.48) 2.53 (2.14)
5 6.4* 20 52 24.65 (1.46) 22.31 (2.11)
8 7.5* 53 69 23.97 (1.33) 25.29 (1.96)
12 6.4* 33 9 20.68 (1.84) 211.7 (3.29)
14 5.3* 94 122 21.86 (1.75) 28.81 (2.71)
16 6.9* 3 5 25.70 (1.62) 3.09 (2.44)
17 6.9* 0 0 5.45 (1.48) 0.77 (2.35)
AF (%) 1 6.4* 109 91 20.129 (0.054) 0.220 (0.079)
4 15.8** 62 (41–77) 64 (49–91) 0.284 (0.051) 0.011 (0.072)
6 6.3* 46 78 20.101 (0.059) 20.267 (0.083)
8 5.7* 8 8 0.171 (0.054) 20.086 (0.075)
14 5.6* 81 105 0.181 (0.057) 0.181 (0.094)
15 8.4* 5 11 0.204 (0.056) 20.190 (0.081)
X 6.3* — 106 0.080 (0.043) 20.144 (0.046)
BF (mm) 1 8.4* 2 6 1.69 (0.41) 0.03 (0.66)
2 5.6* 0 0 1.00 (0.30) 0.36 (0.46)
3 6.4* 113 169 21.05 (0.39) 21.39 (0.61)
4 18.6** 64 (39–73) 68 (47–89) 2.03 (0.34) 0.43 (0.48)
5 7.8* 26 76 0.83 (0.36) 1.53 (0.58)
15 5.8* 7 15 1.27 (0.37) 20.30 (0.53)
X 4.8 — 106 0.82 (0.27) 20.01 (0.30)
aFor test of 1 vs. 0 QTL. * indicates significance at the suggestive level and ** at the genome 0.05 level. bWith 95% confidence interval in brackets.
were still suggestive. For IL and GROT the location dominance effect of 0.01660.072% and an estimated difference in the effect of the heterozygotes of 0.1156 explaining the greatest variance was the same, whereas
for GR30 (where the test statistic has dropped more) it 0.054%, with the heterozygote with wild boar allele in-herited through the male parent having the higher per-has shifted 13 cM along the chromosome.
Testing for imprinting: The genome-wide 0.05 signifi- centage of abdominal fat.
Two QTLs: The permutation test for chromosome 4
cance thresholds converted from the single QTL level
were between 6.5 and 6.9 for the different traits. For using BF gave a threshold for the suggestive level of significance of 4.5 for the test of two vs. no QTLs. In AF, BF and IL the region of chromosome 4 previously
found to contain a QTL was significant when fitting Table 7 chromosomes are presented where both the test of two vs. no QTLs is suggestive (based on the BF an imprinting effect, in addition to the additive and
dominance model. Likewise, the region on chromo- level) and where the test of two QTLs is significantly better than one QTL using the suggestive levels ob-some 10 for GROT was still significant, whereas for GR30
the previously significant region on chromosome 13 tained for the test of one vs. no QTLs. None of the test statistics reach the genome-wide 0.05 level.
dropped below this level. Only for AF on chromosome
4 did the addition of the imprinting effect cause a sig- For GR70, two QTLs on chromosome 15 provide a better explanation of the data than one or no QTLs. nificant improvement (F54.20). The estimates for this
observed for back fat, where the heterozygous individu-als had, on average, 1.6360.74 mm less back fat than the normal homozygous individuals. For abdominal fat, heterozygous individuals had 0.1660.11% less fat. The QTL analyses were repeated fitting halothane genotype as a fixed effect. The addition of the halothane geno-type, however, had little effect on the conclusions reached from these analyses. The best location for the QTL detected on chromosome 4 for BF was moved to 49 cM with the F ratio reduced to 10.2. The additive effect of the QTL was reduced to 1.460.35 mm and the dominance effect increased to 1.060.50 mm. Smaller changes in the highest F were observed for other chro-mosomes, but these changes only caused a difference in the chromosomes classified as suggestive (adding some chromosomes and losing others). The inclusion of the halothane genotype in the analysis of AF caused only small changes in the results.
Figure2.—The F ratio profile for backfat thickness on pig
chromosome 4 when fitting a single QTL (the solid line). Additionally, the histogram of the best location estimates from
DISCUSSION the bootstrap analysis is given. The marker map is the average
of the male and female map, which is very similar to the sex
We have analyzed the data from the wild boar 3
averaged map (Marklundet al. 1996).
Large White F2 population in several ways and have
some convincing evidence for QTLs affecting fatness and growth traits. For chromosomes significant at the best single QTL. There is evidence for two QTLs on
genome-wide level, the results are fairly consistent. The chromosomes 3 and 13 for IL. On chromosome 3 both
tests point to a single QTL affecting each of the two fat QTLs are located near the best location obtained from
traits on chromosome 4, with the best locations between the single QTL analysis. An effect for IL on chromosome
markers S0175 and ATP1B1. There is evidence of
ge-13 has not been previously detected. Two chromosomes
nome imprinting at the chromosome 4 QTL affecting were also suggestive of two QTLs affecting AF; these
AF, as the effect of the heterozygous genotype is dif-were chromosome 5 and the X chromosome.
Chromo-ferent, depending on whether the allele was passed some 5 has not been picked up previously in connection
through the male or female F1 parent. The effect was
with AF, whereas in the exploratory analyses, a model
not seen for BF, and we have to bear in mind that the with several QTLs had been postulated for the X
chro-result for AF could be a false positive chro-result (Type I mosome.
error) as we were carrying out a large number of tests.
Halothane mutation: The animals heterozygous for
The results for GR30, GR70 and GROT suggesting single the halothane mutation were more lean than normal
QTLs on chromosomes 13, 4 and 10, respectively, are homozygotes, as expected from the known effect of
this mutation (Fujiiet al. 1991). The largest effect was also consistent across all tests. The results for IL are not
TABLE 7
Results from fitting two QTLs
F ratio Location (cM) Estimates (SE)
Trait Chromosome vs. 0 QTL vs. 1 QTL Male Female Additive Dominance
GR70 (g/day) 15 4.9 6.0 24 56 213.0 (5.1) 214.9 (6.5)
50 78 19.9 (5.2) 0.4 (5.9)
IL (dm) 3 5.1 6.4 97 131 29.83 (7.99) 213.1 (8.23)
99 141 227.07 (7.72) 12.6 (7.61)
13 4.8 6.6 118 86 1.34 (3.53) 217.92 (4.22)
126 94 0.03 (3.20) 15.51 (3.89)
AF (%) 5 5.0 6.9 5 27 20.230 (0.069) 20.159 (0.080)
21 55 0.145 (0.070) 0.229 (0.086)
X 5.3 4.2 — 24 20.192 (0.073) 0.108 (0.079)
so clear, however. The single QTL detected on chromo- chromosomes 1 and 8. Unfortunately, the QTL region is close to the breakpoint of conserved synteny, compli-some 4 was not picked up in the multiple QTL model,
presumably because of the large number of degrees of cating the identification of possible candidate genes. There are some candidate genes for human obesity, freedom being used in this test. Chromosomes 3 and 5
suggest a multiple QTL model, which is consistent with however, that are found in possibly homologous re-gions. These include the b-3-adrenegic receptor gene no single effects being detected on these chromosomes.
The two QTL results were not conclusive, although for (ADRB3) on human chromosome 8q (Clementet al.
1995) and ATP1B1 on human chromosome 1q (Deriaz
chromosome 3 there is good evidence for at least a
second QTL. Five different cofactor locations were on et al. 1994). ATP1B1 was in fact one of the markers
included in this QTL study, and it maps very close to chromosome 3 for IL, which also supports a multiple
QTL model. When fitting an interaction with sex, IL the QTL peak for fatness (Figure 2). None of the obesity genes so far cloned in the mouse (e.g., ob and db, encod-gave a significant test statistic on chromosome 8. This
chromosome was not picked up in the exploratory analy- ing leptin and the leptin-receptor, respectively) map to a region showing conserved synteny with the actual ses, when the same effect was fitted in both sexes, but was
suggestive when fitting a single QTL without interaction. region of pig chromosome 4. We are currently improv-ing the map position of this fatness QTL by marker-The convincing QTLs are in accordance with the
ex-pected effect due to selection. That is, the white pig will assisted backcrossing, and we plan to use a recently developed pig radiation hybrid panel to make a high-have been selected for less fat and for a faster growth
rate, causing fixation of the favorable alleles at some resolution comparative map over the QTL region. The human homologue of the QTL for early growth on pig loci.
These results are consistent with the previous study chromosome 13 is expected to be located on human chromosome 3. The actual region harbors the PIT1 of these data where a less complete marker map was
used (Andersson et al. 1994). An additional QTL has gene encoding a pituitary-specific transcription factor
known to be important for normal growth. Interestingly, been detected here for GROT on chromosome 10 ; this
may be because of the inclusion of cofactors, which an association between a PIT1 polymorphism and early growth was detected using a cross between European bring this region up to significance. The QTLs for IL
and GR70 on chromosome 4 and GR30 on chromosome and Chinese pigs (Yuet al. 1995). The region on pig
chromosome 10 harboring a QTL for growth is expected
13 are found in the same marker intervals in both
analy-ses. The best location for the QTLs for the fat traits, to be homologous to some part of human chromosome
1, but the precise region is not sufficiently well defined
however, has moved into the adjacent interval, between
S0175 and S0107 rather than between S0001 and S0175, to make the search for candidate genes meaningful. The results of the present study have several impor-as found previously. S0001 wimpor-as the limpor-ast marker on the
chromosome 4 map for the previous analyses, whereas tant implications from an animal breeding point of view. First, it is an interesting question whether the QTLs now the map has been substantially extended. The
addi-tional markers, presumably, are less compatible with identified here, which explain an important part of the genetic difference between these two divergent pig pop-the observations than furpop-ther along pop-the chromosome,
moving the QTL location into the next interval. The ulations, also control part of the genetic variation in these traits within commercial pig populations. We are QTLs affecting fat and growth rate on chromosome 4
have subsequently been confirmed in an analysis of a currently collecting material to answer this important question. Second, QTLs may be exploited in animal backcross population derived from two of the F2
individ-uals included in this analysis (L. Marklund, unpub- breeding programs by marker-assisted selection (MAS).
As regards all the QTLs reaching the genome-wide sig-lished results).
A long-term goal in QTL mapping is to identify the nificance threshold in this study, the wild pig alleles were associated with a less-favored phenotype (in modern pig causative genes at the molecular level. This is a very
difficult task but positional candidate cloning is cur- production), that is, with a more slow-growing and fat pig. But it is quite possible that some QTLs where the rently the most promising strategy to achieve this.
How-ever, because the transcript map is poorly developed in wild pig allele has a favorable effect could be identified in a more powerful QTL study (e.g., larger F2
genera-farm animals, animal geneticists need to utilize
compar-ative map information from better-studied organisms, tion), as has been reported in crosses between wild and cultivated rice (Xlao et al. 1996). Thus, it should be
particularly humans and mice, to identify possible
candi-date genes, that is, comparative positional candicandi-date possible to use marker-assisted selection to facilitate the development of a synthetic line combining favorable cloning (Womack and Kata 1995). Such candidate
genes will then be screened for genetic polymorphism QTL alleles from two divergent lines.
The substitution effects estimated for the whole ge-and mapped in relation to the QTL. As regards the
major QTL for fatness on chromosome 4, ZOO-FISH nome (Table 2) are consistent with the observed differ-ences between purebred Large White and the F2
popula-analysis (Retenberger et al. 1995) has revealed that
fact that the underlying model in the analysis, which with outbred populations. Additionally, we could test the hypothesis that IL and GR70 are also affected by assumes that all regions of the genome contribute
equally to the trait, is questionable. the same QTL. The growth rate traits all show a peak in test statistic in a similar region of chromosome 13, Some of the two-QTL models gave very high estimates
for the effects of the QTLs, but on closer inspection, although significance is not attained for all traits. A multitrait analysis would allow us to consider whether the two locations are very close together, and the
esti-mates are in opposite directions. Separating two closely a single QTL was affecting these traits and may also improve the power of the test.
linked QTLs is difficult (HaleyandKnott1992;
Whit-takeret al. 1996), and estimates at two positions close The 0.95 confidence intervals obtained by
bootstrap-ping included a large proportion of the chromosome together will be highly confounded and hence
unrelia-ble. These results should be taken as indicating evidence even for tests of the largest effects we found. An improve-ment to the method, to give improved estimation of the for complex genetic control, with two or more QTLs,
but the large estimates should be discounted. location of a QTL and possibly to increase the power, might be obtained by fitting cofactors on the chromo-The model of the analysis assumes that alleles at the
QTLs are fixed in the original lines (wild boar and Large some currently being searched. These would account for additional QTLs linked to the one currently being White). For traits of economic importance it is likely
that alleles with a large favorable effect will have been fitted. For the largest effects on fatness traits, however, there is little evidence for other QTLs on chromosome fixed in the Large White population. If this assumption
is violated and the alleles are still segregating in either 4, and hence, the addition of cofactors on the same
chromosome is not expected to improve the precision of the lines at a QTL, the power for its detection will
be greatly reduced, and its effect will be underestimated of the estimate and may make it worse. (AlfonsoandHaley1997).
We thankPeter Visscher, Bill Hill, and the referees for useful
Fitting cofactors unlinked to the chromosome cur- comments on the manuscript. Financial support is acknowledged from the Biotechnology and Biological Sciences Research Council (S.A.K.
rently being searched should reduce the residual
vari-and C.S.H.), the Royal Society (S.A.K.), the Ministry of Agriculture,
ance by accounting for other genetic effects. This should
Fisheries and Food (C.S.H.) and the Swedish Research Council for
increase the test statistics, possibly giving more
signifi-Forestry and Agriculture (L.A.).
cant chromosomes. The test statistic profile along the chromosome, however, should not change shape other
than because of chance associations between the proba- LITERATURE CITED bilities in the region being searched and those at
cofac-Alfonso, L., andC. S. Haley, 1997 Power of different F2schemes
tors. In fact, when analyzing the same data without
cofac-for QTL detection in livestock. Animal Science (in press).
tors we removed the significant effect on chromosome Andersson, L., C. S. Haley, H. Ellegren, S. A. Knott, M. Johansson
et al., 1994 Genetic mapping of quantitative trait loci for growth
10 for GROT, although the test statistic was still high,
and fatness in pigs. Science 263: 1771–1774.
at 6.9. For GR70, the effect on chromosome 4 increased
Churchill, G. A., and R. W.Doerge, 1994 Empirical threshold
to give a significant test statistic when cofactors were values for quantitative trait mapping. Genetics 138: 963–971.
Clement, K., C. Vaisse, B. S. Manning, A. Basdevant, B. Guy-Grand
omitted, suggesting that there is a correlation between
et al., 1995 Genetic variation in the beta 3-adrenergic receptor
the genotype probabilities in this region and one or
and an increased capacity to gain weight in patients with morbid
more of the cofactors. The other locations that were obesity. N. Engl. J. Med. 333: 352–354.
Deriaz, O., F. Dionne, L.Perusse, A. Tremblay, M.-C. Vohlet
significant when searching for a single QTL fitting
cofac-al., 1994 DNA variation in the genes of the Na,K-adenosine
tors remained significant when cofactors were omitted,
triphosphatase and its relation with resting metabolic rate,
respi-with some traits giving an increase and some a decrease ratory quotient, and body fat. J. Clin. Invest. 93: 838–843.
Falconer, D. S., andT. F. C. Mackay, 1996 Introduction to
Quantita-in the test statistic. Generally, there was a decrease Quantita-in
tive Genetics. Longman, UK.
the number of suggestive locations when cofactors were
Fujii,J., K. Otsu, F. Zorzato, S.de Leon, V.K. Khanna et al.,
omitted. 1991 Identification of a mutation in porcine ryanodine receptor
associated with malignant hyperthermia. Science 253: 448–451.
Analyzing the data using a genetic map that ignores
Georges, M., D. Nielsen, M. Mackinnon, A. Mishra, R. Okimoto
sex-different recombination rates also changed the
re-et al., 1995 Mapping quantitative trait loci controlling milk
pro-sults very little. Allowing for recombination differences duction in dairy cattle by exploiting progeny testing. Genetics
139:907–920.
simply scales the distance between markers differently
Green, P., K. FallsandS. Crooks, 1990 Cri-Map Version 2.4.
Wash-for the two sexes (results not shown).
ington University School of Medicine, St. Louis.
As only single trait analyses have been performed, Haley, C. S., andS. A. Knott, 1992 A simple method for mapping quantitative trait loci in line crosses using flanking markers.
He-we cannot test the hypothesis that a single QTL on
redity 69: 315–324.
chromosome 4 had a pleiotropic effect on both fat traits,
Haley, C. S., S. A. KnottandJ. M. Elsen, 1994 Mapping
quantita-although this seems likely. To test the hypothesis of one tive trait loci in crosses between outbred lines using least squares.
Genetics 136: 1195–1207.
or two QTLs a multitrait analysis would be required.
Jansen, R., 1993 Interval mapping of multiple quantitative trait loci.
Such analyses have been proposed for crosses between
Genetics 135: 205–211.
inbred lines using maximum likelihood (Jiang and
Jiang, C., and Z.-B. Zeng, 1995 Multiple trait analysis of genetic mapping for quantitative trait loci. Genetics 140: 1111–1127.
Knott, S. A., D. B. Neale, M. M. SewellandC. S. Haley, 1997 Visscher, P. M., R. ThompsonandC. S. Haley, 1996 Confidence intervals in QTL mapping by bootstrapping. Genetics 143: 1013– Multiple marker mapping of quantitative trait loci in an outbred
pedigree of loblolly pine. Theor. Appl. Genet. 94: 810–820. 1020.
Whittaker, J., R. ThompsonandP. M. Visscher, 1996 On the Lander, E., andL. Kruglyak, 1995 Genetic dissection of complex
traits: guidelines for interpreting and reporting linkage results. mapping of QTL by regression of phenotype on marker-type. Heredity 77: 23–32.
Nature Genet. 11: 241–247.
Marklund, L., M. Johansson Moller, B. Hoyheim, W. Davies, M. Womack, J. E., and S. R. Kata, 1995 Bovine genome mapping: evolutionary inference and the power of comparative genomics. Fredholmet al., 1996 A comprehensive linkage map of the pig
based on a wild pig–Large White intercross. Anim. Genet. 27: Curr. Opin. Genet. Dev. 5: 725–733.
255–269. Xiao, J., S. Grandillo, S. N. Ahn, S. R. McCouch, S. D. Tanksley
Rettenberger, G.,C. Klett, U. Zechner, J. Kunz, W.Vogel et et al., 1996 Genes from wild rice improve yield. Nature 384:
al., 1995 Visualization of the conservation of synteny between 223–224.
humans and pigs by heterologous chromosomal painting. Genet- Yu, T.-P., C. K. Tuggle, C. B. SchmitzandM. F. Rothschild, 1995
ics 26: 372–378. Association of PIT1 polymorphisms with growth and carcass traits
Visscher, P. M., 1996 Proportion of the variation in genetic compo- in pigs. J. Anim. Sci. 73: 1282–1288.
sition in back-crossing programs explained by genetic markers. J. Zeng, Z-B., 1993 Theoretical basis of separation of miltiple linked
Hered. 87: 136–138. gene effects on mapping quantitative trait loci. Proc. Nat. Acad.
Visscher, P. M., andC. S. Haley, 1996 Detection of quantitative Sci. USA 90: 10972–10976. trait loci in line crosses under infinitesimal genetic models.