Copyright1998 by the Genetics Society of America
Bayesian Inference of Genetic Parameters and Selection Response
for Litter Size Components in Pigs
A. Blasco,* D. Sorensen
†and J. P. Bidanel
‡*Departamento de Ciencia Animal, Universidad Polite´cnica de Valencia, Valencia 46071, Spain,†National Institute of Agricultural Sciences,
Research Centre Foulum, Tjele DK-8830, Denmark and‡Station de Ge´ne´tique Quantitative et Aplique´e, INRA, Jouy-en-Josas 78352, France Manuscript received March 14, 1997
Accepted for publication February 6, 1998
ABSTRACT
Three contemporary lines were formed from the progeny of 50 French Large White sows. In the first line, gilts were selected for ovulation rate at puberty. In the second line, they were selected for prenatal survival of the first two parities, corrected for ovulation rate. The control constituted the third line. Ovulation rate at puberty was analyzed using an animal model with a batch effect. Prenatal survival was analyzed with a repeatability animal model that included batch and parity effects. Flat priors were used to represent vague previous knowledge about parity and batch effects. Additive and residual effects were represented assuming that they were a priori normally distributed. Variance components were assumed to follow either uniform or inverted chi-square distributions, a priori. The use of different priors did not affect the results substantially. Heritabilities for ovulation rate ranged from 0.32 to 0.39, and from 0.11 to 0.16 for prenatal survival, depending on the prior used. The mean of the marginal posterior distribution of response to four generations of selection ranged from 0.38 to 0.40 ova per generation, and from 1.1 to 1.3% of the mean survival rate for average survival per generation.
L
ITTER size is difficult to improve by selection proposed bySorensenet al. (1994) that takes intoac-count the selection mechanism that generated the data (Haleyet al. 1988) unless high selection pressures
are applied in large populations (Blasco et al. 1995). and the uncertainty about fixed effects and variance
components. Using this approach, the uncertainty Selection for ovulation rate and prenatal survival have
been suggested as indirect ways to improve litter size about response to selection is described via its marginal posterior distribution, without resorting to approxima-(Johnsonet al. 1984). Only one selection experiment
for ovulation rate in pigs and two in mice have been tions. This novel way of analyzing selection experiments is applied in the present work. The emphasis here is to published, but although an improvement in number of
ova released was obtained, no correlated response in incorporate prior information from the literature, which is combined with that arising from the experimen-litter size was observed. Selection for prenatal survival
has been undertaken in pigs using an index that in- tal data. To check consistency of conclusions with other methods of inference, results from a least-squares analy-cluded ovulation rate and prenatal survival up to 50
days, and it was successful in improving litter size. No sis and from a restricted maximum likelihood/best lin-ear unbiased prediction (REML/BLUP) procedure are experiments on prenatal survival have been reported in
pigs, but one experiment with mice showed promising succinctly presented. results (seeBlascoet al. 1993, 1995).
The objective of this paper is to report an analysis
MATERIALS AND METHODS of response to selection from two experiments using
French Large White pigs; one, for ovulation rate, and Animals:Three contemporary lines (two selected and one the other for prenatal survival. The results on the corre- control) were formed from the progeny of 50 French Large White sows from the INRA experimental herd of Saint-Gilles. lated response in litter size will be published separately.
Sows were artificially inseminated with semen from 25 boars Response to selection has traditionally been estimated
from French artificial insemination centers. The experiment using either least-squares procedures or mixed model
was conducted at the INRA experimental farm of Galle. From techniques with animal models (Sorensen and
Ken-each line of Ken-each generation z50 gilts and 6–8 boars from
nedy 1984). In either case, it is difficult to obtain a first litters were kept for breeding. Puberty was defined as the
first estrus, detected by standing response to a teaser boar. precise estimate of the sampling variance of the
estima-Estrus detection on a daily basis was initiated at 150 days of tor of selection response. A Bayesian approach has been
age and continued until 250 days of age. Ovulation rate at puberty was estimated by counting the number of corpora lutea using laparoscopy on females under general anesthesia, between 10 and 15 days after mating. Females were kept for two
Corresponding author: Agustin Blasco, Departamento de Ciencia
Ani-litters distributed in seven farrowing batches per generation. mal, Universidad Polite´cnica de Valencia, Box 22012, Valencia 46071,
(S-OR), gilts were selected for ovulation rate (OR) at puberty. In the second line (S-PS), gilts were selected for prenatal survival corrected for ovulation rate (PS), using data from the first two parities. Prenatal survival was computed as follows (Bidanelet al. 1996):
Ii5 1 2
o
j52
j51
100
3
TNBij ORij10.018(ORij2ORj)
4
,where TNBijand ORijare, respectively, the total number born and ovulation rate of female i in parity j, and ORjis the mean of parity j. The experiment included a control line in which both traits were measured.
Models and statistical inference:Selection was performed for one trait in each of the two selected lines and, accordingly, traits were analyzed univariately. In each case, the relevant selected line and control line were analyzed jointly. The data from OR, yor, was assumed to be generated from the following
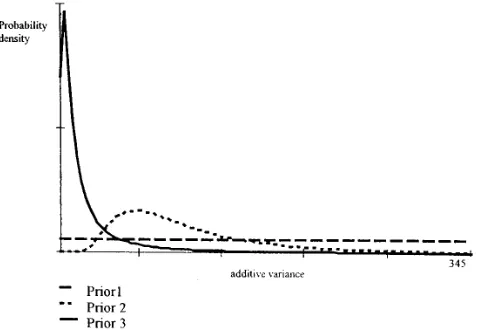
conditional multivariate normal distribution: Figure1.—Prior distributions for the additive variance of ovulation rate.
yorub,a,s2ezN(Xb1Za, Is2e) ,
where b is a vector of batch effects, a is a vector of additive genetic values,s2
e is the residual variance, X and Z are known the variance components. In this way, we can study how the design matrices, and I is the identity matrix. Prenatal survival use of different prior distributions affect the conclusions from (yps) was assumed to be conditionally normally distributed as the experiment. The first set is an attempt to ignore prior
follows: knowledge about the additive variance for ovulation rate. This
was approximated assuming a uniform distribution, where the
ypsub,a,c,s2ezN(Xb1Za1Wc,Is2e),
additive variance can take any positive value up to the assumed where the vector b contains both batch and parity effects, c value of the phenotypic variance, with equal probability. In is a vector of permanent environmental effects, and W is a set two, the prior distribution of the additive variance is such known design matrix. The remaining parameters have an in- that its most probable value is close to 2.5, but the opinion terpretation equivalent to that in the model for OR. Prelimi- about this value is rather vague. Thus, the approximate prior nary analyses indicated that maternal effects did not contrib- distribution assigns similar probabilities to different values of ute to variation in either OR or PS, and no association between the additive variance of z2.5. The last case is state three, OR and PS with age within parity could be detected. Thus, which illustrates a situation where a stronger opinion about these effects were not included in the final model. the probable distribution of the additive variance is held, a As mentioned before, the statistical analysis was carried out priori, based on the fact that the breed used in this experiment using a Bayesian perspective. This requires a judicious choice is the same as in Bidanelet al. (1992). The stronger prior of prior distributions for all the parameters in the model. opinion is reflected in a smaller prior standard deviation. Invoking the infinitesimal model (i.e.,Bulmer1980), additive Priors describing states two and three are scaled inverted chi-genetic values for both OR and PS were assumed to follow a square distributions. The scaled inverted chi-square distribu-multivariate normal distribution tion has two parameters, v and S2. These parameters were varied on a trial and error basis until the desired shape was
auA,s2
azN(0,As2a), obtained. Figure 1 illustrates the three prior densities for the where A represents the known additive genetic relationship additive variance for ovulation rate.
matrix, 0 is a vector of zeros, ands2
ais the relevant (i.e., OR The same procedure was applied for prenatal survival. Here, or PS) additive genetic variance in the base population from prior distributions for variance components were built on the which the data were sampled. In the case of PS, the distribution assumption that the phenotypic variance is 345 (Bidanel et of permanent environmental effects was assumed normal and al. 1996). The published heritabilities are centered at z0.2,
of the form ranging from 0 to 0.23.Bidanelet al. (1992) gave a value of
0.03, with a standard error of 0.03 for French Large White
cus2
czN(0, Is2c) , pigs. The state of opinion one was represented using uniform priors for all variance components. In state two, similar proba-wheres2
cis the component of variance associated with
perma-nent environmental effects. Improper uniform prior distribu- bilities of additive variance are assigned to values ofz70, and the state of opinion three assigns relatively high mass to values tions were assumed to approximate vague prior knowledge
about parity and batch effects in both traits. of additive variance near zero. These are shown in Figure 2. The random variable genetic mean for a particular selected Prior distributions for variance components were built on
the basis of information from the literature. The approach line (S-PS or S-OR) and generation, whose marginal posterior distribution we wish to obtain, was defined as the average followed to generate a prior distribution for the additive
ge-netic variance is described below. The remaining components additive genetic value among individuals belonging to that line and generation.
of variance were assigned prior distributions in a similar
man-ner. For ovulation rate, most of the published research shows In order to draw marginal inferences about response to selection or other genetic parameters using the Bayesian heritabilities of eitherz0.1 orz0.4, ranging from 0.1 to 0.6
(Blascoet al. 1993).Bidanelet al. (1992) reports an estimate approach, it is necessary to derive the relevant marginal pos-terior distribution. This requires performing multiple inte-of heritability inte-of 0.11 with a standard error inte-of 0.02 in a French
Large White population. On the basis of this prior information grals that do not have analytically tractable solutions under the present models. To circumvent this problem, one can for ovulation rate, and assuming a phenotypic variance of 6.25
TABLE 1
Parameters of inverse chi-square prior distributions of variance components
Trait Priors va S2a vc S2c ve S2e
OR 2 6.5 2.4 — — 30 3.6
3 6.5 0.6 — — 30 5.4
PS 2 6.5 80 6.5 20 30 300
3 2.5 32 6.5 20 30 348
OR, ovulation rate at puberty; PS, prenatal survival; v, S2, parameters of the chi-square distribution; a, additive genetic effects; c, permanent environmental effects; e, residual effects.
Figure2.—Prior distributions for the additive variance of mately reflects the information that was available from
prenatal survival. the literature before the experiment was conducted.
Results from the Bayesian analysis can be found in Tables 2–5. The mean and standard deviations of the application of this technique in the analysis of selection
experi-marginal posterior densities of heritability for OR and ments can be found inSorensenet al. (1994). In the present
PS, and repeatability for PS, calculated using the three work, the Monte Carlo estimate of the marginal posterior
sets of prior distributions, are shown in Table 2. Esti-distribution of the genetic mean for a particular generation
and line can be described as follows: first, in a particular round mates of the mean of the marginal posterior distribution of the Gibbs sampling procedure, a draw was obtained from of heritability for OR ranged from 0.32 to 0.39 and the joint posterior distribution of the vector of additive genetic
from 0.11 to 0.16 for PS, depending on the prior used. values. Second, the additive genetic values belonging to the
Estimates of the mean of the marginal posterior distribu-generation in question were averaged. This average
consti-tion of repeatabilities for PS range from 0.23 to 0.19. tuted one sample from the marginal posterior distribution of
the genetic mean. The number of rounds in which this was Table 2 also shows posterior standard deviations. These repeated was equal to the length of the Gibbs chain, and results indicate that three prior distributions that differ the resulting samples constitute Monte Carlo draws from the
considerably lead to similar posterior inferences about marginal posterior distribution of the genetic mean for the
heritabilities and repeatabilities. line and generation in question. The justification for
interpre-Tables 3 and 4 show Monte Carlo estimates of means ting the mean of the samples of additive values, as a sample
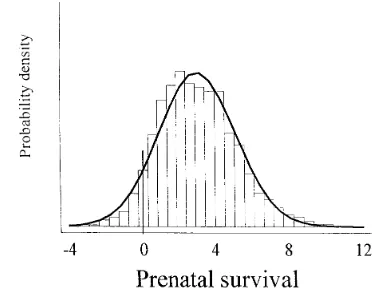
from the marginal posterior distribution of the genetic mean, of posterior distributions of genetic means for OR and is based on standard results of Markov chains, and more details PS, respectively. Because of to the approximate normal-can be found in, for example,Gilkset al. (1996).
ity of all the posterior densities (see Figures 3 and 4), The final results of experimentation included in this work
it is simple to obtain estimates of posterior confidence were obtained by averaging the results obtained from two
regions from the data in the tables. In both cases, there independent chains, each of length 100,000. In each chain,
the first 10,000 samples were discarded and thereafter saved is a clear indication that selection has been successful every 30 iterations, thus keeping a total of 3000 samples. This and the results are little affected by the prior distribu-strategy was arrived at empirically after studying the results of
tions. For OR, the three sets of prior distributions lead several different runs and satisfying the requirements obtained
to very similar posterior inferences. The response to by applying Rafteryand Lewis’s (1992) method to obtain
inferences about quantiles from marginal posterior distribu-tions with a given level of precision.
TABLE 2
Estimates of features of marginal posterior distributions were obtained directly from the Gibbs samples. The
autocorre-Mean (m) and standard deviation (SD) of posterior density
lation between samples and the Monte Carlo error of the
esti-of heritability (h2) and repeatibility (r) for ovulation rate
mates were computed using methods described inGeyer(1992).
at puberty (OR) and for prenatal survival (PS) in a French Large White population, obtained
using three prior distributions
RESULTS
The raw mean and standard deviation for OR, from Prior m(h2) SD(h2) m(r) SD(r) the control line, were 12.97 and 2.28, respectively, based
OR 1 0.39 0.07 — —
on 388 data points. The corresponding figures for PS 2 0.39 0.06 — —
were 65.56 and 18.35, based on 351 data points. 3 0.32 0.06 — —
Table 1 shows the parameters (v, S2) of the scaled
PS 1 0.12 0.06 0.23 0.05
inverted chi-square prior distributions of the variance
2 0.16 0.04 0.23 0.04
approxi-TABLE 3
Monte Carlo estimates of means and standard deviations (in parentheses) of posterior densities of genetic means
of generations one to four (G1–G4) for OR in the selected line (S-OR), calculated using
the three sets of prior distributions
Prior G1 G2 G3 G4
S-OR 1 0.30 0.51 1.03 1.58
(0.31) (0.35) (0.39) (0.43)
2 0.31 0.51 1.05 1.55
(0.30) (0.34) (0.38) (0.42)
Figure3.—Posterior density of the average breeding values in the last generation of selection for ovulation rate at puberty.
3 0.31 0.51 1.01 1.53
(0.31) (0.35) (0.35) (0.38)
As we mentioned before, the results presented here are based on the average results from two independent four generations of selection for OR has been z0.40 chains. Computation of the Monte Carlo standard er-ova per generation,.3% of the average per generation. rors indicated that the estimates did not differ signifi-For PS, the posterior uncertainty of response is.OR. cantly between chains. To illustrate this point, Monte The 95% posterior confidence regions of total response Carlo standard errors of the estimates of posterior (genetic mean at generation four) for prior sets one, means of heritability for OR and PS, repeatability for two, and three are approximately (21.35, 7.13), (21.11, PS, and of the genetic means for OR and PS at genera-8.09), and (21.12, 6.92), respectively. Using prior set tion four, are shown in Table 5. In all cases, the differ-one, the empirical posterior probability that the genetic ence in estimates of posterior means between chains mean in the last generation was .0 is 95%. This was were ,1023 for heritabilities and repeatabilities and estimated computing the proportion of the Monte Carlo ,1022 for the estimates of the genetic means.
samples from the posterior density of the genetic mean The data were also analyzed using least-squares and in generation four that were .0. An estimate of the the “REML/BLUP” procedures. This was done to check marginal posterior density of the genetic mean at gener- for consistency of conclusions with alternative methods ation four using prior set one is shown in Figure 4. of inference and to contrast the Bayesian approach with An improvement of 3–4% of prenatal survival in four the other two traditional approaches. The least-squares generations of selection implies a 1.1–1.5% increase of approach for both OR and PS was applied to a model the average survival rate per generation. For both traits, that included generation and batch-nested within gen-we note that the posterior variance of the genetic means eration for OR, and parity number, generation, and increases with each generation. This is a reflection of the batch-nested within generation for PS. The difference correlation among additive genetic values that builds up as between the least-squares estimates of generation effects a result of genetic drift, which is captured by the Bayesian from the selected and control lines are shown in Table
analysis. 6. The picture that emerges from OR is relatively clear:
response to selection is effective with a total response
TABLE 4
Monte Carlo estimates of means and standard deviation (in parentheses) of posterior densities of genetic means
of generations one–four (G1–G4) for PS in the selected line (S-PS), calculated using
the three sets of prior distributions
Prior G1 G2 G3 G4
S-PS 1 20.53 1.23 2.83 2.89
(1.44) (1.61) (1.94) (2.12)
2 20.64 1.50 3.46 3.49
(1.70) (1.87) (2.05) (2.30)
3 20.46 1.22 2.84 2.90
Figure4.—Posterior density of the average breeding values (1.45) (1.60) (1.82) (2.01)
TABLE 5
Monte Carlo standard errors (SE) of the estimates of means of heritabilities (h2), repeatabilities (r),
and of the genetic means of generation four (G4) from lines S-OR and S-PS
S-OR S-PS
Prior 1 Prior 2 Prior 3 Prior 1 Prior 2 Prior 3
SE (h2) 0.002 0.002 0.002 0.005 0.002 0.003
SE (re) — — — 0.002 0.001 0.002
SE (G4) 0.018 0.023 0.021 0.120 0.087 0.182
ofz0.45 ova per generation. This is in agreement with ties for OR and PS have been reported in a preliminary analysis of the same data set by Bidanelet al. (1996).
the results from the Bayesian analysis. Prenatal survival
is a more variable trait; the results are less clear and The heritability estimates given byBidanelet al. (1996)
are 0.36 for OR and 0.14 for PS, which is in agreement little can be concluded from this least-squares analysis.
Sampling variances of the least-squares estimators can- with the results reported here. Table 6 shows the evolu-tion of the genetic means for both OR and PS using not be obtained exactly, but approximations that
ac-count for genetic drift are available (i.e., Hill 1980; “REML/BLUP” with the above estimates. The results
for OR are in agreement with those obtained using
Sorensen and Kennedy 1983). These were not
com-puted in the present work. This erratic picture of selec- the Bayesian approach. The results for PS resemble the results obtained under the prior set two, but there is tion response is often characteristic of the least-squares
analysis. no theoretical reason for this similarity here. It is only in very large samples that there should be agreement The “REML/BLUP” approach is a two-step
proce-dure, whereby genetic variances are estimated in the between inferences based on “REML/BLUP” and the Bayesian approach.
first step using restricted maximum likelihood, and are used in lieu of the true parameters to solve the mixed model equations in the second step (Sorensen and
DISCUSSION
Kennedy 1986). Because of the “shrinkage” associated
with this method, inferences about response to selection We have presented a Bayesian analysis of response to are often clearer than those obtained using least- selection for ovulation rate at puberty and for prenatal squares. Further, in contrast to the least-squares proce- survival in French Large White pigs. It is a characteristic dure, the method can disentangle genetic and nonge- of the Bayesian approach to inference that the final netic trends in complicated data structures with overlap- conclusion (which is based on the posterior distribu-ping generations. Two shortcomings of the procedure, tion) is the result of combining two sources of informa-however, are the following: first, that estimated vari- tion. One of these sources arises from the prior distribu-ances are regarded as known parameters and no ac- tion, before the data were collected, and the other arises count is taken of the error of estimation. Second, the from the experimental data itself. The analysis per-exact sampling distribution of the prediction of re- formed here made use of very different prior distribu-sponse to selection obtained with this procedure is not tions for the variance components. However, despite known. This makes it difficult to describe the error of these different contributions from prior information, estimation of response. posterior inferences did not differ substantially. This is Residual maximum likelihood estimates of heritabili- a reassuring conclusion, and it indicates that the experi-ment has enough informational content to override the influence of prior information to a large extent. In
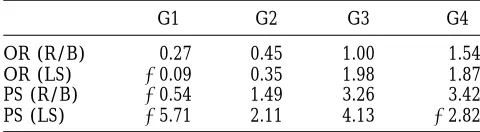
TABLE 6
contrast with the other two methods of inference used
Estimates of genetic means using least squares (expressed in this study, the Bayesian approach to study response as deviations between selected line and control line) for to selection takes into account the fact that other param-ovulation rate at puberty OR (LS) and for prenatal survival eters (nongenetic effects and genetic variances) are
be-PS (LS), and using “REML/BLUP”-OR (R/B), be-PS (R/B)
ing estimated from the same data. It also provides a Monte Carlo estimate of the marginal posterior
distribu-G1 G2 G3 G4
tion, which encapsulates all the information required
OR (R/B) 0.27 0.45 1.00 1.54 for inferences about selection response. This posterior
OR (LS) 20.09 0.35 1.98 1.87 density is obtained without invoking analytic
approxima-PS (R/B) 20.54 1.49 3.26 3.42 tions or asymptotic results.
PS (LS) 25.71 2.11 4.13 22.82
Thus,HaleyandLee(1992) reported an estimate of
survival in mice. I. Response to selection. Genetics 61: 905–921. zero, andBidanelet al. (1992) reported an estimate of
Bradford, G. E., 1979 Genetic variation in prenatal survival and
litter size. J. Anim. Sci. 49(Suppl. 2): 66–74. 0.0360.03 for PS until the 30th day of gestation, using
Bulmer, M. G., 1980 The Mathematical Theory of Quantitative Genetics.
data from a French Large White pig line. The estimates
Clarendon Press, Oxford, UK.
obtained in the present study have a probability of Casey, D., T. RathjeandR. Johnson,1994 Response to ten
genera-tions of selection for components of litter size in swine.
Proceed-z95% of being.0 in all cases.
ings of the VI World Congress on Genetics Applied to the Livestock It is clear that selection was effective for OR, as is to Production, August 7–12, 1994, Guelph, Ontario, Canada. Vol. 17, be expected from its high heritability. Selection for OR pp. 315–317.
Geyer, C. M., 1992 Practical Markov chain Monte Carlo (with
discus-has also been effective in the only other experiment
sion). Statistical Science 7: 467–511. carried out in pigs (Johnson1992), and in two
experi-Gilks, W. R., S. RichardsonandD. J. Spiegelhalter, 1996
Intro-ducing Markov chain Monte Carlo, pp. 1–19 in Markov Chain ments with mice (Bradford1969;LandandFalconer
Monte Carlo in Practice, edited by W. R. Gilks, S. Richardson
1969). Selection for PS has only been undertaken in and
D. J. Spiegelhalter. Chapman & Hall, London.
mice (Bradford1969, 1979), with positive results, but Haley, C. S., andG. J. Lee, 1992 Genetic factors contributing to
variation in litter size in British Large White gilts. Livest. Prod. an experiment of selection for OR and PS in pigs does
Sci. 30: 99–113.
not seem to have improved PS (Caseyet al. 1994). Our
Haley, C. S., E. AvalosandC. Smith, 1988 Selection for litter size
results show a low increment in PS, but the response, in the pig. Anim. Breed. Abstr. 56: 317–332.
Hill, W. G., 1980 Design of quantitative genetic selection
experi-although low, is positive with a posterior probability of
ments, pp. 1–13 in Selection Experiments in Laboratory and Domestic
z95%. Further research will determine the correlated Animals, edited byA. Robertson. Commonwealth Agricultural
Bureau, Slough, UK. responses in litter size and other traits.
Johnson, R. K., 1992 Selection for fertility in swine. Pig News and
This research was conducted during a sabbatical of A.B. at the Information 13: 59–61.
Johnson, R. K., D. R. ZimmermanandR. J. Kittok, 1984 Selection
Station de Ge´ne´tique Quantitative et Aplique´e in Jouy-en-Josas,
fi-for components of reproduction in swine. Livest. Prod. Sci. 11: nanced by the Spanish Ministry of Education and Science.
541–545.
Land, R. B., andD. S. Falconer, 1969 Genetic studies of ovulation
rate in the mouse. Genet. Res. Camb. 13: 25–46.
Raftery, A. E., andS. M. Lewis, 1992 How many iterations in the
Gibbs sampler?, pp. 765–776 in Bayesian Statistics, Vol. 4, edited LITERATURE CITED
byJ. M. Bernardo, J. O. Berger, A. P.DawidandA. F. M. Smith. Oxford University Press, Oxford, UK.
Bidanel, J. P., A. Ducos, E. Groeneveld, J. Gruand, H. Lagantet
Sorensen, D. A., andB. W. Kennedy, 1983 The use of the relation-al., 1992 Genetic variablity of components of litter size in French
ship matrix to account for genetic drift variance in the analysis Large White gilts. 43rd Annual Meeting of the European
Associa-of genetic experiments. Theor. Appl. Genet. 66: 217–220. tion for Animal Production, September, 1992, Madrid.
Sorensen, D. A., andB. W. Kennedy, 1984 Estimation of response Bidanel, J. P., A. Blasco, J. GogueandH. Lagant, 1996 Re´sultats
to selection using least squares and mixed model methodology. J. de quatre ge´ne´rations de se´lection pour le taux d’ovulation et
Anim. Sci. 58: 1097–1106. la survie pre´natale chez les porcs de race Large White. Journe´es
Sorensen, D. A., andB. W.Kennedy, 1986 Analysis of selection
de la Recherche Porcine 28: 1–8. experiments using mixed model methodology. J. Anim. Sci. 63:
Blasco, A., J. P. Bidanel, G. Bolet, C. HaleyandM. A. Santacreu,
245–258.
1993 The genetics of prenatal survival of pigs and rabbits: a Sorensen, D. A., C. S. Wang, J. JensenandD. Gianola, 1994 Bayes-review. Livest. Prod. Sci. 37: 1–21. ian analysis of genetic change due to selection using Gibbs
sam-Blasco, A., J. P. BidanelandC. Haley, 1995 Genetics and neonatal pling. Genet. Sel. Evol. 26: 333–360.
survival, pp. 17–38 in Neonatal Survival in Pigs, edited byM.