ABSTRACT
MARSHALL, MERCEDES. Productivity in Textiles: How to Correctly Measure the Impact of Mergers and Outsourcing. (Under the direction of Helmut H. Hergeth.)
The purpose of the research has been to investigate how merger and outsourcing activities impact the way productivity is measured on five categories of company resources: human, physical, knowledge, capital, and infrastructure resources. This research involves: an assessment of productivity measures with the goal of determining which resource category are key areas to monitor after merger activity, an evaluation of profitable textile mergers with the goal of delineating the execution of the merger strategies, an analysis of the effect of increased outsourcing on productivity growth with respect to the textile industry, and an evaluation of the adequacy of productivity measures in representing the economic competitiveness of the US Textile Industry. For the sample of textile companies, merger activity impacts the productivity of capital and knowledge resources the most. The most common strategies employed during successful textile mergers targeted the improvement of: corporate structure, product differentiation and speed to market. The influence of outsourcing on productivity growth in the textile industry was found to be negligible when comparing productivity measures that include and exclude outsourcing. In order to get a better
understanding of competitiveness, companies are not looking solely at productivity, but are pairing productivity with other measures mainly profitability measures. Of all the resource categories, the productivity of knowledge resources is the leading contributor to
PRODUCTIVITY IN TEXTILES:
HOW TO CORRECTLY MEASURE THE IMPACT OF MERGERS AND OUTSOURCING
By
MERCEDES MARSHALL
A thesis submitted to the Graduate Faculty of North Carolina State University
in partial fulfillment of the requirements for the Degree of
Master of Science
TEXTILES
Raleigh, North Carolina
2007
APPROVED BY:
___________________________ ___________________________
Dr. Moon W. Suh Dr. W. Gilbert O’Neal
Committee Member Committee Member
___________________________
DEDICATION
Es mi fe en Dios que me ha dado la habilidad de perseverar en tiempos difíciles. Es mi amor para mi Mamá & Papá, mis héroes, eso me da valor a enfrentar el mundo.
Es mi esperanza de ser un modelo para mis hermanitos que me lleva a tener éxito.
Yo le dedico mi todo a ellos. ~
It is my faith in God that has given me the ability to persevere in difficult times. It is my love for my Mom & Dad, my heroes, that gives me courage to face the world.
It is my hope to be a role model for my little brothers which drives me to succeed.
BIOGRAPHY
The author, Mercedes Marshall, was born in Rio Piedras, Puerto Rico on May 3, 1983. She is the daughter of Mercedes Gonzalez-Marshall & Robert Lee Marshall and is a native speaker of both Spanish and English. She grew up with the typical US Military lifestyle involving lots of moving to and from Europe, the Caribbean, and the United States. She eventually became an undergraduate attending North Carolina State University and graduated cum laude in 2005 with a B.S. in Textile and Apparel Management. Her accolades include being
ACKNOWLEDGEMENTS
There are so many individuals whose presence in my life has been a blessing. I would like to thank my family and my friends for their understanding and continuous support in spite of my need to contribute so much of my time these past two years to my masters program and thesis research process. Your words of inspiration lifted my spirits more than you can ever know.
In addition I would like to acknowledge the great influence my fellows of the ITT class of 2007 have had on me these past two years: Nathalie Andrae, Matt Berdine, Melissa Burchett, Kelly Goforth, Craig Lindemann, Marc Matthews, Bobby McLean, Wade Tyner, and April Wagoner. I truly could not have entered this program with a better group of people. Your presence fostered an environment that allowed me to surround myself with excellence for two straight years. Our interactions challenged me to constantly raise the bar, strive for the best academically, and most importantly work as a team. For all this I am forever thankful and wish nothing but the best to you all in your future endeavors.
To Chris Moses and Patrice Hill, know that I see you each as the backbone of the ITT program. I sincerely thank you both for listening to my concerns, comforting me, believing in me, and guiding me through this long process. Even though I am moving forward to my professional career now, I hope that when you see fingerprints on your laptop screen or missing chocolates from your candy box you will remember me; as I will forever remember these as symbols of your patience in guiding me through all my brainstorming or comforting me when I was feeling lost.
TABLE OF CONTENTS
LIST OF TABLES... viii
LIST OF FIGURES ... ix
I. INTRODUCTION ... 1
A. Productivity Gains after Mergers... 1
B. Increase in Outsourcing in Textile Industry... 2
C. Productivity Measures Adequacy for Competitiveness... 2
D. Study Objectives ... 3
E. Significance of This Study... 4
II. LITERATURE REVIEW ... 5
A. Common Textile Industry Issues ... 5
B. Using Productivity to Address Issues ... 6
C. Application of Productivity Aimed at Improvement ... 6
D. Mergers Influence on Productivity ... 7
E. Company Resource Inputs ... 8
F. Resource Category Growing in Importance to Productivity... 10
G. Possible Influence of Outsourcing on Productivity ... 12
H. Explanation of Productivity Data for Outsourcing Analysis ... 12
1. Description of Measures ... 13
2. Definition of Measures ... 14
3. Recommended Uses for Bureau of Labor Statistics Data... 15
4. Glossary of Productivity Output and Input Variables... 15
III. METHODOLOGY ... 20
A. Overview of All Research Designs... 20
1. Merger & Productivity... 20
2. Outsourcing & Productivity... 20
3. Competitiveness & Productivity ... 21
B. Merger and Productivity Research Design ... 22
1. Textile Company Survey ... 22
2. Productivity Case Study... 23
3. Profitability Analysis ... 24
C. Outsourcing and Productivity Research Design ... 27
1. KLEMS Inputs Analysis ... 27
2. Dual Output Comparison ... 29
D. Competitiveness and Productivity Research Design ... 30
1. Core Concepts Questionnaire ... 30
2. Scale Tools... 30
E. Questionnaire Development Process ... 31
1. Specify the type of interviewing method ... 31
3. Decide on question structure... 33
4. Arrange the questions in proper order ... 33
F. Sample Selection Process ... 34
1. Defining Sample Limits... 34
2. Interview Scheduling Process ... 35
G. Overview of Data Sources ... 36
1. Sources of Productivity Data ... 36
2. Sources of Profitability Data... 37
3. Sources of State of the US Textile Industry Data ... 37
H. Analysis Process for Survey Data... 38
I. Analysis Process for Numerical Data ... 39
1. Path 1: Correlation & Regression ... 39
2. Path 2: t-Testing... 40
IV. RESULTS ... 41
A. Mergers and Productivity Results... 42
1. Textile Company Survey Results... 44
a) Company A Textile Survey Results... 44
b) Company B Textile Survey Results... 48
c) Company C Textile Survey Results... 50
d) Company D Textile Survey Results... 52
e) Company E Textile Survey Results ... 54
f) Overall Results & Interpretation of All Textile Company Surveys... 57
2. Productivity Case Studies Results ... 62
a) Company A Productivity Case Study Results ... 62
b) Company B Productivity Case Study Results... 65
c) Company C Productivity Case Study Results... 68
d) Company D Productivity Case Study Results ... 71
e) Company E Productivity Case Study Results... 74
f) Overall Results & Interpretation of Productivity Case Studies ... 77
3. Profitability Analysis Results ... 83
a) Company A Part 1: Profitability Analysis ... 85
b) Company E Part 1: Profitability Analysis... 89
c) Company F Part 1: Profitability Analysis... 92
d) Company G Part 1: Profitability Analysis ... 97
e) Company H Part 1: Profitability Analysis ... 99
f) Company I Part 1: Profitability Analysis... 102
g) Company J Part 1: Profitability Analysis... 104
h) Company K Part 1: Profitability Analysis ... 106
i) Company L Part 1: Profitability Analysis... 109
j) Company M Part 1: Profitability Analysis... 113
k) Part 2: Profitability Analysis... 116
1. Overall Results & Interpretation of Profitability Analysis ... 119
B. Outsourcing and Productivity Results ... 120
1. KLEMS Inputs Analysis Results ... 121
3. Overall Results & Interpretation of Outsourcing Analysis... 126
C. Competitiveness and Productivity Results... 127
1. Core Concepts Questionnaire Results... 127
a) Meaning of Productivity to Textile Companies... 127
b) Meaning of Competitiveness to Textile Companies... 129
2. Scale Tools Results ... 130
a) Competitiveness Scorecard... 130
b) Constant Sum Scale ... 131
3. Overall Results & Interpretation of Core Concepts Questionnaire and Scale Tools.. 132
V. CONCLUSIONS & RECOMMENDATIONS... 134
A. Conclusions... 134
1. Merger & Productivity Research Objective... 134
2. Outsourcing & Productivity Research Objective... 136
3. Competitiveness & Productivity Research Objective... 136
B. Recommendations... 137
1. Knowledge Resource Measurement ... 137
VI. REFERENCES ... 138
VII. APPENDICES ... 144
A. Appendix A: Research Packet ... 145
1. Appendix A1: Research Packet Title Page ... 146
2. Appendix A2: Cover Letter ... 147
3. Appendix A3: Research Packet Definitions Page... 148
4. Appendix A4: Respondent’s List of Questions ... 149
5. Appendix A5: Questionnaire Administration Form ... 150
B. Appendix B: Interview Scheduling Documents ... 155
1. Appendix B1: Sample of Targeted Companies ... 156
2. Appendix B2: General Phone Script Explaining Research... 157
3. Appendix B3: General Email Explaining Research... 158
C. Appendix C: Filled Rubrics ... 159
1. Appendix C1: Company A Rubric... 160
2. Appendix C2: Company B Rubric... 162
3. Appendix C3: Company C Rubric... 164
4. Appendix C4: Company D Rubric... 166
5. Appendix C5: Company E Rubric ... 168
D. Appendix D: Raw Data Tables for Profitability Analysis ... 170
1. Appendix D1: Raw Data Table of Extrapolated Business Strategies ... 171
E. Appendix E: Raw Data Tables for Analysis on Outsourcing ... 173
1. Appendix E2: Raw Data Table for Outsourcing KLEMS Approach ... 174
2. Appendix E3: Raw Data Table for Outsourcing Dual Output Approach ... 174
F. Appendix F: Detailed Analysis of Outsourcing Data ... 175
1. Appendix F1: Detailed Bivariate Fits of KLEMS Input Deepenings ... 176
LIST OF TABLES
Table 1. Comparative Evaluation of Survey Methods (Malhotra, 2004) ... 32
Table 2. Connecting Research Questions to Research Objectives ... 32
Table 3. Advantages and Disadvantages of Scales... 33
Table 4. Results Outline... 41
Table 5. US Textile Industry Machinery Capabilities ... 44
Table 6. Overall Results of Textile Company Survey ... 57
Table 7. Summary of the Impact of Mergers on Human Resources... 77
Table 8. Summary of the Impact of Mergers on Physical Resources... 78
Table 9. Summary of the Impact of Mergers on Knowledge Resources ... 79
Table 10. Summary of the Impact of Mergers on Capital Resources... 80
Table 11. Summary of the Impact of Mergers on Infrastructure Resources... 81
Table 12. US vs. International Financial Ratios ... 83
Table 13. Bivariate Fit of Resource Growth Contributions by Year ... 122
Table 14. Multivariate Correlations of Resource Growth Contributions ... 123
Table 15. Bivariate Fits of Growth in Dual Output per Hour by Year ... 124
Table 16. Results of Competitiveness Scorecard... 130
LIST OF FIGURES
Figure 1. Determinants of Productivity & Productivity Growth ... 9
Figure 2. Question Flow for Part 1: Textile Company Survey ... 23
Figure 3. Question Flow for Part 2: Productivity Case Study ... 24
Figure 4. Process Flow for Part 1: Profitability Analysis ... 25
Figure 5. Process Flow for Part 2: Profitability Analysis ... 26
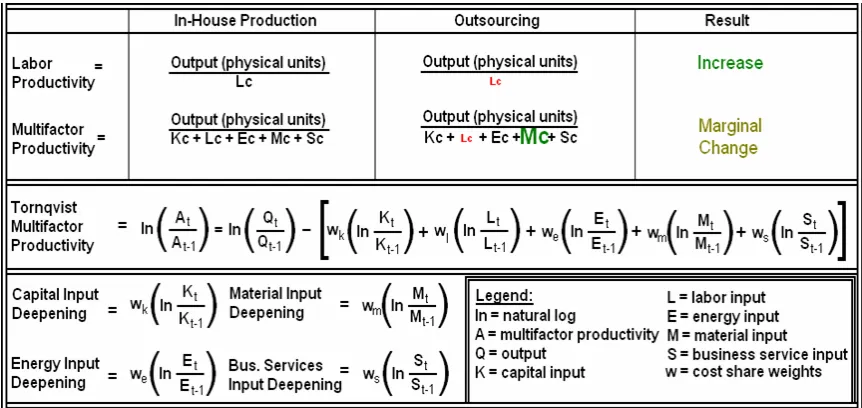
Figure 6. KLEMS Inputs Equations ... 27
Figure 7. Textile Industry Merger Trends... 42
Figure 8. Textile Industry Productivity... 43
Figure 9. Merger Impact on Resource Productivity... 82
Figure 10. Profitabile Business Strategies used for Merger Activity ... 116
Figure 11. Summary of Improving Corporate Structure... 117
Figure 12. Summary of Improving Product Differentiation ... 118
Figure 13. Summary of Improving Speed to Market... 119
Figure 14. Outsourcing for the US Textile Industry ... 120
Figure 15. Summary of Dual Output Comparison... 125
I.
INTRODUCTION
Productivity for the United States textile industry has consistently improved and surpassed those of other countries (Baumol, 1984; Ramcharran, 2001; R. Reichard, 2000). During the 16-year period from 1987 to 2003, the average output per textile worker rose 3.9 percent annually — with fiber/yarn/thread and fabric mills obtaining even more impressive 5.2-percent and 4.4-5.2-percent increases, respectively (R. S. Reichard, 2005). While annual
productivity gains for broad-woven fabrics, hosiery and yarn spinning mills over the 1990-to-date period are put at 5.7%, 3.1% and 4.7% respectively (R. Reichard, 1997).
However, this growth is not improving competitiveness as much as it seems to increase productivity. The barriers of trade, between the United States textile industry and other countries, have gradually decreased culminating with the elimination of quotas in 2005. Escalating production prices and the threat of increased competition, especially from the Asia Pacific region, has meant that foreign producers have gained a greater share of the US market (Felgner, 2005; Milberg, 2004). In light of this, the US textile industry utilizes a great
amount of outsourcing and at the same time the industry shows a fair number of merger activities with the anticipation of improved competitive positioning, including improved productivities (Abend, 2001; Kurz, 2006; Morrissett & Dawson, 1999; R. Smith, 2001). While there have been studies on the impact of mergers on productivity and on the impact of outsourcing on productivity, this study will address the following voids in existing literature.
A.
Productivity Gains after Mergers
Research done thus far on the impact of mergers on productivity comes from two basic types of large samples studies: event studies and performance studies. Event studies show that the combined returns to shareholders are indisputably positive and provide some understanding of the nature of the market reaction to acquisition announcements, yet, do not examine whether the anticipated value creation or improved productivity materializes; the
drive for merger/acquisition success or failure, and evidence of improved performance or productivity gains.
The analysis of the impact of merger activity on productivity in this study addresses the voids in literature above by surveying textile companies to determine the intended benefits of their merger, whether these benefits are realized, and how their realization is measured.
Afterwards are the case studies that focus on specific changes within company resources and how their productivity is measured. This area concludes with a profitability analysis for selected textile companies after merger activity to determine which business strategies employed in the industry have proven to be successful.
B.
Increase in Outsourcing in Textile Industry
Recent discussions about the increase of outsourcing in the textile industry have raised questions about their possible impact on productivity growth (Outsourcing 2000; Abend, 2001; Kurz, 2006). Research done thus far on this issue focus on the manufacturing and service industries as a whole, not on individual sub sectors such as textiles; these studies suggest that the impact of outsourcing on productivity change is likely to be small (Baily & Lawrence, 2005; Heshmati, 2003). This study addresses the impact of outsourcing on productivity growth by analyzing data sets, pertaining specifically to the textile industry, through a comparison of productivity measures that include versus productivity measures that exclude outsourced products.
C.
Productivity Measures Adequacy for Competitiveness
D.
Study Objectives
1. Merger & Productivity Research Objective
The first research objective is to determine the impact of mergers on traditional productivity measures used on different categories of company resources.
2. Outsourcing & Productivity Research Objective
The second research objective is to determine if the increase in outsourcing has had an impact on the growth in productivity for the textile industry.
3. Competitiveness & Productivity Research Objective
E.
Significance of This Study
This study centers on the importance of effective productivity improvements for all resource areas for companies in the textile industry by looking into which areas are experiencing the most changes. A prominent misconception within the US Textile Industry is that productivity measurements limited to precisely defined manufacturing measures based on economies of scale are how the industry should represent its competitiveness. Since competitively driven activities such as mergers and outsourcing have the potential to effect company resources outside of manufacturing, the underlying significance of this study stems from determining the desired effects of merger events, the changes they bring to various company resources, and how productivity measurement is used to capture that change and productivity’s relationship to competitiveness.
This study will provide an assessment of which family of resource category productivity measures are important to monitor soon after merger activity because of the changes brought about on resource categories, and justification, or lack thereof, for the adequacy of
II.
LITERATURE REVIEW
The purpose of this literature review is to summarize relevant research and to provide basic understanding of the principles exercised in this study in order to provide the context in which to develop a methodology and interpret results. The sections relating to productivity and competitiveness include: common textile industry issues, using productivity to address issues, and the application of productivity aimed at improvement. The sections relating to productivity and mergers include: mergers influence on productivity, company resource inputs, and resource category growing in importance to productivity. The sections relating to productivity and outsourcing include: How outsourcing influence productivity, Description of Measures, Definition of Measures, Uses, Glossary of Terms, Data Sources [output, labor, capital, Energy, materials, purchased business services]. These topics serve as the foundation for the development of the methodology used in this study.
A.
Common Textile Industry Issues
B.
Using Productivity to Address Issues
Productivity measures help in preparing for these issues because their analysis can be used (Cliff, 2003):
• For strategic purposes to compare the global performance of the firm with competitors or similar firms.
• For tactical purposes, to enable management to control the performance of the firm via the performance of individual sectors of the firm either by function or product.
• For planning purposes, to compare the relative benefits accruing from the use of differing inputs or varying proportions of the same inputs.
• For internal management purposes, such as collective bargaining with trade unions.
This study suggests that companies that understand and monitor productivity are able to recognize how to allocate limited resources to their ventures that are in line with their company objectives. These findings are supported by other studies emphasizing the importance of understanding what is being measured before any steps of process improvement can be taken (Frazelle, 1992; Kendrick, 1984). Evaluating the process of measurement and interpretation of the measurements is further explained by Brides who gives one fundamental reason for measuring productivity: “Some type of benchmark
(standard, average, mean) should be determined, if none exists. How can you be sure of how much is being saved if you do not have a baseline? (Brides, 1992)” If the textile companies weren’t to have productivity objectives they would not have direction, and without
productivity measurement the companies would have no control (Drucker, 1974).
C.
Application of Productivity Aimed at Improvement
The benefits resulting from productivity measurement must be clear to all those involved. The employees must feel that the improvements gained through the measurement of productivity will have the appropriate impact on them. The system of compensation can be based on awards, payment, or any system as long as it is clear and established beforehand. The measurement system serves two basic functions for productivity improvement programs. First, people perform to measures when rewards are linked directly to those measures.
can lead to improvement in the score; we must keep sore on the right factors to meet company goals. Second the value of planned programs can be estimated only if specific measurement is possible. The effect of managerial changes can be determined subject to the net result on outputs and inputs as given in productivity ratios (Adam, 1981).
Aside from the four stated general purposes, the actual measurement system has two core functions for productivity improvement programs:
1. Employee Performance Guided by Measures – people perform to measures when
rewards are linked directly to those measures.
2. Value Guided by Defined Measures – the value of planned programs can be estimated only if specific measurement is possible.
Productivity measurement can itself be a productivity improvement program. “Keeping score can lead to improvement in the score; we must keep score on the right factors to meet
company goals. The effect of managerial changes can be determined subject to the net result on outputs and inputs as given in productivity ratios (Adam, 1981).”
The control of the direction of each company lies in the hands of its upper management, yet so frequently productivity measurement in the past has been limited to measures based on plant level manufacturing. After many years of innovation and improved technology, cut backs on cost are as far as they can go, as there are too few people employed in making and moving things for their improved productivity to be decisive (Drucker, 2000). This suggests the need to expand the control obtained through productivity measurement to other resource categories.
D.
Mergers Influence on Productivity
management teams with respect to the cooperation of managerial officials and employee participation.
Some of the studies found emphasize the importance of members of management in charge of the research and development of a product, the engineering or manufacture of the product, and those actually controlling the production of the product all being on the same page and in full cooperation with each other (S. N. Kaplan et al., 2000). The vision and direction that upper management has for the future of the company must not only be known and
understood by all employees, but also encouraged for them to participate in the process of making this a reality. Peter F. Drucker strongly emphasizes how imperative it is for the textiles industry to require people at every level to have a deep understanding of the
consequences of their actions; he further explains that every one participating in the process of manufacturing has to become knowledge worker so that improvements can be made in the process (Drucker, 2000).
E.
Company Resource Inputs
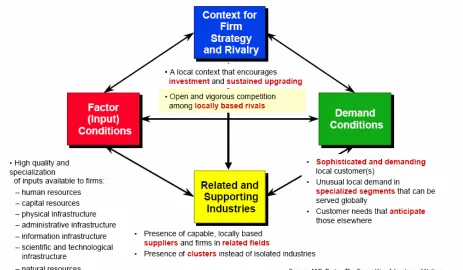
Figure 1. Determinants of Productivity & Productivity Growth
This model allows for a broad division of competitiveness into four specific determinants of productivity and productivity growth. The determinants, individually and as a system, create the context in which a nation’s firms are born and compete, including the availability of resources and skills necessary for competitive advantage in an industry (Porter, 1990). This study focuses on determining which resource categories, or ‘Factor Conditions’ as defined by Porter’s Diamond, are affected most by merger or outsourcing activities. By determining these critical resources, employing productivity measures on said resources would therefore benefit our understanding of how a company’s competitive situation has progressed.
Companies cannot control the environment in which they operate, market demand, or the capabilities of local suppliers – but they can control their use of resources. To explore the role of factors in this model, the concept must be made more meaningful to industry competition (Porter, 1990). The Factor Conditions branch of Porter’s Diamond categorizes resources available to firms into five main categories: human, physical, knowledge
1. The ‘Human Resources’ category refers to the “quantity, skills and cost of personnel, taking into account standard working hours and work ethic (Porter, 1990).”
2. The ‘Physical Resources’ category refers to the “abundance, quality, accessibility and cost of land, water, power, or other physical traits (Porter, 1990).”
3. The ‘Knowledge Resources’ category refers to the “stock of scientific, technical, and market knowledge bearing on goods and services (Porter, 1990).”
4. The ‘Capital Resources’ category refers to the “amount and cost of capital available to finance (Porter, 1990).”
5. The ‘Infrastructure’ category refers to the “type, quality, and user cost of
infrastructure available that affects competition, including transportation system, communications system, mail and parcel delivery (Porter, 1990).”
Porter states that “a nation’s firms gain competitive advantage if they possess low-cost or uniquely high-quality factors of the particular types that are significant to competition in a particular industry.” Therefore this study will include research of which of the above resources are most significant to competitiveness in the US textile industry according to those within US textile industry.
F.
Resource Category Growing in Importance to Productivity
It is important to note that productivity has always been a rather elusive concept due to the lack of definitive theoretical work (Cliff, 2003), but Dr. Jani Abbasi found that the causes of productivity level can be divided into the following areas (Abbasi, 1992): choice of
technology, capital or labor employed for cost effectiveness, type and level of technical and managerial knowledge, and timing of implementation. Dr. Abbasi’s research in each area reflects a very similar, albeit more concretely defined, explanation of the importance of resource decision-making to productivity levels. There is a type of resource whose value is not traditionally measured when evaluating productivity. It is the influence that employee knowledge has on productivity. It is also a resource that is difficult to quantify, but there are studies that confirm its growing importance in some industries nonetheless (Barber & Strack, 2005; Drucker, 2000; Frazelle, 1992).
were still less than one-third of the workforce. Now such people account for three-quarters if not four-fifths of the workforce in all developed countries –and their share is still going up. Their productivity rather than the productivity of the people who make and move things is the productivity of a developed economy.” (Drucker, 1993)
Traditional productivity measures are based on a labor intensive, economies-of-scale manufacturing setting, however with the advent of outsourcing labor-intensive components of the textile industry, many traditional manufacturers are now essentially service businesses in that the success of their business revolves largely around people, not capital (Barber & Strack, 2005). Frederick Smith’s study concluded that “productivity is not just the
G.
Possible Influence of Outsourcing on Productivity
Recent discussions about the increase of outsourcing in the textile industry have raised questions about their possible impact on productivity growth (Outsourcing.2000; Abend, 2001; Kurz, 2006). The use of foreign or offshore manufacturing as a way to use supply chains to expand the breath of products achievable with various technologies has been
documented by many studies (Fagan, 1991; Flaherty, 1986; Grunwald & Flann, 1985; Kogut, 1985). Outsourcing activities have an influence over the decision-making for technology which may or may not have an impact on productivity. According to these studies, the decision to exercise outsourcing options are partially driven by the market; those whom are competitive are those satisfying the market demands. Research done thus far on this issue focus on the manufacturing and service industries as a whole, not on individual sub sectors such as textiles; these studies suggest that the impact of outsourcing on productivity change is likely to be small (Baily & Lawrence, 2005; Heshmati, 2003).
H.
Explanation of Productivity Data for Outsourcing Analysis
The following section provides an explanation of the productivity data used in this study to determine the impact of outsourcing on productivity. The two approaches used in the report by the Bureau of Labor Statistics titled “The Effect of Outsourcing on Productivity
Measures” analyzed the impact of outsourcing focusing on the manufacturing industry. Being that these approaches were repeated in my study, the difference being that productivity data in my study is specifically for the textile industry, it was important to provide literature on the meaning of all the textile productivity data obtained from the Bureau of Labor Statistics.
Comparisons among multifactor productivity measures must be made with an understanding of the underlying definitions used in constructing each measure. The multifactor
productivity measures produced by the Bureau use two distinct concepts of real output which are characterized as gross product originating and sectoral output. For private business, private nonfarm business, and international multifactor productivity measures, a gross
1. Description of Measures
The BLS multifactor productivity measures were first introduced in Trends in Multifactor Productivity, 1948-81, Bulletin 2178, September, 1983, and have been updated annually.
Multifactor productivity measures reflect output per unit of some combined set of inputs. A change in multifactor productivity reflects the change in output that cannot be accounted for by the change in combined inputs. As a result, multifactor productivity measures reflect the joint effects of many factors including new technologies, economies of scale, managerial skill, and changes in the organization of production.
Since 1983, the multifactor productivity measurement program has expanded from producing measures for the major sectors of the U.S. economy only (private business, private nonfarm business, and manufacturing sectors) to include multifactor measures for 20 2-digit SIC manufacturing industries. The industry multifactor productivity program has expanded from a few selected 3- and 4-digit industries to include all 3-digit SIC manufacturing industries, railroad transportation, and air transportation.
BLS measures multifactor productivity in the total manufacturing and the 20 2-digit SIC manufacturing industries as output per unit of combined capital (K), labor (L), energy (E), materials (M), and purchased business services inputs (S). These are often referred to as the KLEMS inputs. The most recent data for the U.S. private business, private nonfarm
business, and manufacturing sectors, including 20 2-digit SIC manufacturing industries, is available in the Multifactor Productivity Trends (Bureau of Labor Statistics, 2006) news release.
The industry multifactor productivity measures are constructed in a manner similar to the manufacturing sector series, by calculating the ratio of an output index to an input index comprised of a weighted average of employee hours, capital services, and intermediate purchases (including materials and supplies, energy, and purchased services). Inputs are weighted together using cost weights representing each input's share of total output to
measures relate output to a combination of several categories of inputs, they still reflect the impact of many other influences such as economies of scale, capacity utilization, and skill and effort of the work force as well as technological change. Multifactor productivity measures can be thought of as labor productivity measures adjusted to remove the effects of changes in capital per hour and intermediate purchases per hour.
A change in labor productivity reflects the change in output that cannot be accounted for by the change in hours worked of all persons. Labor productivity or output per hour differs from major sector multifactor productivity in its treatment of capital and labor inputs. Labor productivity measures do not explicitly account for the effects of capital or shifts in the composition of labor. Labor productivity, then, reflects all of the effects that influence multifactor productivity and the effects of changes in the capital available per worker and shifts in the educational attainment and work experience of the work force.
2. Definition of Measures
The multifactor productivity indexes for major sectors measure value-added output per combined unit of labor and capital input in private business and private nonfarm business.
Multifactor productivity indexes for aggregate manufacturing and for 20 2-digit SIC manufacturing industries measure sector output per combined unit of capital (K), labor (L), energy (E), materials (M), and purchased business services (S) inputs. These are often referred to as KLEMS inputs. Output is the deflated value of production, adjusted for
inventory change, shipped to purchasers outside of the industry and not just final users. This is a sectoral measure of output and differs from the output measures used for the major sector multifactor productivity measures.
3. Recommended Uses for Bureau of Labor Statistics Data
• Economic indicator of technical progress and unit factor costs.
• Basis for research on the sources of productivity advance and the identification of policy options which can affect the pace of productivity change.
• Aid in understanding trends in output per hour of all persons.
• Provides a more comprehensive productivity measure, supplementing existing economic indicators, that incorporates capital in addition to labor inputs.
• Measures of multifactor productivity are useful for analyzing trends in total costs and overall efficiency, and for studying the effects on labor productivity of changes in capital relative to labor and intermediate purchases relative to labor. Multifactor measures are also useful for studying the utilization of the nonlabor inputs - capital and intermediate purchases - over time.
4. Glossary of Productivity Output and Input Variables
Output data are based on series prepared as part of the National Income and Product Accounts by the Bureau of Economic Analysis, U.S. Department of Commerce.
In manufacturing, a sectoral output measure, defined as shipments from producers to all purchasers including other producers (except producers within the same industry) plus inventory change, is used. This reflects the increase in output due to the application of capital and labor and intermediate inputs. The primary distinction between the sectoral output measure used by BLS and a more general "gross output" measure is that the BLS sectoral output measure excludes shipments within the same industry. So, BLS measures total manufacturing output as the deflated value of shipments outside of the manufacturing industry.
For the private business and private nonfarm business sectors as a whole, intermediate inputs are an extremely small part of the input structure. As such, they can be considered
insignificant to the analysis of productivity growth. This is not true for manufacturing. Examples of the importance of intermediate inputs in manufacturing include the rapid increase in energy prices in the 1970s and the increased use of business services, such as equipment leasing and computer services, all of which have affected productivity
a)
Value-Added Output
Value-added output is defined as gross output (sales or receipts and other income, plus inventory change) minus intermediate inputs (goods and service inputs purchased from other domestic industries and foreign sources). This is also termed gross product originating, and represents the value that is added by the application of capital and labor to intermediate inputs in converting those inputs to finished products. Further information on this concept of output is available in Measurement of Productivity Growth in U.S. Manufacturing, by William Gullickson, Monthly Labor Review, July 1995, pp. 13-28.
b)
Sectoral Output
Sectoral output is defined as gross output excluding intra-industry transactions. This measure defines output as deliveries to consumers outside the sector, in an effort to avoid the problem of double-counting that occurs when one establishment provides materials used by other establishments in the same industry. Further information on this concept of output is available in Measurement of Productivity Growth in U.S. Manufacturing, by William Gullickson, Monthly Labor Review, July 1995, pp. 13-28.
c)
Tornqvist Index
The Tornqvist index is a discrete approximation to a continuous Divisia index. A Divisia index is a weighted sum of the growth rates of the various components, where the weights are the component's shares in total value. When a Tornqvist index is used as an
d)
Labor Input
Hours and employment data are primarily drawn from the BLS Current Employment Statistics (CES) program, which provides monthly survey data on total employment and average weekly hours of production and non-supervisory workers in nonagricultural establishments. Jobs rather than persons are counted. Weekly paid hours are adjusted to hours at work using data from the National Compensation Survey (NCS). The BLS Hours at Work Survey (Bureau of Labor Statistics, 2001), conducted for this purpose, was used for years prior to 2001. The Office of Productivity and Technology estimates average weekly hours at work for non-production and supervisory workers using information from the Current Population Survey (CPS), the CES, and the NCS.
Labor composition data are largely based on household surveys and the decennial census. For all industries or sectors other than private business and private nonfarm business, labor input is identical to total hours at work and does not reflect changes in labor composition.
e)
Capital Input
Capital data are based on measures of equipment and structures, land, and inventories prepared by the Bureau of Labor Statistics from data of the Bureau of Economic Analysis and U.S. Department of Agriculture.
f)
Energy Input
Measures of energy input are constructed using data on price and quantity from the Commerce Department's Census of Manufactures and Annual Survey of Manufactures, together with appropriate BLS Producer Price Indexes used as price deflators. Data on the quantity and cost of the various fuels purchased for use as heat or power are collected in the Census of Manufactures and the Annual Survey of Manufacturing. Data for the separate energy categories are then Tornqvist-aggregated.
For a more complete discussion, please refer to the article "Multifactor Productivity in U.S. Manufacturing, 1949-83," by William Gullickson and Michael J. Harper, Monthly Labor Review, October 1987, pp. 18-28.
g)
Materials Input
Nonenergy materials input represents all commodity inputs exclusive of fuel (electricity, fuel oil, coal, natural gas, and other miscellaneous fuels) but inclusive of fuel-type inputs used as raw materials in a manufacturing process, such as crude petroleum used by the refining industry. In addition to raw and processed materials, these measures include all incidental commodity inputs such as office supplies, vehicle parts bought for maintenance, and small tools, if these are allowable as current costs for computing business taxes.
For a more complete discussion, please refer to the article "Multifactor Productivity in U.S. Manufacturing, 1949-83," by William Gullickson and Michael J. Harper, Monthly Labor Review, October 1987, pp. 18-28.
h)
Purchased Business Services Input
production as given in the Census of Manufactures or the Annual Survey of Manufactures; and to deflate these current cost estimates. Prices from many service inputs are available from the BLS price program, from the National Income and Product Accounts, or from private sources.
III.
METHODOLOGY
The purpose of this methodology is to outline the approach taken for understanding the role of productivity with respect to each theme from the research objectives: merger, outsourcing, competitiveness.
A.
Overview of All Research Designs
1. Merger & Productivity
The research objective on mergers and productivity is to determine the impact of mergers on traditional productivity measures used on different categories of company resources. The research design was carried out in three separate ways: textile company survey, productivity case study, and profitability analysis. The textile company surveys were used to determine the intended benefits of merger activity in the textile industry, whether these benefits are realized, and how their realization is measured. Afterwards are case studies that focus on specific changes merger activity brought about within company resources and how the productivity of these resources is measured. This area concludes with a profitability analysis of merger activity for selected textile companies to determine which business strategies were more commonly employed for successful textile merger activities. The specific tools are reviewed in the following order:
• Textile Company Survey
• Productivity Case Study • Profitability Analysis
2. Outsourcing & Productivity
data sets, pertaining specifically to the textile industry, through a comparison of productivity measures that include versus productivity measures that exclude outsourced products. The specific tools are reviewed in the following order:
• KLEMS Inputs Analysis
• Dual Output Comparison
3. Competitiveness & Productivity
The research objective on competitiveness and productivity is to determine how conventional productivity measures are still adequate to represent the competitiveness of the industry. The research design was carried out in two ways: core concepts questionnaire and scale tools. The core concepts questionnaire was used to gain a qualitative understanding of the underlying reasons motivating how each company defines productivity and competitiveness. The scale tools were used to quantify the data and generalize the results of resource category
productivity’s contribution to competitiveness as well as to quantify where the industry’s strengths lie with respect to other countries. The specific tools are reviewed in the following order:
• Core Concept Questionnaire
B.
Merger and Productivity Research Design
In order to develop the research design for the merger and productivity research objective, the prior work done on this topic was taken in consideration in order to target voids in the literature. Research done thus far on the impact of mergers on productivity comes from two basic types of large samples studies: event studies and performance studies. However, event studies do not examine whether the anticipated value creation or improved productivity materializes; the performance studies fail to find consistent evidence of improved
performance or productivity gains. There are three main areas where the literature on the effect of mergers on productivity is lacking, and as such, this study investigation focused on these points with respect to the textile industry: the drive for merger success or failure, whether the anticipated value creation or improved productivity materializes, and evidence of improved performance or productivity gains.
The questionnaire format used for the interview process was composed of two parts: textile company survey and the productivity case study. The profitability analysis was conducted using publicly available information from annual reports and government databases.
1. Textile Company Survey
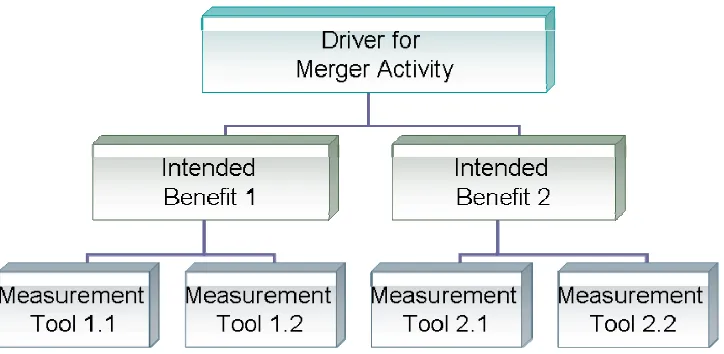
Figure 2. Question Flow for Part 1: Textile Company Survey
This methodology was open-ended in that it allowed the respondents to bring up issues they were facing without giving them limitations as to what types of issues, benefits, or tools to focus on, which in turn allows me to determine productivity’s importance with respect to merger activity because either the respondents will bring up productivity on their own (thus proving that productivity does play an important role in merger activity) or not bring up productivity at all (indicating that productivity does not play an important role in merger activity).
In addition, by following this questionnaire flow I was able to determine if productivity (as a benefit) and productivity measurement (as a measurement tool) are important factors in the merger decision making process and the evaluation of merger integration for the US textile industry.
2. Productivity Case Study
The second part of the questionnaire is called Part 2: Productivity Case Study and the flow of the questions are displayed in Figure 3. The first question involved finding out what changes were happening to each resource category due to merger activity. For each change given, the respondent was then asked how productivity measures were used to capture that change and if not productivity, how was it measured. Then for each measurement tool given, the
Figure 3. Question Flow for Part 2: Productivity Case Study
This questionnaire flow was repeated for each of the five input resources available to firms according to Porter’s Diamond: human, physical, knowledge, capital, and infrastructure resources. By following this questionnaire flow I was able to determine the impact of merger activity on each of the five company resource categories. Unlike Part 1, the questions in this section focused on productivity as the topic of interest, in that respondents were asked to focus their responses to changes, measures, and inferences in terms of productivity. Doing so allowed me to focus questions on productivity specifically for each resource category in order to determine both how resources are changing after merger activity as well as what types of productivity measures are best used to monitor that change.
3. Profitability Analysis
There were two areas of interest to investigate with respect to the profitability analysis portion of this study. The first area of interest was to determine the leading strategies for successful mergers in the textile industry; success based on profitability. The next area of interest was to extrapolate information from publicly available data with respect to how the companies executed these strategies or measured their progression towards achieving these strategies.
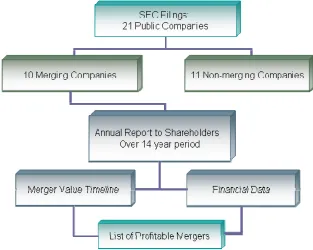
The process flow for carrying out part one of this profitability analysis is displayed in Figure 4. The first step in carrying out this profitability analysis was to search the securities
exchange commission website for merger filings for all 21 public textile industrial
(NAICS) codes 313 and 314, textile mills and textile product mills, respectively. Of the 21 only 10 had been involved in merger activity during 1992-2005 time period. Of these 10 companies, their annual reports for each year over a 14 year period (1992-2005) of the sections titled “Notes to Financial Data: Mergers & Acquisitions” were reviewed to collec data for two purposes: the creation of a merger value timeline and to collect financial data to determine profitability. The merger value timeline for each company is comprised of a list of the date of the merger activity, the dollar value of the merger activity, and a description of the merger transaction. The consolidated financial statements were also reviewed for these companies for the 14 year period in order to record financial data including: cost of goods sold (COGS), interest, selling, general and administrative expense (SGA), net profit, operating profit, gross profit, sales, equity, and assets. From the merger value timeline the financial data, I was able to filter the long list of merger activities of these companies in a list of those that were of highest value and that were profitable.
t
10
and to
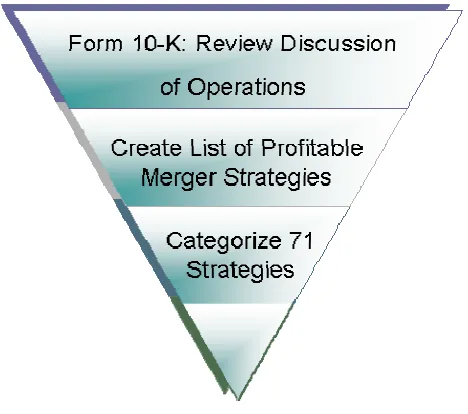
The process flow for c displayed in Figure
ere
Figure 4. Process Flow for Part 1: Profitability Analysis
arrying out part two of this profitability analysis is
activities. From these 16 mergers, the strategies that the management discussed in their Form 10-K were record to create a list of profitable merger strategies, or strategies employed during profitable merger activity. For the 16 profitable merger activities, there were 71 strategic activities recorded that were attributed to the resulting profitability of the comp These 71 strategies were then categorized in to similar groups which resulted in nine main categories. I then used a histogram to illustrate the most prominent category of business strategies employed during merger activity in the textile industry.
any.
C.
Outsourcing and Productivity Research Design
Being that productivity has been increasing for the textile industry while outsourcing has also increased in popularity, there is speculation that productivity in the US textile industry may be increasing because of the increase in outsourcing. Two approaches were developed in order to determine if outsourcing has an impact on the increase in productivity of the US textile industry. The first approach involved resource growth contributions, or input
deepenings, while the second approached involved two different types of output measures, or dual output comparisons.
1. KLEMS Inputs Analysis
The capital, labor, energy, materials, and business services (KLEMS) inputs analysis was an approach developed based on a prior study the Bureau of Labor Statistics performed for the manufacturing industry. In an effort to illustrate this approach I needed to use an example and display the equations which are presented in Figure 6.
Figure 6. KLEMS Inputs Equations
causing labor productivity to appear to increase, as illustrated under the Results header. In reality what is happening is that the cost of making the product is decreasing labor cost but increasing in another area as can be seen in the example with a typical multifactor
productivity measure that looks at all five areas; the labor cost is decreasing but material cost (purchase of the outsourced input) is increasing. However by using this multifactor
productivity measure in my analysis, the result would only show a marginal change and not allow for an investigation of the impact of increased outsourcing within each of the
resources.
The objective of this analysis is to determine if the increase in outsourcing is causing the increase in labor productivity for the textile industry. In this approach the Tornqvist
multifactor productivity measure and input deepenings are used to isolate the growth (input deepening) of each of the resources. Tornqvist multifactor productivity equation takes into account the effect of changes in other resource categories by subtracting their contribution altogether. What remains from this Tornqvist multifactor productivity is the change in output that cannot be accounted for by the change in combined inputs. Input deepening is resource growth contribution or, the contribution of shifts in the mix of inputs and form the pieces to the Tornqvist formula.
This KLEMS Input Analysis examines the Tornqvist multifactor productivity and each input deepening’s relationship to labor productivity. Being that Tornqvist multifactor productivity takes into account the effect of resource shifts to productivity, by subtracting their
2. Dual Output Comparison
The next approach used in the outsourcing and productivity research design is called the Dual Output Comparison and was developed based on a prior study the Bureau of Labor Statistics performed for the manufacturing industry. The approach involves two different types of output to determine the impact of outsourcing on productivity: sectoral output per hour and value-added output per hour. Sectoral output per hour is the real value of shipments leaving an industry, including the value of intermediate inputs, divided by hours at work. Value-added output per hour is sectoral output less the real value of intermediate inputs per hour at work. Outsourced products are included within the intermediate inputs. Within this
D.
Competitiveness and Productivity Research Design
1. Core Concepts Questionnaire
The core concepts questionnaire is a series of questions created for the purpose of
understanding how the literature on productivity is absorbed in real applications, as well as how textile companies define and measure competitiveness. The reviewed literature in this study details many ways that productivity affects company operations however, in order to discern what is relevant specifically to the textile industry, respondents were asked to explain what the core concepts of this study, productivity and competitiveness, meant at their
company. This involved wording questions using the indirect technique. The indirect technique involves wording questions in such a manner that the respondent is not limited by the topic of research interest. Thus the first questions on each core concept involved asking respondents what productivity, and then what competitiveness, means at their company. By wording the question as such, the respondent will not feel that there is a wrong or right answer. Each core concept was followed with a question inquiring as to how overall productivity and competitiveness are measured at their company.
2. Scale Tools
The scale tools used in this study were created for the purpose of understanding the relationship between productivity and competitiveness. The constant sum scale is used to understand the relationship of resource category productivity’s contribution to
E.
Questionnaire Development Process
The strength of interviewing industry professionals is that the specific problem of the study could be addressed. However, due to the very involved nature of collecting primary data of this nature, the process of obtaining data can be expensive and time consuming so careful planning was critical.
In order to bring together all survey tools used in the research designs into one
comprehensive questionnaire, Malhotra’s Questionnaire and Form Design (Malhotra, 2004) outline was followed for this study. The outline included the following steps:
• Specify information needed
• Specify the type of interviewing method • Determine the content of individual questions
• Design the questions to overcome the respondent’s inability to answer • Decide on question structure
• Determine question wording
• Arrange the questions in proper order • Identify the form and layout
• Reproduce the questionnaire • Eliminate bugs by pretesting
While some of the steps are self-explanatory, the critical steps are expanded upon in the following sections in order to clarify how the procedure was executed. The critical steps are covered as follows: specify type of interview method, determine the content of individual questions, decide on question structure, and arrange questions in proper order.
1. Specify the type of interviewing method
Table 1. Comparative Evaluation of Survey Methods (Malhotra, 2004)
Criteria Telephone Interviewing In-Office Interviewing
Flexibility of data collection Moderate to high High
Diversity of questions Low High
Use of physical stimuli Low Moderate to high
Sample control Moderate to high Potentially high
Control of data collection environment Moderate Moderate to high
Control of field force Moderate Low
Quantity of data Low High
Response rate Moderate High
Perceived anonymity of the respondent Moderate Low
Social desirability Moderate High
Obtaining sensitive information High Low
Potential for interviewer bias Moderate High
Speed High Moderate
Cost Moderate High
2. Determine the content of individual questions
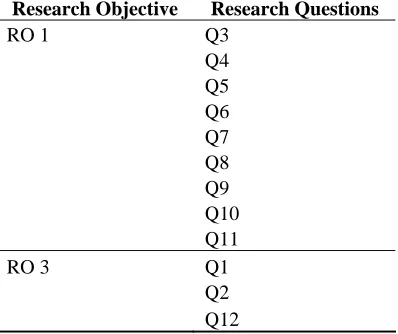
A long series of questions was brainstormed that had to do with a variety of topics that could be addressed for this study. The questions were then narrowed down by their relevance to research objectives. Afterwards questions were eliminated that seemed repetitive while others were eliminated because of their general nature. The results of how the questions match up can be seen in Table 2 whereas the actual list of questions can be found in Appendix A4: Respondent’s List of Questions.
Table 2. Connecting Research Questions to Research Objectives Research Objective Research Questions
RO 1 Q3
Q4 Q5 Q6 Q7 Q8 Q9 Q10
Q11
RO 3 Q1
Q2
3. Decide on question structure
The structured question formats chosen are both comparative and noncomparative and included the following scales: likert, stapel and constant sum. Each type of scale has its own advantages and disadvantages as illustrated in Table 3.
Noncomparative scaling, such as likert and stapel scales, will allow for an analysis of the effect of merger activities on the productivity of each individual resource category. The comparative scaling, specifically the constant sum scale, allows for the direct comparison of how each resource category contributes to overall company competitiveness, as well as understanding the value each resource category has relative to each other.
Table 3. Advantages and Disadvantages of Scales
Scale Basic Characteristics Advantages Disadvantages
Likert Scale
Degree of agreement on a strongly disagree to strongly agree scale
Easy to construct, administer and understand
More time consuming
Stapel Scale
Unipolar ten-point scale, -5 to +5 without a neutral point (zero).
Easy to construct; can be administered over phone
Confusing and difficult to apply
Constant Sum Scale
Allocate a constant sum of units among a set of stimulus objects with respect to some criterion.
Allows for fine discrimination among stimulus objects without requiring much time.
Potential for incomplete allocation of chips.
4. Arrange the questions in proper order
Opening questions of the survey were simple and non-threatening in that they inquired about the respondents’ opinions on the general subject at hand: productivity and competitiveness. Following were questions looking into the issue at an industry level and then proceeding at the company level. The more specific and complex questions that had to do with each
F.
Sample Selection Process
In order to collect meaningful data I had to develop a targeted list of companies to participate in this study. Taking into account the large number of firms in the textile industry, limits are needed in order to have a manageable yet significant group. The limits chosen are quite simple and can be divided into the following: event, timeframe, location, stockholder status. Afterwards a structured plan was developed in order to schedule interviews. The final list of targeted companies for this study is available in Appendix B1: Sample of Targeted
Companies.
1. Defining Sample Limits
The first limit is called “event.” The event limit states that the targeted company must be one that has had a merger. This limit was chosen because the focus of this study is on
productivity related to this type of event. In order to filter which companies in the textile industry have engaged in this type of event, public news releases were sought from various online search engines.
The second limit is called “timeframe.” The timeframe limit states that the targeted company must have had its merger event within the past 14 years. This limit was chosen in order to focus data collection efforts towards companies who are more likely to have the
management, who took part in decision making process of the event, still around. In
addition, the oldest 10-K forms obtainable from the EDGAR system go only 14 years into the past.
The third limit is called “location.” The location limit states that the targeted company must be one whose headquarters is located in the Eastern United States. This limit was chosen due to budget constraints. It would be more realistic to accommodate multiple travel
The final limit is called “stockholder status” and was used more as a preference than an actual limit. The stockholder status limit states that the targeted company must be a public, not private one. This limit was chosen because profitability data needed for this study is more feasible to attain from companies who already release that data through annual reports, as is the case for public companies. The stockholder status for each company was found using the finance.yahoo.com website where one can separate searches for financial companies by public and private. All public companies were given priority. The final list of the companies selected for the sample in this study is available in Appendix B1: Sample of Targeted Companies.
2. Interview Scheduling Process
The contact information for the companies in the sample was sought through various
resources: my advisory committee, local college professors, my network of industry leaders, and online resources.
For the most part, initial contact with the companies involved calling receptionist in order to secure an individual who could direct me in the right direction as far as who I could
interview within the company. Before any calls were made a general script was drafted in order to clearly and concisely explains my research. The script is available in Appendix B2: General Phone Script Explaining Research.
Requesting to speak with the human resources department resulted in more success in securing an individual who was knowledgeable with company history and its people, than securing an individual through the receptionists.
Once a contact was secured a default email was sent out in order to explain the nature of my research and what type of assistance was requested of participants. The email is available in Appendix B3: General Email Explaining Research. It also delineated the time frame
G.
Overview of Data Sources
There are a variety of databases available that provide numerous types of productivity and profitability measures. The databases used in this study were found through journal articles and published research studies that sought to justify that the problem existed and delineated the resources used to approach the situation. These business and government sources served to better define the problem with respect to the aggregate (entire textile industry), and the measures in computerized databases provided a basis to interpret industry interview responses more insightfully.
The strength of using these databases is that these resources are easily accessible through the university library website. Also, these resources can be located quickly and inexpensively. Once a database is found for a particular measure, the most significant obstacle is finding that measure in terms of the industry and company levels needed among the wealth of
information the database returns, as well as obtaining it for the same series of years.
Specifications of information needed are explained in the following categories: types of productivity measures, types of profitability measures, and historical data of the US textile industry.
1. Sources of Productivity Data
Industry level data on productivity was accessed through the online database available from the website of the Bureau of Labor Statistics. There are two main types of productivity inputs which are: single factor and multifactor. There were also two types of output used in this study: sectoral and value added. What follows is a description of the measures chosen for this study, the specific descriptions of which are provided in the literature review.
The tornqvist multifactor productivity was chosen for this study. Tornqvist multifactor productivity measures reflect the joint effects of many factors including research and
development (R&D), new technologies, economies of scale, managerial skill, and changes in the organization of production (Bureau of Labor Statistics, ).
There are also two types of output measures used for the chosen productivity measures: sectoral output and value-added output. Sectoral output is the real value of shipments leaving an industry (including the value of intermediate inputs) whereas value-added output is sectoral output less the real value of intermediate inputs.
2. Sources of Profitability Data
A common way to evaluate the competitiveness of a company is through profitability. The question then becomes which type of profitability measure should be used. What follows is a description of the measures chosen for this study.
The profit measures from the Securities and Exchange Commission include: net profit, operating profit, and gross profit. The first profit measure chosen is net profit. Net profit, as it relates to this study, is calculated by subtracting a company's total expenses from total
revenue. The second profit measure chosen is operating profit. Operating profit, as it relates to this study, is equal to earnings before the deduction of interest payments and income taxes and is also called EBIT (sales-[COGS+SGA]). The final profit measure chosen is gross profit. Gross profit, as it relates to this study, is defined as total revenue minus cost of goods sold (sales-COGS). In addition, the following financial data was obtained from these 10-K forms as well: selling, general and administrative cost (SGA), interest, cost of goods sold, assets, sales, and equity.
3. Sources of State of the US Textile Industry Data
There are many websites that provide historical data of industries as a whole. In order to support or disprove the trends reported by industry leaders it is necessary to collect relevant data about the state of the US textile industry. In order to address all areas of this study, historical data is needed for the following: