20th International Conference on Structural Mechanics in Reactor Technology (SMiRT 20) Espoo, Finland, August 9-14, 2009 SMiRT 20-Division 7, Paper 2597
1
PROSIR and LWR Reactor Vessel Safety Margins
Claude Faidy
a, Alejandro Huerta
ba
EDF-SEPTEN Villeurbanne, France, e-mail: claude.faidy@edf.fr b
OECD-NEA Paris, France, e-mail: alejandro.huerta@oecd.org
Keywords: Structural Integrity, LWR, Reactor Pressure Vessel, probabilistic analysis
1 ABSTRACT
In the framework of OCDE/ NEA, a group is in charge of studies and information exchanges on ageing of nuclear power plant components.
One of the key issue of ageing of nuclear power plants is the radiation effect on the reactor pressure vessel that leads to material embrittlement and can reduce the safety margins in case of pressurized thermal shock .
The analysis of these pressurized thermal shocks needs a large number of data with their uncertainties: transients, material properties and flaw distribution.
Consequently, the deterministic approach is too much conservative and probabilistic are used or under development in many countries (USA, Japan, France and Korea).
Following an OCDE round robin proposal, 9 countries (USA, Japan, Korea, Sweden, Germany, Czech Republic, Spain, EC and France) are now involved in the round robin defined in 2 phases: deterministic approach and probabilistic approach
This paper presents the major hypothesis and results of the probabilistic phase of the PROSIR project. Consequences on safety margin and possible extensions or complementary needs are shortly discussed in the paper.
2 INTRODUCTION
PWR [1] is based on a probabilistic fracture mechanic approach. In the other hand, if a plant is supposed to over-pass the screening criteria the Regulatory Guide RG 1.154 [2] define the requirements based on a justification through a probabilistic approach.
The objective of these Round Robins (RRs) is to issue some recommendation of best practices in this area and to assure an understanding of the key parameters of this type of approach, like transient description and frequency, material properties, defect type and distribution, fracture mechanic methodology… An other possible result will be to identify the consequences of different parameter uncertainties on the probability of failure of a RPV.
It's a complementary step to FALSIRE [3] and ICAS [4] program on RPV integrity.
A general description of RPV Probabilistic Fracture Mechanic scheme with all the basic data for the different Round Robin’s are presented.
A pre-requisite set of deterministic approaches has been proposed and discussed with the different partners before moving to probabilistic approaches. Different sensitivity studies around the base case (longitudinal weld) has been done and discussed during working meetings.
Conclusions and final recommendations are presented and discussed.
3 PROBLEM
DEFINITION
The next table precise the major common data for the different Round Robin.
If no distribution law are specified in the text, use normal distribution (standard deviation: SD)
RPV geometry PWR 3-loop type inner surface radius: 1994mm
cladding thickness: 7.5mm
base metal thickness: 200mm outer surface radius : 2201.5mm
Thermal See table 1
Tensile- Stress-strain curves See tables 2-a and 2-b
Toughness :
- KIC versus temperature
- KIa versus temperature
See table 3
Properties of base metal, weld and cladding
Chemical composition See table 4
Fluence on the inner surface in n/m2 Y= year
1Y=1.1023, 10Y=3. 1023, 20Y=5. 1023, 40Y=7.5. 1023, 60Y=10. 1023
2SD value: 20%
Irradiation shift formula See table 5
Irradiation decrease through the RPV wall F = F0 e-0.125x
for 0<x<0.75t and x in 10-2m
Irradiation effects
Irradiated tensile properties - effect is not considered
Orientation: longitudinal or circumferential longitudinal in the base case see table 9
Location: surface, underclad or embedded surface / underclad crack see table 9
Size: depth and length Shape
12mm depth x 72mm length for elliptical underclad crack (model 3)
19.5mm depth x 117mm length for semi-elliptical through clad crack (model 2)
see table 9
Defect
Size distribution Density
Marshall/ PNNL distribution See appendix 1
1 crack is considered
Transient loads Tr1: SBLOCA
Tr2: SLB
Tr3: PTS (with re-pressurisation)
pressure, temperature and heat exchange coefficient versus time
see table 6, 7 and 8
Other loads residual stresses not considered in the base case
nevertheless, the free stress temperature of the vessel is: 300°C
no consideration of hydroproof test
Fracture mechanic model elastic K evaluation compare to KIC or KIa for
the corresponding crack tip temperature and irradiation level
3
If no distribution law are specified in the text, use normal distribution (standard deviation SD)
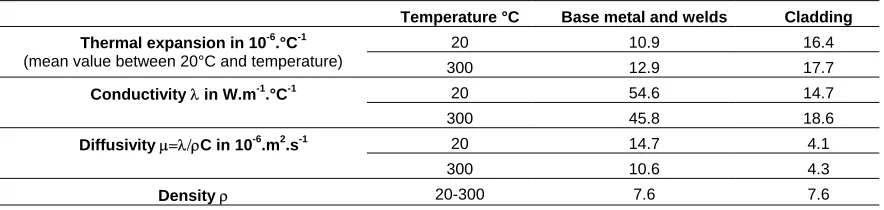
Table 1. Thermal material properties.
Temperature °C Base metal and welds Cladding
20 10.9 16.4
Thermal expansion in 10-6.°C-1
(mean value between 20°C and temperature) 300 12.9 17.7
20 54.6 14.7
Conductivity λ in W.m-1.°C-1
300 45.8 18.6
20 14.7 4.1
Diffusivity µ=λ/ρC in 10-6.m2.s-1
300 10.6 4.3
Density ρ 20-300 7.6 7.6
Table 2-a. Mechanical material properties – General.
Unit : MPa
Temperature °C Base metal 2 SD for Base metal
Welds 2SD for Welds
Cladding
20 588 60 646 80 380
Yield strength: Sy
(Rp0.002) 300 517 60 563 80 270
20 204000 10000 204000 10000 197000
Young modulus:
E 300 185000 10000 185000 10000 176500
ν 20 - 300 0.3 - 0.3 - 0.3
Table 2-b. Mechanical material properties – Stress-strain curves.
Total strain ε 0.01 0.02 0.03 0.04 0.05 0.06 0.07 0.08 0.09 0.10
20°C 1.02 1.11 1.19 1.25 1.29 1.33 1.36 1.38 1.40 1.42
σ/Sy for base
metal 300°C 1.11 1.21 1.28 1.33 1.37 1.41 1.43 1.45 1.47
20°C 1.00 1.05 1.10 1.15 1.19 1.22 1.24 1.26 1.28 1.29
σ/Sy for weld
300°C 1.07 1.15 1.21 1.26 1.30 1.34 1.36 1.39 1.41 1.43
20°C 1.06 1.10 1.13 1.16 1.19 1.22 1.25 1.27 1.30 1.32
σ/Sy for
cladding 300°C 1.07 1.11 1.14 1.17 1.20 1.23 1.26 1.29 1.31 1.34
Table 3. Toughness curve and uncertainties for un-irradiated weld and base metal
Crack initiation
KIC = 36.5 + 3.1 exp[0,036 (T-RTNDT + 55.5)]
KICmax= 220 MPa.m0.5
Mean values - 2 standard deviation (SD) = ASME curves
- KIa has to remain lower or equal than KIC
- KIa has to remain greater than 0.
Crack arrest KIa = 29.4 + 1.4 exp[0,026 (T-RTNDT + 88.9)]
KIamax= 220 MPa.m0.5
Crack initiation
On KIC 15%
On KICmax = 15 MPa.m0.5
1 SD
Crack arrest On KIa 10%
On KIamax = 15 MPa.m0.5
KIC and KIa normal distribution truncated between +3SD and –3SD
Table 4. Chemical composition and initial RTNDT
Initial RTNDT 1 SD
uncertainties
% copper (Cu) 2SD
uncertainties
Base metal -20°C 9°C 0.086 0.02
Welds -30°C 16°C 0.120 0.02
% phosphorus (P) 2 SD
uncertainties
% nickel (Ni) 2 SD
uncertainties
Base metal 0.0137 0.002 0.72 0.1
Welds 0.0180 0.002 0.17 0.1
mean ∆RTNDT = [17.3+1537*(P-0.008)+238*(Cu-0.08)+191*Ni2Cu]*ϕ0.35
Base metal
1SD 10°C
mean ∆RTNDT = [18+823*(P-0.008)+148*(Cu-0.08)+157*Ni2Cu]*ϕ0.45
Weld
1SD 6°C
∆RTNDT normal distribution truncated between +3SD and –3SD
ϕ: fluence in n/m2 divided by 1023; P, Cu, Ni % of phosphorus, copper and nickel
Table 6. Tr1 transient description (typical SBLOCA)
Time in second Pressure in MPa Fluid temperature Heat Exchange coefficient in W/m2.°C
0 15.5 286 174000
50 11.8 283 174000
100 8 280 43600
300 7 266 21200
520 6.4 250 2700
600 5.5 227 3200
700 5 202 3200
740 4.8 192 3200
800 4.5 170 3200
1000 3.5 114 3000
1300 2 64 2500
1800 2 27 1900
2800 2 10 1400
3800 2 7 1200
4800 2 7 1000
6300 2 7 800
Table 7. Tr2 transient description (typical SLB)
Time in second Pressure in MPa Fluid temperature Heat Exchange coefficient in W/m2.°C
0 15.5 286 60000
50 10.9 226 60000
125 4 200 60000
240 3.6 178 60000
300 3.7 171 60000
310 3.7 170 3100
340 3.8 166 3100
480 4 112 2500
670 5.6 90 2300
720 6 90 2300
960 11 90 2300
1180 16.8 90 2300
7200 16.8 90 2300
5
Table 8. Toughness curve and uncertainties for un-irradiated weld and base metal
Time in second Pressure in MPa Fluid temperature Heat Exchange coefficient in W/m2.°C
0 15,3 295 24125
45 7,8 287 24696
165 7,0 276 3453
255 7,3 279 1054
300 5,7 268 6232
375 5,5 261 1757
615 5,1 251 4834
1515 4,0 206 1581
2865 2,9 152 1838
4695 2,0 59 1147
6015 1,5 37 992
7125 2,5 48 877
7185 16,8 49 790
8970 17,1 69 602
13290 17,0 96 710
14025 17,1 106 1229
14985 17,1 115 1057
Table 9. Locations and shapes of defects
Model 1: - base metal surface defect - a = 12mm ; 2l = 72mm
- cladding only considered for crack tip temperature and fluence evaluation, not for stress and K computation
Model 2: - surface breaking crack; a’=19.5mm - a’ = 19.5mm ; 2l = 117mm
Model 3: - underclad crack - a = 6mm ; l = 36mm
4 PHASE 1 – DEFINITION AND DETERMINISTIC RESULTS
A deterministic approach based of mean value of each random parameters has been done as a pre-requisite to assure a perfect fitting at this level of all interesting participants. The crack will be located in a longitudinal weld, 2 types of cracks will be considered surface and underclad cracks.
The list of round robin considered are :
- PR1: Crack initiation of surface crack in RP
- PR2: Crack arrest of an initial surface crack
All the detailed information and phase 1 results are presented in reference [5].
5 PHASE 2 PROBABILISTIC RESULTS
The list of round robin considered are :
- RR1 : Toughness property distribution versus aging
- RR2: Probability of crack initiation versus time for a given transient
* RR2-a : Surface crack initiation versus time for a given transients
* RR2-b : Probability of underclad crack initiation versus time for a given transient
- RR3: probability of arrest of a surface crack for 2 given transients
- RR4: probability of crack initiation for 1 crack in a crack size distribution
- RR5 : Parametric studies
All the detailed data are presented in reference [5].
The phase 2 results are :
- for RTNDT estimation (figures 1and 2):
very good agreement for toughness uncertainties propagation with vessel age (10, 20, 40, 60 years) : les than few degree on RTNDT
no major influence of the fluence uncertainties on RTNDT estimation, with this set of data
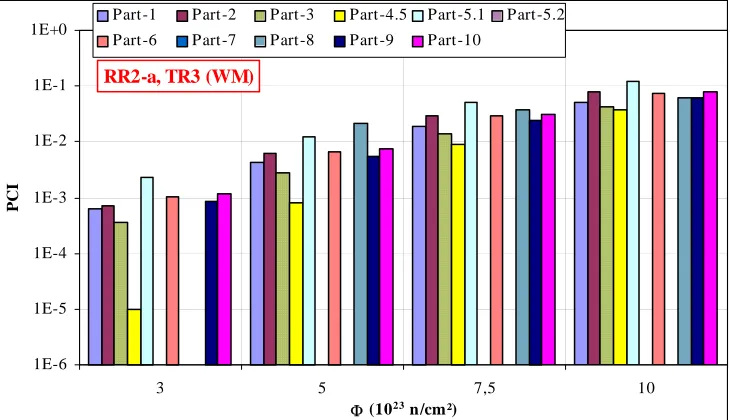
- for probability of crack initiation (PCI) for 1 defect:
less than 1 decade on PCI for surface crack (SC) including all the differences in participant models (figure 3)
around 2 decade in PCI for underclad cracks (UCC) due to criteria : with / without plasticity effects (figure 4)
- for probability of crack initiation (PCI) for a flaw distribution (figures 5,6 and 7):
larger scatter in the results : up to 3 decades difference
different uses of the flaw distribution due to un-precise data definition : some use the flaw distribution from the inner surface of the vessel, some use it from the clad-base metal interface and only cracks in base metal the probabilistic fracture mechanic tool has to be validated and some open questions have to be discussed in the definition of crack initiation of one crack through a crack distribution
6 CONCLUSIONS
In order to perform a probabilistic evaluation of thermal shock, very precise data and method definitions are needed with associated validation.
For similar data and similar methods the results can be different through different partners; after consideration of thermo-mechanical stresses, K estimation scheme and corresponding criteria (plasticity effects, crack arrest, WPS…), explanation have been done for the major differences, except for PCI for flaw distribution.
7
The need of determinist approaches based on mean value of each parameters is a key issue to compare probabilistic methods and to analyze the results. The link between deterministic sensitivity studies and different probabilistic analysis is essential. Intermediate validation of the PFM analysis is important for verification of the result validity. The brittle rupture model and uncertainty effects cannot be analyzed globally, but it will be better to look at them separately. Crack arrest has not been cover in detail in this part of work, but will be done in a complementary program.
Acknowledgements.
The authors have to thank all the associated partners : A. BLAHOIANU CSNC - IAGE WG chairman CSNC Canada - IAGE WG chairman, M. KIRK USNRC and T. DICKSON ORNL USA, V. PISTORA NRI Czech Republic, S. CHAPULIOT and M. MARQUEZ CEA France, P.DILLSTROM INSPECTA Sweden, S. BLASSET AREVA_Gmbh Germany, L. GANDOSSI JRC Petten EC, M. MORALES TECNATOM Spain, M. SUZUKI and K. ONAZAWA JAEA Japan and Y.H. CHOI & partners KINS Korea.
REFERENCES
[1] USNRC- 10CFR50-61 : "Fracture toughness requirements for protection against pressurized thermal shock events"
[2] RG 1. 174 "An Approach for Using Probabilistic Risk Assessment in Risk-Informed Decisions on Plant-Specific Changes to the Licensing Basis", Revision 1 November 2002
[3] FALSIRE : CSNI project for Fracture Analyses of Large- Scale International Reference Experiments, 1996
[4] ICAS : Comparison Report of RPV Pressurised Thermal Shock International Comparative Assessment Study - PTS ICAS
[5] C. Faidy, E. Mathet, " PROSIR round robin : Probabilistic Structural Integrity of a PWR Reactor Pressure Vessel", 18th International Conference on Structural Mechanics in Reactor Technology, SMiRT 18, paper M02-1, Beijing, China, August 2005
0 10 20 30 40 50 60 70
3 5 7,5 10
Φ (1023 n/cm²)
Mean RT
NDT
(°C)
Part-1 Part-2 Part-3 Part-4.5 Part-5.1 Part-5.2
Part-6 Part-7 Part-8 Part-9 Part-10
RR1-a (BM)
0 10 20 30 40 50 60 70
3 5 7,5 10
Φ (1023 n/cm²)
Mean RT
NDT
(°C)
Part-1 Part-2 Part-3 Part-4.5 Part-5.1 Part-5.2
Part-6 Part-7 Part-8 Part-9 Part-10
RR1-a (WM)
Figure 2. RTNDT versus fluence level with uncertainties on initial RTNDT and chemical composition for WM
1E-6 1E-5 1E-4 1E-3 1E-2 1E-1 1E+0
3 5 7,5 10
Φ (1023 n/cm²)
PCI
Part-1 Part-2 Part-3 Part-4.5 Part-5.1 Part-5.2
Part-6 Part-7 Part-8 Part-9 Part-10
RR2-a, TR3 (BM)
9
1E-8 1E-7 1E-6 1E-5 1E-4 1E-3 1E-2 1E-1 1E+0
3 5 7,5 10
Φ (1023 n/cm²)
PCI
Part-1 Part-2 Part-3 Part-4.5 Part-5.1 Part-5.2
Part-6 Part-7 Part-8 Part-9 Part-10
RR2-b, TR3 (BM) - With plastic correction
Figure 4. Probability of crack initiation, for TR3 and 1 underclad crack
1E-8 1E-7 1E-6 1E-5 1E-4 1E-3 1E-2 1E-1 1E+0
3 5 7,5 10
Φ (1023 n/cm²)
PCI
Part-1 Part-2 Part-3 Part-4.5 Part-5.1 Part-5.2 Part-6 Part-7
Part-8 Part-9 Part-10
RR4, TR3 (BM) - Possible initiation in the cladding
1E-7 1E-6 1E-5 1E-4 1E-3 1E-2 1E-1 1E+0
3 5 7,5 10
Φ (1023 n/cm²)
PCI
Part-1 Part-2 Part-3 Part-4.5 Part-5.1 Part-5.2
Part-6 Part-7 Part-8 Part-9 Part-10
RR4, TR3 (BM) - No initiation in the cladding
Figure 6. Probability of crack initiation, for TR3 and a flaw distribution
1E-6 1E-5 1E-4 1E-3 1E-2 1E-1 1E+0
3 5 7,5 10
Φ (1023 n/cm²)
PCI
Part-1 Part-2 Part-3 Part-4.5 Part-5.1 Part-5.2
Part-6 Part-7 Part-8 Part-9 Part-10
RR2-a, TR3 (WM)