Copyright 0 1997 by the Genetics Society of America
Inheritance
and Mapping
of Compact
(
Cmpt)
,
a
New
Mutation Causing
Hypermuscularity
in
Mice
Lhszlo Varga,
*
Gyula Szabo,
*
Ariel
Darvasi,
+JGeza Miiller,
Miklos Sassgand
Moms Sollert
*Institute for Molecular Genetics, Agricultural Biotechnology Center, H-2101 Godollb, Hungary, +Department of Genetics, The Alexander Silberman Life Science Institute, The Hebrew University of Jerusalem, 91 904 Jerusalem, Israel, :Egis Pharmaceuticals Ltd.,
H-1475 Budapest, Hungary and sDepartment of General Zoology, Eotvos University, H - I 0 8 8 Budapest, Hungary
Manuscript received March 14, 1997 Accepted for publication June 25, 1997
ABSTRACT
During selection for protein content in mice at the Technical University of Berlin, individuals showing high protein content and a compact exterior were noted. Animals showing this “Compact” phenotype were separated to form a new line. The present investigations were carried out on a Hungarian subpopula- tion of this line, selected for maximum expression of the Compact phenotype, and apparently at fixation for the relevant genes. Fertility and viability of the Compact subpopulation was normal. As compared to normal mice, carcass percentage values for male and female Compact mice were 9.4 and 6.8% greater, respectively; and the musc1e:bone weight ratio in males was 1.61-fold greater. The Compact phenotype showed variable expressivity and was of intermediate dominance in males, but almost fully recessive in females. The hypothesis that a single gene is solely responsible for the Compact phenotype was rejected by maximum likelihood analysis. Linkage mapping using selective DNA pooling located a single locus (denoted Cmpt) strongly associated with the Compact phenotype on mouse chromosome I . Fine m a p ping, using individual selective genotyping and haplotype analysis, located Cmpt to the region between DlMit375 and D l M i t P l , approximately one third of the way to DlMit21.
H
EAVY muscularity of the entire body is a desiredphenotype in domestic animals bred for meat production. A genetic “double-muscled” phenotype, determined by a partially recessive autosomal major gene ( m h ) was mapped recently to chromosome 2 in Belgian Blue Cattle ( GEORCES 1990; CHARLIER et al. 1995). It is at present unknown whether the mh gene determines the double-muscled phenotype in other cat- tle breeds as well. The callipyge phenotype of sheep, which also results in muscular hypertrophy, is deter- mined by an autosomal gene showing polar overdomi- nance ( CLPG) mapped to chromosome 18 ( COCKETT et al. 1994). These genes do not appear to be homologous ( COCKETT et al. 1994). Transgenic mice (SUTRAVE et al. 1990), pigs ( PURSEL et al. 1992) and a calf ( BOWEN et al. 1994), carrying chicken c-ski cDNA, also show a muscular phenotype. However, muscle degeneration was observed in some pigs and in the calf. Recently, MCPHERRON et al. (1997) reported a muscular pheno- type for knock out mice for the GDF-8 growth
/
differen- tiation factor.We here report on the mode of inheritance and chro- mosomal map location of a mouse mutant designated “Compact” ( C m p t )
.
The Compact phenotype was first noted in a line of mice selected for high body weightCorresponding author: Lkszl6 Varga, Institute for Molecular Genetics, Agricultural Biotechnology Center, P.O. Box 411, H-2101 GdollB,
Hungary. E-mail: [email protected]
‘Present address: The Jackson Laboratory, 600 Main St., Bar Harbor, ME 04609-1500.
and high protein content at the Technical University of Berlin (F. MAJOR and W. SCHLOTE, personal commu- nication). Mice showing the Compact phenotype are much more muscular than the conventional laboratory mouse and appear phenotypically similar to the muscu- lar phenotypes of domestic animals noted above. Ani- mals showing the Compact phenotype were separated from the main selection line and a new COMPACT line, based on these individuals was originated. In this article we focus primarily on the genetics of the mutant, giving only a preliminary characterization of its salient pheno- typic characteristics. A comprehensive description of the mutation will be published elsewhere (F. MAJOR
and W. SCHLOTE, personal communication )
.
MATERIALS AND METHODS
Stocks. HCR (Hungarian randombred compact line): This is a randombred subline of the original German COMPACT line. It was initiated by G.M. in 1989 with five males and seven females (generously provided by W. SCHLOTE) showing strong expression of the Compact phenotype. The HCR sub-
line was perpetuated through random mating of males and females selected as having strong expression of the Compact phenotype.
HCI (Hungarian inbred compact line): Starting from genera- tion 16 of the HCR subline, a brother X sister inbreeding program was initiated by G.M. Single brother X sister mating was carried out for a further 16 generations, to form the HCI line (Figure 1A).
Animals were kept in an animal room with controlled tem- perature (22” ? lo), humidity ( 5 5 ? 10% ) and lighting ( 12 hr light and 12 hr dark). They were fed a proprietary laboratory
756 L. Varg
.
-,.
FIGURE 1.-Mice were classified into five phenotypic cate- gories, ranging from extremely muscular (category C5) to normal phenotype (category C1)
.
(A) Male mice showing the normal phenotype (right) and Compact phenotype (from the HCI inbred subline; left).
( B ) Muscularity of males ( M ) and females ( F ) showing normal (C1 ) and Compact (C5) phenotype ( v e n d view).mouse chow (LATI, Goddlld, Hungary), and supplied with tap water ad libitum.
Characterization of the Compact phenotype: The individu- als of the HCR and HCI lines and their crosses show various degrees of the Compact phenotype. Gradations between the types are smooth and continuous. For descriptive purposes, however, the animals were classified into five phenotypic cate- gories, ranging from extremely muscular (category C5) to normal phenotype (category C1)
.
Animals classified as C5 are characterized by a short but broad body, broad head with short snout and short thick tail. The body, neck and limbs are extremely muscular as compared to a normal mouse. The increased muscularity of the forelegs and the back are espe- cially striking, with particular hypertrophy of biceps and Lon-gissimus dorsi muscles. Detailed quantitative characterization of C2 to C4 categories has not yet been done. (Figure 1B; Note, the truncated tails are not part of the Compact pheno- type; tail tips were taken for DNA extraction).
Carcass percentage was calculated as carcass weight X 100 divided by total body weight, where carcass includes all body parts except for skin, internal organs, head, tail and lower part of the legs. This measure was obtained on 10 Cl and C5 males and 10 C1 and C4 females, taken from among the Cross-2 F2 animals (see later for description of Cross-2). For measuring the mass of individual muscles, six 4 m w l d C5 male mice from the HCI subline, and six 4 m w l d BALB / c
Inheritance and Mapping of Cmpt 757
changed as categories rC1 and rC2, respectively; while catego- ries C3, C4 and C5 were redefined as category rC3.
Under the one gene assumption, three genotypes, provi- sionally denoted CC, Cc and cc, can be present. A priori, we assume the possibility of incomplete penetrance and variable expressivity. This means that an individual of any of the as- sumed genotypes ( CC, Cc or cc) has some probability of being assigned to any of the three redefined Compact categories, but the probability of being assigned to a specific category will depend on the genotype and sex. O n this basis, and assuming Mendelian segregation at the postulated C locus and consis- tent assignment of individuals to Compact categories in the various generations and crosses, we can write the following general expression for the probability, Pk,, within each sex separately, that an individual of cross type k falls into rede- fined Compact phenotypic category rCj
p k j = c q k i p y
where k = 1 , 2 , 3 , 4 for F1, FP, BC:HCR and BC:BALB, respec- tively; j = 1, 2, 3 for rC1, rC2, and rC3, respectively; i = 1, 2, 3 for genotypes cc, Cc and CC, respectively;
p,
is the sex- specific probability that an individual of genotype i falls into redefined Compact phenotypic categoryj, and q k t is the prob- ability that an individual of cross type k has genotype i. The qk, will depend on the frequency P of the postulated C allele in the HCR subline. For reasons detailed in RESULTS, we be- lieve that it is plausible that the later generations of the HCR subline were at fixation for the loci involved in determining Compact phenotype. In this case, the q k l will have the follow-ing values: qll = 0, q14 = 1, qI3 = 0;
*,
= q22 = 1/2, qZ3 =The
p,
were estimated separately for each sex, from the observed distributions of the three redefined Compact catego- ries among the population types by means of a maximum likelihood procedure (MOOD et al. 1974). The likelihood function had the form:'/k %I = 0, 9 2 = '/z, g s = ' / P ; 441 = ' / x , 442 = I/*, and 943 = 0.
4 s L =
n n
( P k j ) Nk,k = l j = l
where, N,, is the number of individuals of the kth population type that are classified as redefined Compact phenotypic cate- gory j . Note that the probabilities of the three redefined Com- pact categories for each of the three genotypes must sum to zero. Hence,
pt3 = 1 -
ptl
- p,2so that the &are not additional unknown parameters. Conse- quently, the likelihood function consists of only six unknown parameters.
The likelihood function was maximized for each sex sepa- rately, using a Simplex search method ( DIXON 1972). Using the estimated sex-specific probabilities of the
p,,
the expected numbers of the three redefined Compact categories were cal- culated separately for the four genetic populations within each sex ( F1, Fz, BC:HCR and BC:BALB).
A chi-square con- tingency test was carried out over all of the populations, sepa- rately for each sex, to test for goodness-of-fit between ex- pected and observed values. Since six parameters were esti- mated for each sex, degrees of freedom (d.f.) equal the number of phenotypic categories across the four cross types ( = 1 2 ) , less 4 d.f. for cross types and 6 d.f. for estimated parameters. This left 2 d.f. for testing the hypothesis. In the females, however, the rC3 category of the F, cross turned Out to have zero expected individuals, leaving only 1 d.f. for test- ing the hypothesis. Similarly, in the males, the rC1 category of the F, cross turned out to have only a small number ofexpected individuals, so that it was pooled with the rC2 cate- gory, again leaving only 1 d.f. for testing the hypothesis.
Linkage mapping: Linkage mapping was carried out in three stages. In the first stage, selective DNA pooling ( DARVASI and SOLLER 1994) was used with a total genome scan, to obtain approximate indications of the chromosomal location of the locus (or loci) determining the Compact phenotype. In the second stage, individual selective genotyping ( DARVASI and SOLLER 1992) was used to obtain more precise intrachro- mosomal localization of these loci. In the third stage, haplo- type analysis was used to localize the locus to a specific marker interval and to determine its approximate location within the interval.
In the selective DNA pooling study, DNA samples of the extreme individuals in the Cross-1 and Cross-2 Fz populations were pooled separately by crosses, and linkage analysis was based on the relative intensity of alternative allelic bands de- rived from the two parental lines of the crosses. Because the Compact phenotype is of intermediate dominance in males, but recessive in females, three pools were formed, denoted ClM, C5M and C5F; and consisting of C1 males, C5 males and C4
+
C5 females, respectively. In CrossLl, there were 64, 108 and 78 animals in each group, respectively; in Cross-2 there were 100 animals in each group. Linkage between a marker and a locus determining the Compact phenotype was accepted in cases where the allele corresponding to that shown by the HCR or HCI male-parent pool was stronger in the C5M and C5F pools; while the alternative allele, corre- sponding to that shown by the BALB/c female-parent pool was stronger in the C1M pool. Male parental pools and female parental pools were formed separately for each cross, by col- lecting the DNA of all parental males and of all parental females, respectively.In the fine mapping study, selective individual genotyping was carried out using Cross-2 F2 animals from the ClM, C5M and C5F groups.
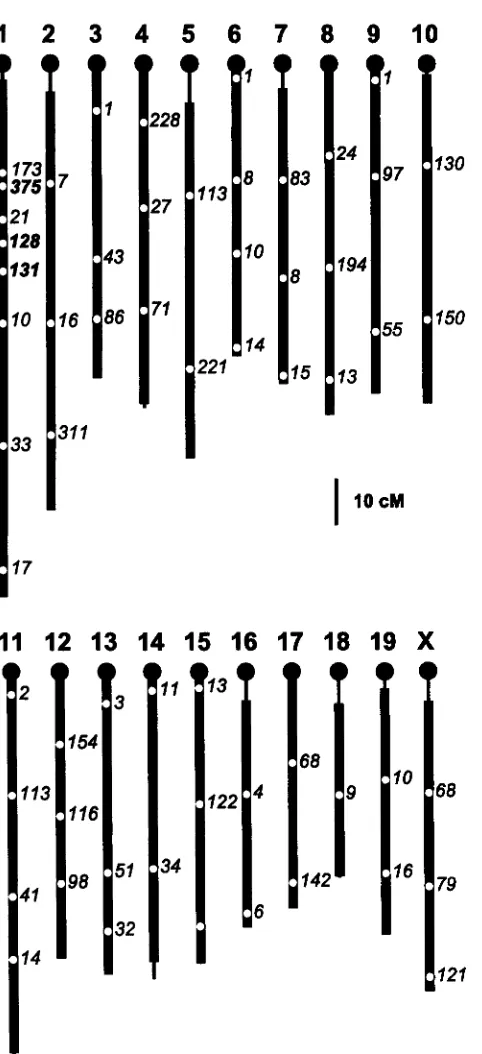
Microsatellite markers: A total of 270 microsatellite mark- ers (Research Genetics) were evaluated for ability to distin- guish unequivocally between the HCR or HCI and BALB/c parental individuals and for clarity of discrimination between alternative parental alleles in pooled samples. This required that the alternative parental alleles be well separated, with minimum or zero overlapping of shadow bands and main bands. At the end of the marker evaluation process, a total of 56 microsatellites were chosen on the basis of these criteria and also on the basis of map position (Figure 2 )
.
The number of microsatellites tested per chromosome varied widely. Twenty-three chromosome 10 microsatellites and 47 chromo- some X microsatellites were tested to uncover two and three suitable markers, respectively. In contrast, of five chromosome 6 microsatellites that were tested, four were found to be suit- able. The low polymorphism rate of chromosome 10 and chromosome X markers is consistent with previous reports( DIETNCH et al. 1996).
The chosen markers span 96.6% of the mouse genome, with a 20 cM sweep radius. All internal marker intervals were <40 cM, and all terminal marker intervals were <30 cM.
DNA preparation and genotyping: One centimeter from the tail was cut and kept at -70" until DNA preparation (URDet al. 1991 )
.
After measuring the concentration of the individual samples, a 100 ng/pl concentration dilution was prepared from each sample. A pool was made from equal quantities of the 100 ng/pl dilution of the appropriate sam- ples. For genotyping, ClM, C5M and C5F pools and parental pools were always run on the same gel.758 L. Varga et al.
I
2
3
4
5
6
7
8
9
1
0
172
375 21 128 131
10
33
17
0
1
7
43
16 86
31 1
?26
27
71 113
221 1
9
10
14
83
B
15 24
194
13
1
97
55
I
10cM11 12 13 14 15 16 17 18
I 9 X
154
116
98 3
51
32
I 1
34
10
16
I
130
58
79
121
FIGURE 2.-Genome coverage of the 56 selected microsatel- lites used for selective DNA pooling experiments. Formal lo- cus names have been abbreviated. Thinned lines represent chromosomal regions that are >20 cM from the nearest marker. The microsatellites printed in boldface are those that were added after the initial mapping phase in the Cmptregion.
col was used in both cases: initial denaturation at 94" for 3 min, and then 32 cycles at 94" for 1 min, 55" for 1 min, 72" for 1 min and the final elongation step at 72" for 5 min. Reaction volumes were overlaid with light mineral oil
(Sigma).
Radioactive method PCR reaction was carried out in 10 p1 volume from 100 ng of pooled DNA samples. Reagent
concentrations were 250 nM of each primer; 200 ~ L M of dATP, dGTP and dTTP; 10 p~ of cold dCTP; 0.1 pCi/pl alpha- [ 32P]dCTP; 2 mM MgC12 and 0.05 units/pl Taq DNA polymer- ase (Promega). Microsatellite alleles were separated on 6% denaturing polyacrylamide sequencing gel. The gel was ex- posed overnight to Agfa Curix X-ray film at room temperature for autoradiography. Densitometry was by Soft-Imagine Soft- ware ( GmBH, Germany).
Siver staining method Amplifications of 100 ng of each sample were performed in a reduced reaction volume of 5 p1 containing 200 p~ of each dNTP, 120 nM of each primer and the same concentration of both MgC12 and Taq DNA polymerase as above. After separation of PCR products on 6% denaturing polyacrylamide sequencing gel, a special plexi- glass frame was fixed on the outer glass of the sequencing apparatus, which converted it into a tray, having the outer plate as the bottom and the plexiglass frame as the walls (G.
GYAPAY, personal communication). The gel was then silver stained as described elsewhere ( BUDO"I.E et al. 1991 ) .
RESULTS
Preliminary description of Compact phenotype: Car- cass percentage values in the Cross-2 F2 animals were as follows: for males, 40.4 and 49.8% for C1 and C5 animals, respectively; for females, 40.3 a n d 47.1%, for C1 and C4 animals, respectively. The pooled standard deviation within Compact categories was 2.08%. Thus, both sexes show a marked increase in carcass percent- age relative to the normal phenotype. The difference between the C1 a n d C5 categories was equal to 3.9 phenotypic standard deviations.
In a separate study of several large muscles and bones of C5 males from the HCI subline and BALB/c normal males, the average ratio of summed muscle weight: summed bone weight was 3.79 for the BALB/c animals a n d 1.61-fold greater (6.10) for the C5 animals. T h e difference was highly significant and equal to 8.8 within- group phenotypic standard deviations.
The morphometric survey of the histological struc- ture of six C1 and six C5 animals of both sexes did not uncover any significant differences between the two groups. Vascularization, ratio of connective and con- tractile elements, ratio of the sarcoplasmic reticulum/ myofibrils, number of nuclei in the fibers and the diam- eter of the individual muscle fibers did not differ be- tween the two groups. lt therefore appears that the increase of the size a n d mass of the muscle system in the Compact phenotype is due to an increase in the number of muscle fibers, but to support this conclusion a more detailed histological and morphometric analysis is needed.
Inheritance of the Compact phenotype: Mean Com- pact phenotype of selected parents and unselected off- spring was followed over 16 generations of the HCR subline (data not shown)
.
In the first seven generations an increase in Compact phenotype with generation number was observed in both male and female off- spring. From generation7
or 8, however, there was aInheritance and Mapping of Cmpt 759
type. In generations 13 to 16, only females of Compact category C4 or C5 were chosen as parents. In these generations, the mean Compact phenotype of the off- spring of C4 and C5 parent females were nearly identi- cal (for male offspring, 4.78 and 4.79, respectively; for female offspring, 4.10 and 4.07, respectively). Except for generation 2, there was a slight excess of male off- spring. The overall sex ratio at weaning was 1.16:1.00 (ma1es:females)
,
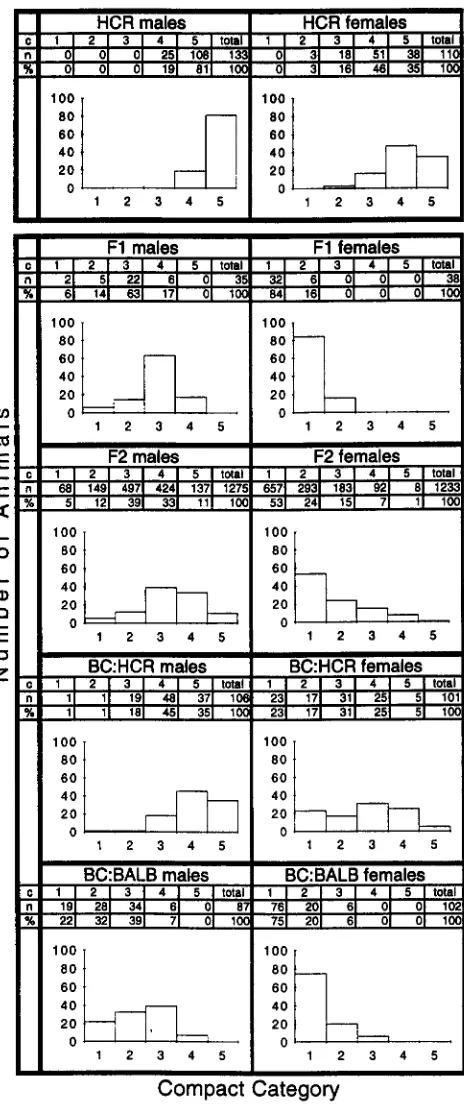
which differs significantly from equal- ity. However, overall fertility of the HCR subline was quite satisfactory, and there are no indications that the homozygosity at the loci determining the Compact phe- notype results in lethality or semilethality. Thus, taken in all, the results are consistent with the assumption that, by generation 13, the HCR subline had essentially reached fixation for the genotype responsible for the Compact phenotype.Figure 3 shows the distribution of the five Compact categories in the later generations of the HCR subline and in the F1 ( HCR X BALB/c )
,
F2 (F, X F1 ) and the BC:HCR ( F1 X HCR) and BC:BALB (F, X BALB/c) backcross populations, separately for males and females of Cross-1. In all cross types, the proportion of C4 and C5 females was lower than the proportion of C4 and C5 males. This confirms that the Compact phenotype is strongly sex influenced. Modal values were at the C3 category for F1 and F2 males but at the C1 category for F1 and F2 females. This indicates that the Compact phenotype, when visually scored, is of intermediate dominance in males but almost fully recessive in fe- males. It is possible that a more quantitative measure( e . g . , carcass percentage or muscle weight) may have revealed a different dominance pattern. The F2 distribu- tion is broader than that of the F1 ; and the BC:HCR and BC:BALB distributions are skewed to the right and left, respectively, as expected for a trait with variable expressivity under the control of one or more genes having a major effect on trait value. The relative paucity of C5 males and females in the F2 generation argues for the involvement of more than one gene in determin- ing full expression of the Compact phenotype.
Table 1 presents, for each putative genotype CC, Cc
or cc, the maximum likelihood estimates of the proba- bilities
p ,
that a particular redefined Compact pheno- typic category j is expressed; where i and j are defined as above. Values are given separately for males and fe- males. Estimates were calculated on the assumption that a single Mendelian locus is responsible for the Compact phenotype and that the HCR subline was at fixation for the genotype determining the Compact phenotype, at the time it provided parental males for Cross-1. Also shown in Table 1 are the distribution of redefined Com- pact categories over generations 13- 16 of the HCR sub- line for comparison to the maximum likelihood esti- mates for the CCgenotype. The correspondence is good for males. For females, however, the maximum likeli-20
0
1 2 3 4 5
' ~ I . A I
20 0 1 2 3 4 5
120 0 1i 2L 3 44 5L l Y I - 20 0 1 2 3 4 5
100
6 0
::
0
a
1 2 3 4 5 l20 0 1% l2 b3 -4 5
I
BC:HCR males
I
BC:HCR females4 I 9 I 1 I A I C I ) & - I I * I 9 I 1 I A 1 C l l n t m l
100
6 0
I
::I
100
- 1 2 3 4 5 1 - 1 2 3 4 5 1
100
6 0
;:
0
1 2 3 4 5
l40 20 0 1 ?2 3 L4 5
Compact Category
FIGURE 3,"Distribution of Compact phenotypes in HCR subline pooled over generations 13-16, F1 (HCR X BALB/ c ) , F2 and backcrosses to HCR (BC:HCR) and BALB/c (BC:BALB) parental lines, separately for males and females. In the histograms shown here, the x axis represents the com- pact category and the y axis represents the number of animals. c, Compact categories; n, number of animals; %, frequency distribution of Compact phenotypes.
hood estimates for the rC3 category are somewhat less than observed in the HCR subline.
TABLE 1
Maximum likelihood estimators of the expected frequencies for each postulated Compact genotype at each
of the redefined categories for males and females
Males redefined Females redefined
categories categories
Compact
genotype rC1 rC2 rC3 rC1 rC2 rC3
cc
0.00 0.00 1.00 0.00 0.12 0.88 c c 0.08 0.56 0.36 0.70 0.30 0.00cc 0.59 0.41 0.00 0.73 0.18 0.09
HCR 0.00 0.00 1.00 0.00 0.03 0.97
Observed redefined Compact category frequencies in the HCR subline are also shown.
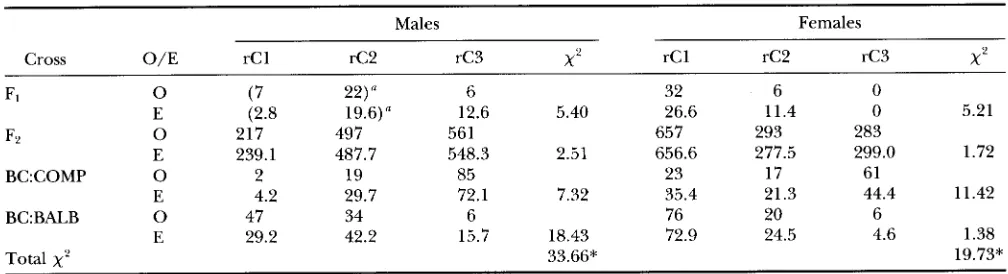
tions and numbers of the three redefined Compact cat- egories were calculated for each of the four population types, separately for males and females, and compared to the observed values (Table 2 )
.
A chi-square value of 33.66 with 1 d.f. was obtained for the males; and a value of 19.73 with 1 d.f. was obtained for the females. Thus, the hypothesis that one gene only is responsible for the Compact phenotype was rejected both for males and females with P<
0.001. The significant chi-square val- ues are due to an excess of C4 and C5 animals in the BC:HCR backcross for both males and females and an excess of C1 and C2 animals in the BC:BALB backcross for males (data not shown) .The two backcross populations and the F2 population were produced and scored for Compact category at the same time, and at any given scoring session the F2 ani- mals were 85% of the total. Thus, subjective categories were determined primarily by the distribution of cate- gory types among the F2 animals, and there is no reason to expect that they might have differed between the two BC populations. For this reason, we believe it is unlikely that the opposite excesses observed in the two BC populations were due to a change in definition of
category boundaries. Consequently, the simplest expla- nation for these results is the possible presence of a recessive modifier increasing Compact expressivity in the HCR subline; although more complex explanations, such as segregation distortion or segregation of back- ground muscularity QTL, are also possible; although we have not found a reference to segregation distortion in the Cmpt region. The presence of a modifier is also supported by the very high proportion of C5 pheno- types among males and females of the HCR subline, relative to the proportion of C5 phenotypes observed in the F2 generation. It is not possible, however, to test specific alternative hypotheses, involving two or more genes, since there are not sufficient degrees of freedom to allow estimates of the additional parameters that such hypotheses would require.
Linkage mapping: Selective DNA pooling: Genotyping of the ClM, C5M and C5F pools of Cross-1 revealed clear indicatisns of linkage for a set of linked chromo- some 1 markers spanning the region defined distally by D l M i t l 7 3 a n d proximally by DlMit33 (Figure 4 ) . These results were confirmed on the corresponding pools of Cross-2. D l M i t l 7 , which is 26.7 cM distal to DlMit33, did not show linkage. Densitometric intensity ratios of the HCR male-parent allele in the C5M and C5F pools and the BALB/c female-parent allele in ClM (data not shown) revealed strong indications of linkage for chromosome 1 markers in the 32.5 cM region between D l M i t l 7 3 and DlMitlO. Weaker linkage was detected at D l M i t 3 ; this marker is -50 cM (corresponding to proportion of recombination of 0.30) from D l M i t B l , which showed tight linkage to Cmpt (see later)
.
Exami- nation of additional markers in this region ( D l M i t 3 7 5 , D l M i t l 3 l and DlMzt128) revealed a high association with the Compact phenotype in the 19.6 cM region between D l M i t l 7 3 and D l M i t l 3 1 . These results were confirmed on pooled DNA samples of 100 C5M, 100 C5F and 100 C1M F2 individuals taken from Cross-2(data not shown)
.
The locus in this region associatedTABLE 2
Observed and expected numbers of redefined Compact phenotypes in F,, F2 and backcrosses to HCR and BALB/c parental lines
Males Females
Cross O / E rC 1 rC2 rC3
x 2
rC1 rC2 rC3x?
F1 0 (7 22) 6 32 6 0
F'L 0 E 217 497 (2.8 19.6)n 561 657 293 283
12.6 5.40 26.6 11.4 0 5.21
E 239.1 487.7 548.3 2.51 656.6 277.5 299.0 1.72
E 4.2 29.7 72.1 7.32 35.4 21.3 44.4 11.42
E 29.2 42.2 15.7 18.43 72.9 24.5 4.6 1.38
BC:COMP 0 2 19 85 23 17 61
BC:BALB 0 47 34 6 76 20 6
Total
x'
33.66* 19.73*Inl1rrit;lncc ;mtl 5l;Ipping o f ( h p / - . 1 0 1
Chr
1
1 1 1 2 1 3 1 4 1 5 1
L
a.
D /1
w
"m'\,h<,
m n 9 \ p l
ma.\
i
0
@:88
FI(;l'w 4 . " D r t c ~ t i o n o f linkage w i t h four D!.\fi/ microsat- cllitcs by selective DSA pooling i n t h c - (:ross-I F2 population (formal locus n;lmcs have hecw ahhrcviatctl)
.
TheF,
pools wcrc always grnot!ped together with thr p ; t w n t ; d pools. a s"pool-srts" i n thr following ;lrrang<mcnt o f pools: I;mc 1, (3
m;dc parents of the F,; lane 2, < ; I 51 srlcctctl group; I;mc 3,
C 5 V srlrctctl group: lanr 4, ( ; X srlcctc.tl group: lane .5.
RAI.R/c frmalt. p;Irrnts of thr F,
.
with the Compxt phenotype w i l l hcnccforth be termed the Com/)nc/ gene, denoted Oh/>/.
G e n o t y i n g of the Cross-l and Cross-2 pools for markers on the. other chromosomes gave indications of linkage for two other markers: I13.\!i/217 o n chromo- some 3 and 1)12,\fi/63 on chromosome 12. Howcvcr,
1)3,\4i/42 and 1)3L\fi/43, which map 2 c14 proximal to
D3'\lit21 7, d i d not confirm the linkage. Similarly,
I)12.\1it109, 1)12.\li/172and 1)12d\4it154, d l i c h map, rc- spcctivcly, a t the samc location. 1.2 cM distal and 2 cM
proximal t o 1)12,\4i/63, also dit1 not confirm linkage. For this rc*ason, w e d i d not attribute cfrects on the (:om- pact phenotype to thcsc chromosomal rcbgions.
fin^ mn/)/)ing: To determine thc location o f (,'rn/)/
more prcciscly, selective individual gc-notyping j\'iIs car- rictl o u t o n Cross-!? FL' anim;lls from the (:I M , (:.3\4 and
C.3F groups. Gcnotyping results showed t h a t thc. (:I \I group w a s heavily cont;lminatcd with C m / ) / IlrtcroT-
gotcs. Conscqucntly, further work conccntrat(d o n t h c
C5M
and C5F grorlps o f Cross-2. I n ;dl. the ( 3 1 4 group compriscd 144 malcs having intlividu;d mean (:omp;tct phenotypes o f 5 . 0 : the (31: group comprisctl .5l 1 fe- males having individual mean Compact ph(vmtyp(*s o f 24.0. X 1 1 animals in thcsc. groups wcrc individ1~ally gc-n o t y c d with respect to a battc1T o f four markcrs s p n - ning t h c 19.6 c\4 region bctwccn DI.\li/173 antl
1~1~\1i/131. Frequencies i n thc C.3\4 antl C5F groups d i d not differ appreciably, s o that rcsults w r c poolctl ovcr both groups. The pooled frequcncics of l-I(:I malcym" cnt alleles were as follows: 1)1,\4i/I 73, 0.940: l)lL\4i/E7,
0.9'70; DIi\1i/21, 0.948 and D1.\1i/I31, 0.90.3. T h c t \ v o
highest frequencies ofHC1 male-parc-tit allclc~s w r c ob- tained for DI1\li/375 and 1~1~\4i/21, pl;\cing C'rn/)/ hc- twccn these t w o markers. Elimination o f t h c rcgion tlis-
t a l to 1)1,\1i/131 was confirmed
b y
genotyping 30.5 C.5F indivirlrlals for the distal marker l)l.\li/lf). The propor- tion of male parcnt alleles for 1)1,\1i/131 antl l)li\fi/10in this grorlp were 91.0 antl 86.2, rcspcctivc-ly.
To further explore the location o f ' t h c C m p / gcnc., genotypes were constructed for 284 C.3F and 370
(;.3M
animals for which complete data on the above four markers was available. Of these, four C.5F and 1 1 C.5M animals were found to be hctcrozygous o r homozygorls for RALR/c female-parent alleles across the cntiro rc- gion from D11\4it1i3 to DIi\~fi/131. This indicates that these animals were heterozygous G n / ) f o r homozygous normal. Thus, the proportion o f contamination o f these genotypic groups
by
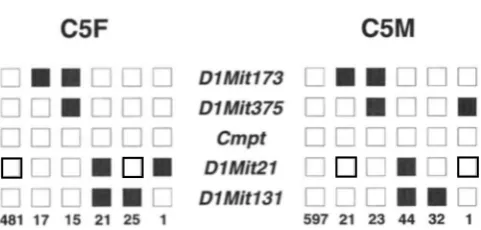
heterozygous o r hornoz\.goIls nor- mals was 0.02. M'hen these animals wcrc cbliminatcd, 280 C.3F and 3% (314 genotypes remained. Since thc haplotypes of the original parental animals were known,i t was possible to decompose thesc genotypes into rc- combinant haplotypes, as shown in Figure 3 .
Examination of the haplotypes shows clearly that there arc haplotyws in which RAI.R/c alleles arc prcs- cnt at both cwt1.s of the two marker brackets l ) l M i / I 7 3
to 1)1Mi/375 and 1)lI\4it21 to 1~1~\1i/131. Hc-ncc, C t n / > / is almost certainly not located i n the chromosomal rc- gions bracketed by these two marker p a i r s . I n contrast,
there were n o haplotqxs in which RAI.R/c ;Illelc-s wrc* found a t both ends of' the markcr bracket l)IAfi/375 t o
DIMi/21. This indicates that Cmj)/ is almost certainly found within the chromosomal region brackctcd by
these t w o markers. Thcrc were 39 rrcombinant hapltr
t y p e s carrying the Rj\L.R/c allclc a t I)I,Mit377 and the
762 L.
C5F
C5M
3
I
0
0
c]
D7Mif773w w
0
0
0
J
Li
w
0 0
D7Mif375C
iL1
H
0
0
I
0 0 L 0 0 0
CmpfO O L O 3 l L
o
G
I
I
D7Mif27c!
m
I
7
c]
0
[II
D7Mif737c
0
0
I
0
481 17 15 21 25 1 597 21 23 44 32 1
FIGURE 5.-Linkage mapping of the Cmpt gene through individual selective genot)ping and haplotype analysis in a
HCI X BALB/c Cross-2 F2 population. 0, the presence of the HCI male-parent allele; W, the presence of the BALB/c female-parent allele. At the bottom of each column is the number of F2 animals inheriting that particular chromosomal haplotype.
gene is closer to DIMit375, approximately one third
of the way to DIMit2I. Although one or two of these
recombinants may represent misclassifications, this can- not change the overall tendency of the data.
Genetic distances (cM)
,
calculated separately for fe-males and males were as follows: Females: DlMitl73-
3.0- DIMit375-6.6- DlMit21-4.6- D l M i t l 3 l ; Males:
DIMitl73-3.1- DIMit375-9.5- DIMit21-4.5- DlMitl31;
Average: DIMitl73-3.0- DIMit375-8.2- DlMit21-4.5-
DIMitl31. Although different in some details, the over-
all distance across the DIMit375- DIMit21 interval cor-
responds closely to that found in the MIT map (DIE- TRICH et nl. 1996)
.
DISCUSSION
In this study the mode of inheritance of a new hyper-
muscular mutant in mice, designated “Compact,” was
characterized. Carcass percentage of the Compact phe-
notype was 3.9 phenotypic standard deviations greater
than that of normals; the ratio of summed muscle
weightmmmed bone weight was 8.9 phenotypic stan-
dard deviations greater than that of normals. Thus, this
represents a major mutation affecting body composi-
tion. It was shown that a simple monogenic hypothesis
did not fully explain the distribution of Compact phe-
notypic categories among the F, , F2 and backcross p o p
ulations. This implies that at least two genes, possibly a
major gene and one or more modifiers, are involved in
determining the degree of expression of the Compact phenotype. Nevertheless, the original COMPACT line
and the HCR subline have been maintained for a very
long period. During this time only individuals showing strong expression of the Compact phenotype were se-
lected as parents. Deleterious pleiotropic effects of the
mutation on fertility or litter size were not observed. Thus, it seems reasonable to conclude that the HCR subline, on which the inheritance studies was carried out, is at fixation for the genotype responsible for de- termining the Compact phenotype. On this assump tion, the variety of Compact categories found in the
parental line shows that the homozygous Compact geno-
type, although fully penetrant in males and females, is characterized by variable expressivity.
The appearance in a selection line of a major mutant
affecting a trait under selection has been documented
many times in Drosophila (BATEMAN 1957; C U ~ O N
and ROBERTSON 1957; HOLLINCDALE 1971; FRANKHAM
et al. 1978; FRANKHAM 1980; Y o 0 1980; CABALLERO et
al. 1991 ) , in rats (CASTLE, cited in MULLER 1914) and
in mice ( MACARTHUR 1949; ROBERTS and SMITH 1982;
BRADFORD and F&VUU 1 9 8 4 ) . Such mutational events
are ordinarily attributed to the occurrence of a random
mutation, which is then retained in the population by
selection, and whose expression may be enhanced by
presence of positive modifiers in the selection line. This
may have been the case in the present instance. Alterna- tively, because of the quantitative nature of the trait and it.. incomplete dominance and variable expressivity,
it is possible that the Cmpt allele was present at low
frequency in the founder population of the original
selection line but was not noticed until brought to suf- ficient frequency for the appearance of homozygotes.
The specific nature of the “more than one gene”
involved in the Compact phenotype is unknown. It is
well known, however, that the degree of expression of newly arisen mutations is affected by numerous hitherto
unrecognized “modifier” loci (THOMPSON 1 9 7 5 ) . On
this basis, we would speculate that the Compact pheno-
type derives primarily from a major mutation, which
arose & novo or was already present in the selection
line, and that the selection line was also segregating at
one or more modifier loci, which came to phenotypic
expression only in conjunction with the major Compact
mutation. Major mutant and modifiers would all have been brought to fixation in the course of selection for extreme expression of the Compact phenotype in the original COMPACT line and in the HCR subline de- rived from it. The presence of modifier loci affecting hypermuscularity in double muscle animals is also sug- gested by anecdotal evidence, namely: present day dou- ble-muscled animals of the Belgian Blue Cattle breed
are said to show a much more pronounced muscular
development than double-muscled animals of 20 years
ago ( CHARLJER et al. 1995)
.
This is attributed to contin- ued selection for increased muscular development inthis population after fixation for the mh allele. The
nature of the presumptive “modifier” gene implied by the genetic analysis is intriguing. It is plausible that these modifier loci are also involved in some manner in normal trait physiology, without in themselves being a source of genetic variation in trait expression. In this case, in the absence of the major mutant, the modifier
loci would not be uncovered by linkage or candidate
gene analysis. In the presence of the major mutant,
Inheritance and Mapping of Cmpt 763
The distribution of the male and female phenotypic categories in the parental line show that the degree of expression of the Compact phenotype is strongly sex influenced, being fully recessive in females and partially recessive in males, and with a higher expressivity in males than in females, even in homozygous Cmpt ani- mals. In this the Compact phenotype differs somewhat from the other known major genes affecting muscular- ity and body composition. In its genetic behavior Cmpt
generally resembles mh, except the mh is partially reces- sive (but closer to
+/+
animals) in both sexes. Cmptalso resembles mh in that the muscular hypertrophy is primarily a histological hyperplasia ( HANSET et al.
1982). In contrast to the hg gene of mice (BRADFORD
and FAMULA 1984), Cmpt does not appear to have ad- verse effects on overall fitness or fertility.
The results of this study provide strong support for the efficacy of selective DNA pooling ( DARVASI and
SOLLER 1994; TAYLOR and PHILLIPS 1996) as an efficient
means for rapid total genome scanning and for the efficacy of individual selective genotyping ( DARVASI and SOLLER 1992) as an efficient means of fine mapping. The locus designated Cmpt in the chromosome I inter- val bracketed by D l M i t 3 7 5 and D l M i t 2 1 obviously has a powerful effect on the Compact phenotype. Despite the fact that the genetic analysis suggested the presence of additional genes affecting the Compact phenotype, we did not uncover any other chromosomal regions unequivocally associated with the Compact trait. This is in accord with the hypothesis that the other loci in- volved are modifier gene ( s )
.
These would be expected to have much smaller effects than the major gene and hence might not have been amenable to detection us- ing the selective DNA pooling technique at the marker spacing used.MyZf (myosin light chain fast skeletal muscle) locus
(ROBERT et al. 1984) and its enhancer (DONOGHUE et
al. 1988) located 24 kilobases downstream are found in the general chromosomal region to which Cmpt was mapped and hence were initially considered as plausi- ble candidate genes. However, since Cmpt was mapped by individual genotyping to a location 4-6 cM centro- merically from DIMit21, which itself is a microsatellite derived from MyZf ( DIETRICH et al. 1994), this elimi- nated the gene and its enhancer as candidates.
The mouse chromosomal region containing the Cmpt
gene belongs to an extensive region of mouse chromo- some 1 , which has syntenic homology to the 2q32-qter region in humans (NAYLOR 1996). We note that the
mh gene of cattle has also been mapped to a region of bovine chromosome 2, which has syntenic homology with the human 2q22-2q37 region (CHARLIER et al. 1995; SOLINAS-TOLDO et al. 1995)
.
This raises the possi- bility that Cmpt might be homologous to the mh gene of cattle.It is hoped that the studies reported here will eventu- ally lead to positional cloning of the locus involved.
This will require high resolution genetic and physical mapping of Cmpt ( DARVASI and SOLLER 1995; DARVASI
1997). Once fine mapping leads to a potential candi- date gene or genes, the question of gene verification
will become acute; in particular the problem of distin-
guishing functional candidate molecular variation from neutral candidate polymorphisms distinguishing the original parental strains. In addition to its basic biologi- cal interest, Cmpt is of particular interest from a pharma- ceutical and agricultural point of view, since it repre- sents a gene having powerful effects on body composi- tion. Once cloned, the Cmpt could serve to identify and clone homologous genes in other vertebrate species. Such genes are of interest as potential candidate genes for segregating QTL determining normal genetic varia- tion in body composition in man and domestic animals. They may also be attractive candidates for manipulation of carcass composition through transgenic methodolo- gies and may provide leads for pharmaceutical interven- tion in body composition.
We thank T. SAGW for his help with phenotypic classification and L. S7mO for computer analysis of DNA pools. We are grateful to Z. VARCA and F. OLASZ for helpful discussions as well as to L. OROSZ for support. We also thank IC S O v m for her skillful technical assis- tance. This research was supported by grant no. T5432 from Hungar- ian National Scientific Foundation (OTKA) .
LITERATURE CITED
BATEMAN, G . , 1957 Ph.D. Thesis, pp. 178-182 in The Strategy @the
Genes, edited by C. H. WADDINGTON. George Allen and Unwin, Edinburgh University, London.
BOWEN, R. A., M. L. REED, A. SCHNIEKE, G. E. SEIDEI., A. STACEV et
al., 1994 Transgenic cattle resulting from biopsied embryos: expression of c-ski in a transgenic calf. Biol. Reprod. 50: 664-
668.
BRADFORD, G . E., and T. R. FAMULA, 1984 Evidence for a major gene for rapid postweaning growth in mice. Genet. Res. 44: 293-208.
BUDOYJLE, B., R. CHAKRABORTY, A. M. GIUSTI, A. J. EISENBERG and R. C. ALLEN, 1991 Analysis of the VNTR locus DlS80 by the PCR followed by high-resolution PAGE. Am. J. Hum. Genet. 48: 137-144.
CABALLERO, A,, M.A. TORO and C. LOPEZ-FANJUI., 1991 The re- sponse to artificial selection from new mutations in Drosophila melanogaster. Genetics 127: 89-102.
CASTLE, W. E., 1914 Pure lines and selection. American Breeders’ Magazine, 1914 Cited in MULLER, H. J., 1914 The bearing of the selection experiments of Castle and Phillips on the variability of venes. Am. Nat. 48: 567-576.
CHARLIER, C., W. COPPIETERS, F. FARNIR, L. GROBET, P. L. LEROY, et al., 1995 The mh gene causing double-muscling in cattle maps to bovine chromosome 2. Mamm. Genome 6: 788-792.
CLAYTON, G. A,, and A. ROBERTSON, 1957 An experimental check on quantitative genetical theory. 11. The long-term responses to selection. J. Genet. 55: 152-170.
CoCKEm, N. E., S. P. JACKSON, T. L. S m Y , D. NIELSEN, A. MOORE, et
al., 1994 Chromosomal localization of the callipyge gene in sheep ( h i s a r i e s ) using bovine DNA markers. Proc. Natl. Acad. Sci. USA 91: 3019-3023.
DARVASI, A., 1997 Interval specific congenic strains (ISCS) : an ex- perimental design for mapping a QTL into a one centimorgan interval. Mamm. Genome 8: 163-167.
DARVASI, A., and M. SOLLER, 1992 Selective genotyping for determi- nation of linkage between a marker locus and a quantitative trait locus. Theor. Appl. Genet. 85: 353-359.
764 L. Varga
mination of linkage between a molecular marker and a quantita- tive trait locus. Genetics 138: 1365-1373.
DARVASI, A,, and M. SOLLER, 1995 Advanced intercross lines, an experimental population for fine genetic mapping. Genetics 141:
DIETRICH, W. F., J. C. MILLER, R. G. STEEN, M. MERCHANT, D. DAM- RON-BOLES et al., 1994 A genetic map of the mouse with 4,006
simple sequence length polymorphisms. Nat. Genet. 7: 220-245.
DIETRICH, W. F., J. C. MILLER, R. G. STEEN, M. MERCHANT, D. D m - RON-BOLES et al., 1996 A comprehensive genetic map of the mouse genome. Nature 380: 149-152.
DIXON, L. C., 1972 Nonlinear Optimization. The English University Press, London.
DONOGHUE, M., H. ERNST, B. WENTWORTH, B. NADAL-GINARD and N. ROSENTHAL, 1988 A muscle-specific enhancer is located at the
3’ end of the myosin lightchain 1 / 3 gene locus. Genes Dev. 2:
1779-1790.
ELSTON, R.C., 1981 Testing one- and two-locus hypotheses for the genetic difference of a quantitative trait between two homozy- gous lines, pp. 283-293 in Genetic Research Strategies for Psycholoa and Psychiatly, edited by E. S. GERSHON, S. MATTHYSSE, X. 0. BREAKEFIELD and R. D. CIARANELLO. The Boxwood Press, Pacific Grove, CA.
FRANKHAM, R., 1980 Origin of genetic variation in selection lines, pp. 56-68 in Selection Experiments in Laboratoly and Domestic Ani- mals. Commonwealth Agricultural Bureaus, Slough, UK. FRANKHAM, R., D. A. BRISCOE and R. K. NURTHEN, 1978 Unequal
crossing over at the rRNA locus as a source of quantitative genetic variation. Nature 272 80-81.
GEORGES, M., 1990 A reverse genetic approach towards the bovine “Muscular Hypertrophy” gene based on the use of DNA finger- prints, pp. 227-233 in Genome Analysis in Domestic Animals, edited by H. GELDERMAN and F. ELLENDORFF. VCH. Verlagsgesellschaft mbH. Winheim, Germany.
HANSET, R., C. MICHAUX, C. DESSY-DOIZE and G. BURTONBOY, 1982
Studies on the 7th rib in the double muscled and conventional cattle, pp. 341-349 in Muscle Hypertrophy of Genetic &gzn and Its Use to Improve Beef Production, edited by J. W. B. KING, and F. MENISSIER. Martinus Nijhoff, The Hague.
HOLLINGDAI~E, B., 1971 Analyses of some genes from abdominal bristle number selection lines in Drosophila melanogaster. Theor. Appl. Genet. 41: 292-301.
1199-1207.
LAIRD, P. W., A. ZIJDERVELD, K. LINDERS, M. A. RUDNICKI, R. JAENISCH
et aZ., 1991 Simplified mammalian DNA isolation procedure. Nucleic Acids Res. 19: 4293.
MACARTHUR, J. W., 1949 Selection for small and large body size in the house mouse. Genetics 34: 194-209.
MCPHERRON, A. C., A. M. LAWLER and
S.3.
LEE, 1997 Regulation of sceletal muscle mass in mice by a new TGF-P superfamily mem- ber. Nature 387: 83-90.MOOD, A. M., F. A. GRAYBILL and D. C. BOES, 1974 Introduction to the Theoly of Statistics. McGraw-Hill Book Co., New York. NAYLOR, S. L., 1996 Comparison of human chromosome 2 to the
mouse map. Cytogenet. Cell Genet. 73: 271-272.
PURSEL, V. G., P. SUTRAVE, R. J. WAII, A. M. KELLY and S. H. HUGHES,
1992 Transfer of c-ski gene into swine to enhance muscle devel- opment. Theriogenology 37: 278.
ROBERT, B., P. DAUBAS, M. A. AIUMENKO, A. COHEN, I. GARNER et al.,
1984 A single locus in the mouse encodes both myosin light chains 1 and 3, a second locus corresponds to a related pseu- dogene. Cell 39: 129-140.
ROBERTS, R. C., and C. SMITH, 1982 Genes with large effects. Theo- retical aspects in livestock breeding. pp. 420-438 in Second World Congress on Genetics Applied to Livestock Production, Vol. 6, Editorial Garsi, Madrid.
SOLINAS-TOLDO, S., C. LENGAUER and R. FRIES, 1995 Comparative genome map of human and cattle. Genomics 27: 489-496.
SHAPIRO, J. A,, 1995 Adaptive mutation. Who’s really in the garden? Science 268: 373-374.
SUTRAVE, P., A. M. KELLY and S. H. HUC-HES, 1990 ski can cause selective growth of skeletal muscle in transgenic mice. Genes Dev. 4: 1462-1472.
TAYLOR, B. A,, and S. J. PHILLIPS, 1996 Detection of obesity QTLs on mouse chromosomes 1 and 7 by selective DNA pooling. Geno- mics 3 4 389-398.
THOMPSON. J. N., 1975 Quantitative variation and gene number. Nature 258: 665-668.
Yoo, B. H., 1980 Long-term selection for a quantitative character in large replicate populations of Drosophila melanogaster. 11. Le- thals and visible mutants with large effects. Genet. Res. 35: 19- 31.