ABSTRACT
THEISEN, CHRISTOPHER RICHARD. Risk-Based Attack Surface Approximation. (Under the direction of Laurie Williams.)
Motivation:Security testing and reviewing efforts are a necessity for software projects, but are time-consuming and expensive to apply. Organizations look to utilize security professionals as
efficiently as possible. Identifying vulnerable code supports decision-making during all phases of
software development. Potentially vulnerable code identified early in the development of software can facilitate “building security in” before release. Identifying potentially vulnerable code after
release can prevent potential vulnerabilities from becoming major breaches. However, identification
of potentially vulnerable code is difficult, as vulnerabilities are rare.
Research Problem: Prioritizing security reviews is difficult, as we lack effective metrics for
determining what code should be considered security relevant.
Objective:The goal of this research is to aid software engineers in prioritizing security efforts by approximating the attack surface of a system via crash dump stack trace analysis.
Approach:We propose Risk-Based Attack Surface Approximation (RASA), an approach to
de-termine the attack surface of software systems by using crash dump stack traces and the code that appears on them as a metric for prioritizing security reviews. We call our approach “risk-based” as it
identifies the “riskiest” code in the system. Crashes are empirical evidence that the code involved
in the crash was executed in an unexpected way, in the same way that vulnerabilities are often instances of code executed in an unexpected way. In the case of a crash, some outside input was
able to cause the state in the software system that caused the crash conditions. The same types of
input and states could be correlated with input and states that result in vulnerabilities.
Results:We have performed studies on the effectiveness of RASA on Microsoft Windows and
Mozilla Firefox, including the effect of randomly sampling crash dump stack traces from the targeted
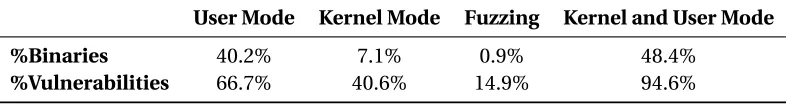
software system. For Windows, 48.4% of binaries appeared on the approximated attack surface measured by RASA, while 94.6% of historical vulnerabilities occurred on the approximated attack
surface. For Firefox, 15.8% of files appeared the approximated attack surface, while 73.6% of historical
vulnerabilities occurred on the approximated attack surface. We developed a set of attack surface related metrics based on the concepts of a software system changing over time, code complexity,
and entry and exit points. We found that over 50% of the approximated attack surface for Windows changes from version to version, that fan-out complexity metrics based on crash data are a stronger
predictor of vulnerable code than just the approximated attack surface, and that vulnerabilities are
more likely to occur directly on entry and exit points. We compared RASA against the state of the art in vulnerability prediction on Mozilla Firefox, with RASA and a broad sampling of software metrics
and text mining approaches for vulnerability prediction having stronger predictive performance
than any individual model (F1=0.28). We also determined specific classifications and severities of vulnerabilities that RASA covers. RASA covers the most severe vulnerabilities seen for Mozilla
© Copyright 2018 by Christopher Richard Theisen
Risk-Based Attack Surface Approximation
by
Christopher Richard Theisen
A dissertation submitted to the Graduate Faculty of North Carolina State University
in partial fulfillment of the requirements for the Degree of
Doctor of Philosophy
Computer Science
Raleigh, North Carolina
2018
APPROVED BY:
Timothy Menzies William Enck
David Dickey Laurie Williams
DEDICATION
ACKNOWLEDGEMENTS
It is difficult for me to name everyone who has had an impact on this dissertation. Deepest apologies to anyone I forgot.
To Laurie Williams, for taking me under your wing and helping me grow as a researcher and as a
person. Thank you for your patience, expertise, kindness, and understanding. Thank you for the pushes when I needed them and the compassion when I needed the opposite.
To Brendan Murphy, who I think of as a co-advisor in all but name. Much of the research in this document would not have been possible without your support, and I am grateful to you for the
advice you have given personally and professionally along the way.
To Kim Herzig, who was the first person who dealt with me as a brand new researcher. Thank you for your patience and guidance over the years.
To my committee members Tim Menzies, Will Enck, and Jon Stallings for their time, support,
and advice. Each of you have provided key insights and advice throughout this work.
To all the NCSU faculty and staff who provided feedback and help along the way. I especially
acknowledge Katie Stolee, Emerson Murphy-Hill, Chris Parnin, Munindar Singh, David Wright, Carol
Allen, Kathy Luca, and Andrew Sleeth, along with my committee members.
To my Realsearch colleagues past and present: thanks for the feedback, collaborations, advice,
and laughs over the last five years: Sarah Heckman, Andy Meneely, John Slankas, Pat Francis, Eric
Helms, JeeHyun Hwang, Da Young Lee, Jason King, Rahul Pandita, Akond Rahman, Maria Riaz, Akond Rahman, Sarah Elder, and Rezvan Hezaveh, among others. I am lucky to have met you all,
and each of you have left a small stamp on this document (and me).
To all my colleagues and friends from graduate school and beyond: thanks for screaming into the abyss with me. I cannot possibly name everyone, but especially acknowledge the following
alongside Realsearch colleagues: Prairie Rose and Dan Goodwin, Sean Mealin, Michelle Hall, Kevin
Lubick, Titus Barik, Denae Ford, Justin Smith, Brittany Johnson, Jim Witschey, Sheldon Abrams, Nuthan Munaiah, Dennis and Nina Murphy, Rob and Melinda Shutler, Carrie Landes, Meredith
and Thomas Lopez, Jennifer and Darren Lipper, Jon Rust, Ben Merkel, Corry Paxson, and Corey
Downing. Thanks for collaborations, kind words, timely advice, and needed escapes.
To Cynthia Theisen, who made me realize that a PhD was something I could actually pursue.
You laid the groundwork that led me here.
To my family: Richard Theisen, Lisa Staats, Kayla Theisen, and Caitlin Theisen. Thank you for
your patience, understanding, love, and support while I went missing for five years doing a PhD.
And most importantly to my wife, Kelly Theisen. It is impossible to put into words the impact you had on this document and on me. You are my biggest supporter, my most enthusiastic cheerleader,
TABLE OF CONTENTS
LIST OF TABLES . . . .viii
LIST OF FIGURES. . . ix
Chapter 1 INTRODUCTION . . . 1
Chapter 2 ATTACK SURFACE DEFINITIONS . . . 6
2.1 Introduction . . . 6
2.2 Systematic Literature Review . . . 7
2.2.1 Definition Citations . . . 7
2.2.2 Definition Granularity . . . 8
2.2.3 Clusters of Definitions . . . 9
2.2.4 Results . . . 10
2.3 Discussion . . . 11
Chapter 3 RELATED WORK. . . 12
3.1 Crash Dump Stack Traces . . . 12
3.2 Vulnerability Prediction and Prioritization . . . 13
3.3 Classifying Defects . . . 14
3.4 Classifying Vulnerabilities . . . 15
3.5 Attack Surface . . . 15
3.5.1 Attack Surface Research . . . 15
3.5.2 Attack Surface Tools . . . 16
Chapter 4 RISK-BASED ATTACK SURFACE APPROXIMATION . . . 18
4.1 Motivation . . . 19
4.2 Why Approximation? . . . 20
4.3 Crash Dump Stack Traces . . . 21
4.4 Risk Based . . . 22
4.5 Process . . . 23
4.5.1 Collect Crash Data . . . 23
4.5.2 Parse Stack Trace . . . 24
4.5.3 Map Stack Trace Data To Source Code . . . 26
4.5.4 Collect Vulnerability Data . . . 27
Chapter 5 VULNERABILITY COVERAGE . . . 29
5.1 Introduction . . . 29
5.2 Methodology . . . 30
5.2.1 Risk-Based Attack Surface Approximation . . . 30
5.2.2 Random Sampling . . . 31
5.3 Windows Case Study . . . 32
5.3.1 Data Sources . . . 32
5.3.3 Random Sampling . . . 34
5.4 Firefox Case Study . . . 34
5.4.1 Data Sources . . . 34
5.4.2 Data Collection . . . 35
5.4.3 Random Sampling . . . 35
5.5 Results . . . 36
5.5.1 Risk-Based Attack Surface Approximation - Binaries . . . 36
5.5.2 Risk-Based Attack Surface Approximation - Files . . . 36
5.5.3 Random Sampling . . . 37
5.6 Discussion . . . 39
5.6.1 Practitioner Reactions . . . 40
5.6.2 Why Does Sampling Work? . . . 42
5.7 Limitations . . . 43
Chapter 6 ADVANCED METRICS. . . 45
6.1 Introduction . . . 45
6.2 RASA Metrics . . . 46
6.2.1 Change in Attack Surface Over Time . . . 46
6.2.2 Complexity Metrics . . . 47
6.2.3 Boudnary Metrics . . . 47
6.3 Data Sources . . . 49
6.4 Data Collection Methodology . . . 49
6.5 Change Metric Generation . . . 51
6.6 Complexity Metric Generation . . . 52
6.7 Boundary Metric Generation . . . 52
6.8 Results . . . 52
6.8.1 RASA at source code file level . . . 52
6.8.2 Change Metrics . . . 53
6.8.3 Complexity Metrics . . . 53
6.8.4 Boundary Metrics . . . 55
6.9 Discussion . . . 55
6.10 Limitations . . . 56
Chapter 7 VULNERABILITY CLASSIFICATIONS . . . 60
7.1 Motivation . . . 60
7.2 Methodology . . . 61
7.2.1 Identifying Vulnerabilities . . . 61
7.2.2 Classifying Vulnerabilities . . . 61
7.2.3 Vulnerability Severity . . . 63
7.2.4 Risk-Based Attack Surface Approximation . . . 63
7.3 Case Study . . . 64
7.3.1 Vulnerability Data . . . 64
7.3.2 Crash Dump Stack Trace Collection . . . 66
7.4 Results . . . 67
7.4.2 Coverage of Vulnerability Severity . . . 67
7.5 Discussion . . . 68
7.6 Limitations . . . 69
Chapter 8 VULNERABILITY PREDICTION MODEL COMPARISON. . . 71
8.1 Motivation . . . 71
8.2 Vulnerability Prediction Model - Windows 8 . . . 72
8.2.1 Crash Dump Stack Traces . . . 73
8.2.2 Code Metrics . . . 74
8.2.3 Pre and Post-Release Vulnerabilities . . . 75
8.2.4 Prediction Models . . . 75
8.2.5 Data Sources . . . 76
8.2.6 Results . . . 77
8.3 Vulnerability Prediction Models Comparison - Firefox . . . 77
8.3.1 Software Metrics - Churn and Complexity . . . 77
8.3.2 Text Mining . . . 78
8.3.3 Methodology . . . 78
8.3.4 Mozilla Firefox Case Study . . . 80
8.3.5 Results . . . 87
8.3.6 VPM Combinations . . . 88
8.3.7 VPM Resource Usage . . . 90
8.4 Discussion . . . 90
8.4.1 VPM Comparisons . . . 90
8.4.2 VPM Combinations . . . 92
8.4.3 Feature Generation and Practical Usage . . . 92
8.5 Limitations . . . 94
Chapter 9 ATTACK SURFACE MEASUREMENT COMPARISON. . . 96
9.1 Motivation . . . 96
9.2 Munaiah Attack Surface . . . 97
9.3 Younis Attack Surface . . . 98
9.4 Methodology . . . 98
9.5 Case Study - Wireshark . . . 99
9.6 Results and Discussion . . . 100
9.7 Limitations . . . 101
Chapter 10 CONTRIBUTIONS AND FUTURE WORK . . . .102
10.1 Contributions . . . 102
10.2 Summary . . . 103
10.3 Future Work . . . 104
10.3.1 Crash Data Quality . . . 104
10.3.2 Dynamic Software Metrics . . . 104
10.3.3 Oracles for Vulnerability Studies . . . 105
LIST OF TABLES
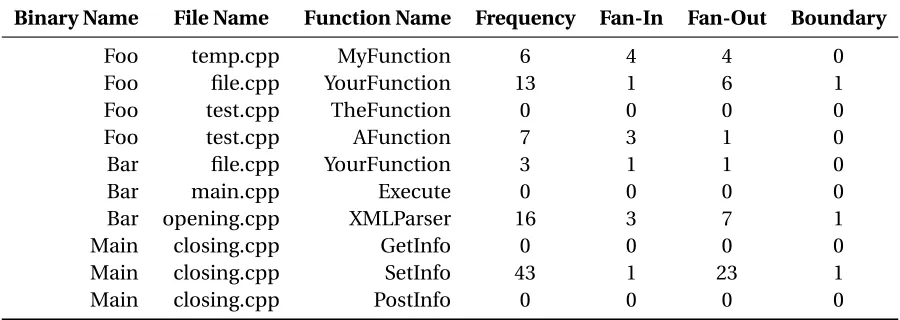
Table 4.1 An example of a database or file format for summarizing crash dump stack trace data. . . 25
Table 5.1 Examples of files seen in the topmost_filename field in the Firefox crash dumps. 35 Table 5.2 Descriptive statistics for attack surface at binary level, broken down by type of
stack trace category that identified the binary. . . 37 Table 5.3 Results of randomly sampling crash dump stack traces while implementing
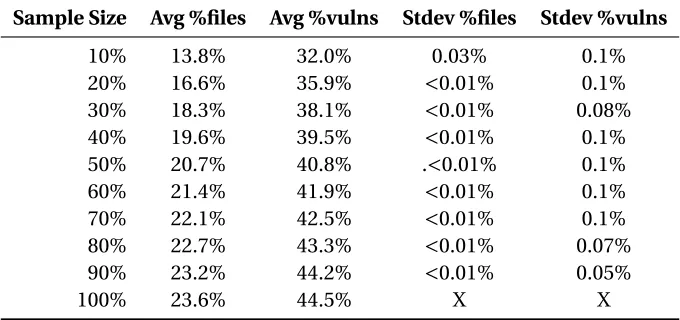
Risk-Based Attack Surface Approximation on Microsoft Windows 8.1. . . 38 Table 5.4 Results of randomly sampling crash dump stack traces while implementing
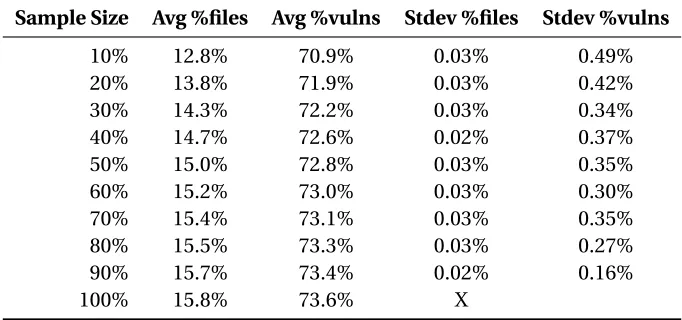
Risk-Based Attack Surface Approximation on Mozilla Firefox. . . 39 Table 5.5 Snapshot of files with associated vulnerabilities where the number of times
the file was found in a crash was six or less, sorted by total number of crashes. 43
Table 6.1 - Number of crash dump stack traces parsed in 2014 and 2015, by OS version.. 49 Table 6.2 - Percentage of files appearing on crash dump stack traces and vulnerabilities
appearing on crash dump stack traces for operating system/year pairings. . . . 53 Table 6.3 Change metrics for three comparisons: Windows 8 to 8.1, Windows 8.1 to 10,
and Windows 10 (2014 to Windows 10 (2015). . . 54 Table 6.4 Spearman rank-order correlation coefficient for Fan-In and Fan-Out values
compared to the log2ratio of the SF and VF metrics for Windows 8, 8.1, and 10. 54 Table 6.5 Percentage of files appearing on the boundary of Windows, as measured by
crash dump stack traces, and the percentage of files with vulnerabilities in the set. . . 55
Table 7.1 The list of keywords used to collect potential unlabeled vulnerabilities from Mozilla’s Bugzilla database on Mozilla Firefox. . . 65
Table 8.1 List of features included in our best-effort replication of the VPM described by Zimmermann et al.[Zim10] . . . 82 Table 8.2 List of features included in our best-effort replication of the VPM described by
Shin et al.[Shi11]. Descriptions for complexity metrics from SciTools[Sci17]. . 83 Table 8.3 Median Precision, Recall, and F1 score for each Vulnerability Prediction Model
for Mozilla Firefox, using a Random Forest Classifier. . . 88 Table 8.4 Median Precision, Recall, and F1 score for each Vulnerability Prediction Model
for Mozilla Firefox, using a Gaussian Naive Bayes Classifier. . . 89 Table 8.5 The relative importance of the top 10 features used in the trees featured in the
Random Forest Classifier in the “All” model. Quotes indicate a token from the text mining approach. . . 89 Table 8.6 Resource usage statistic for each Vulnerability Prediction Model on Mozilla
LIST OF FIGURES
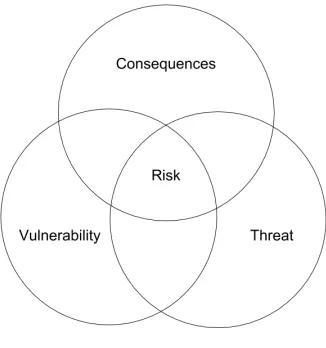
Figure 4.1 A graph representation of the attack surface of a software system. Blue nodes represent code that does not appear on the attack surface, while red nodes indicate code on the attack surface. . . 19 Figure 4.2 A Venn diagram representing the relationship between a vulnerability, the
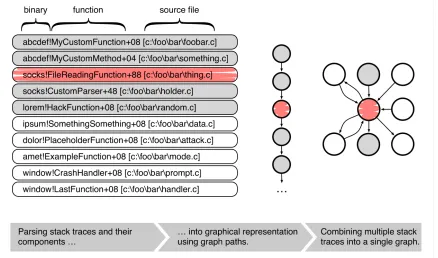
consequence of the vulnerability, and the threat posed by the vulnerability. Each of these factors add up to the overall risk of the vulnerability being exploited. . . 23 Figure 4.3 Example of an anonymous stack trace. From the stack trace, we can identify
binary, function, and sometimes source file information. Each of these stack traces can be transformed into a graphical representation. Each stack trace contributes one particular path (see middle) to the overall attack surface graph (see right hand side). . . 24
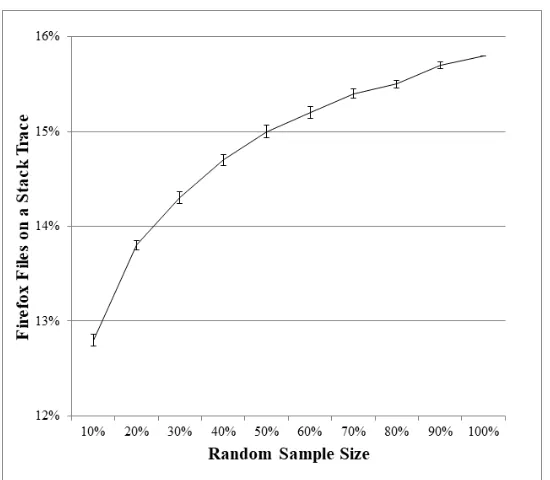
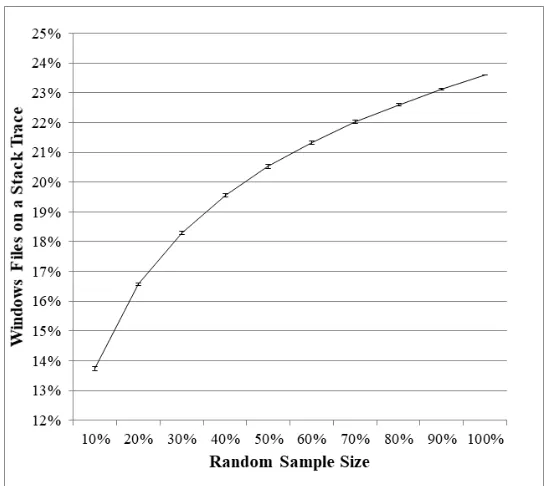
Figure 5.1 Graph of the percentage of files included on the RASA at random samples for Mozilla Firefox. . . 40 Figure 5.2 Graph of the percentage of vulnerabilities covered by RASA at random samples
for Mozilla Firefox. . . 41 Figure 5.3 Graph of the percentage of files included on the RASA at random samples for
Microsoft Windows. . . 41 Figure 5.4 Graph of the percentage of vulnerabilities covered by RASA at random samples
for Microsoft Windows. . . 42
Figure 6.1 The overall design of the database used to collect crash dump stack trace data and relate it to code artifacts in Windows 8, 8.1, and 10. Boxes represent individual tables. The full database schema design is available online. . . 48 Figure 6.2 A trendline of the distribution of files in Windows 8, based on the number of
incoming and outgoing calls from a file. . . 57 Figure 6.3 A trendline of the distribution of files in Windows 81, based on the number of
incoming and outgoing calls from a file. . . 58 Figure 6.4 A trendline of the distribution of files in Windows 10, based on the number of
incoming and outgoing calls from a file. . . 59
Figure 7.1 Distribution of classifications of vulnerabilities occurring on crashing code versus classifications occurring on non-crashing code. The percentage of vulnerabilities covered for a specific classification is next to the label. Vulner-ability classifications with no entries in our dataset are omitted. . . 66 Figure 7.2 Distribution of severity of vulnerabilities occurring on crashing code versus
severities occurring on non-crashing code. The percentage of vulnerabilities covered for a specific severity is next to the label. . . 68
CHAPTER
1
INTRODUCTION
The Open Web Application Security Project (OWASP) defines the attack surface of a system as the
paths in and out of a system, the data that travels those paths, and the code that protects the paths and the data[BM15]. The attack surface of a system can be used to determine which parts of a system could have exploitable security vulnerabilities. Items not on the attack surface of a system are
unreachable by outside input, and, therefore, less likely to be exploited. If outside input cannot be passed to code containing a security vulnerability, engineering resources spent working on finding
and fixing that vulnerability could be used elsewhere. Howard et al. introduced the concept of an
attack surface, describing entry points to a system that might be vulnerable along three dimensions: targets and enablers, channels and protocols, and access rights[How05]. Later, Manadhata and Wing[MW11]formalized the notion of attack surface, including methods, channels, untrusted data, and a direct and indirect entry and exit point framework that identifies methods through which untrusted data passes.
An approach for prioritizing security effort using the concept of attack surface would help
security professionals focus their efforts on code containing vulnerabilities that are reachable, and therefore exploitable, by malicious users. Reducing the amount of code to be inspected may help
improve the economics of security assessments and allow for more efficient proactive reviews of potentially vulnerable code. However, the software security community still lacks a practical means
of identifying the parts of the system that are on the attack surface. An automated approach for
testing and review efforts could be targeted effectively and efficiently.
The goal of this research is to aid software engineers in prioritizing security efforts by approximating the attack surface of a system via crash dump stack trace analysis.
To fill the need for a practical understanding of the attack surface of a software system, we
propose Risk-Based Attack Surface Approximation (RASA), an automated approach to identifying parts of the system that are contained on the attack surface through stack trace analysis. We parse
stack traces, adding all code found in these traces onto the RASA. Code that appears in stack traces
caused by user activity is on the attack surface by definition, because it appears in a code path reached by outside input.
Crash dump stack traces from user-initiated crashes represent user activity that puts the system
under stress. In our research, we provide an assessment of the degree to which crash dump stack traces support the identification of attack surfaces. We call our approach “Risk-Based Attack Surface
Approximation” because we hypothesize that RASA is an efficient means of identifying the part
of the attack surface that has a high risk of containing vulnerabilities. RASA is a useful approach since it is scalable, as crash dump stack traces are relatively easy to parse. The results from RASA
can be widely used in industry since many organization collect crash dump stack traces already,
such as Microsoft and Mozilla. Finally, unlike other approaches, RASA does not require complex language-specific code analysis tools since it is a report of the dependencies between binaries, files
or methods. Hence, RASA can be applied to systems that are combinations of different programming languages.
Our research hypothesis is thatbinaries and source code files that appear in crash dump stack
traces from a software system are more likely to have exploitable vulnerabilities than binaries and source code files that do not appear in crash dump stack traces.
To test the above hypothesis, we propose the following research questions:
Approximation (RQ1):Are vulnerabilities more likely to occur on in code appearing on crash dump stack traces than code not appearing on crash dump stack traces?
We first study whether historical vulnerabilities correlate with the attack surface generated by
the RASA approach for Windows 8. If historical vulnerabilities are found to correlate with the attack surface, RASA could be used by software security teams to prioritize their efforts. We also explore the
effect of random sampling of crash dump stack trace data on the RASA approach on three versions
of Windows, along with Mozilla Firefox. Exploring the data requirements of RASA is necessary to see if the approach is usable by projects of varying sizes. Random sampling of crash dump stack traces
without replacement (not choosing the same crash dump stack trace multiple times in the same
sample) may be an effective simulation of situations where less data is available. For Windows 8 at the binary and file level and for Mozilla Firefox at the file level, RASA indicates that vulnerabilities
are more frequently found in crashing code rather than non-crashing code.
particular, more specific metrics will be needed to move from a proof-of-concept to an approach
that can be used by practitioners on live software projects. With the goal of developing additional metrics for practitioners to use, we asked the following questions regarding metric generation using
crash dump stack traces:
Change (RQ2):Does the approximated attack surface need to be re-computed with each new release or periodically during development?
Knowing if the attack surface of software can change over time, as measured by RASA, is useful
to understand whether the calculated attack surface of a system is static or needs to be recomputed periodically to provide meaningful results. We found that recomputing RASA as frequently as weekly
during active development and at minimum once per version change will allow practitioners to
keep up with attack surface changes as the software changes.
Complexity (RQ3):How are security vulnerabilities correlated with code complexity metrics
such as fan-in and fan-out, generated from crash dump stack traces?
McCabe et al[McC76]first described the concept of code complexity, specifically in and fan-out measures. Shin et al.[Shi11]found a positive correlation between the presence of vulnerabilities and code complexity metrics, specifically fan-out. We explore whether fan-in and fan-out measures
calculated from code graphs created from crash dump stack traces also follow their result. We found that fan-in and fan-out are both correlated with the likelihood of a security vulnerability fix being
present in a source code file.
Boundary (RQ4):Is reviewing data flows in a software system necessary to find a majority of security vulnerabilities, or can entry and exit points be prioritized for security review?
A previous study by Manadhata et al.[Man06]measured the attack surface of an FTP daemon by an API scanning approach which found the entry and exit points to the system. Our definition
of attack surface includes all of the paths data takes throughout a system, but the concept of an
attack surface boundary may be useful for prioritization efforts. We analyzed whether code on the boundary of systems is more likely to have vulnerabilities than the rest of the codebase. Code
included on RASA for Windows 8, 8.1, and 10 was twice as likely to have vulnerabilities as non
crashing code, while code that was included on RASA and was also on the boundary of the software system was four times likely to have vulnerabilities compared to non crashing code.
Next, we explore vulnerabilities themselves. Accounting for the classifications and severities
of vulnerabilities is important in vulnerability prediction studies[MM16]. Some vulnerabilities are more severe than others, and some vulnerability types may not be covered by the RASA approach.
Vulnerability Classifications (RQ5):What classifications and severities of vulnerabilities appear
on an attack surface approximated by crash dump stack traces in comparison to vulnerabilities that are not on crash dump stack traces?
For Mozilla Firefox, 14 classifications of vulnerabilities were present, with RASA covering 11 of
proportional to the coverage of all vulnerabilities in Firefox.
The RASA approach could be useful as an input into Vulnerability Prediction Models (VPMs) that have been proposed. RASA could help these tools overcome the inherent scarcity problem of
vulnerabilities for statistical learners by removing a large percentage of the codebase.
VPM Comparison (RQ6):Does risk-based attack surface approximation improve the precision and recall values of vulnerability prediction models when predicting the location of vulnerabilities
in software system?
Our study comparing VPMs included RASA, along with two software metric based approaches by Shin et al.[Shi11]and Zimmermann et al.[Zim10], and a bag of words text mining approach by Scandariato et al.[Sca14]. RASA has the best reported recall at .86 in our comparison of indi-vidual VPMs. In addition, combining RASA with the text mining approach resulted in a significant improvement in precision, albeit at the cost of recall.
We compare RASA approach to other attack surface measurement research: the Younis et
al.[You14]scanning approach and Munaiah’s proximity approach[MM16]. We compare these approaches in terms of the size of the resultant code to be analyzed, the percentage of vulnerabilities
covered, and time to set up and run the approach. Collecting information about the predictive
power of each approach along with the resource requirements of each means practitioners can make an informed decision on what approach is best for them.
Attack Surface Comparison (RQ7):How does risk-based attack surface approximation compare with the state of the art of attack surface approximation in terms of computation time, size of the
resultant attack surface, and presentation of feedback?
We found
We have completed the following studies to address the seven research questions proposed
above. Each study description is followed by a list of research question that study addresses:
• Evaluation of whether risk-based attack surface approximation is feasible for prioritizing code artifacts that may contain vulnerabilities. (RQ1)[The15c; The15a]
• Evaluation of random sampling of crash dump stack traces and whether the resultant iteration
of RASA still allows for vulnerability prioritization. (RQ1)[The17]
• An exploration of “advanced metrics” for risk-based attack surface approximation derived
from crash dump stack traces, such as the change in attack surface over time, the relationship
between code complexity and vulnerabilities, and the relationship between the boundary of software systems and vulnerabilities. (RQ2, RQ3, RQ4)
• Profiling the types of vulnerabilities that appear on and off RASA, and whether vulnerabilities
• A comparison of VPMs before and after RASA data is applied to limit the amount of code being
used as part of the model (RQ6)[The18b]
• A comparison of the RASA approach with the state of the art in attack surface research (RQ7)
We make the following contributions to the research and industrial communities:
• Risk-Based Attack Surface Approximation, a process using crash dump stack traces to prioritize
security testing and review efforts.
• An analysis of current definitions of attack surface and a proposal for a unified definition for the research community.
• An open source toolset to help organizations and research teams implement Risk-Based Attack Surface Approximation on their projects.
The rest of this document is organized as follows: Chapter 2 provides a short discussion of the term “attack surface” and how it is used in research literature. Chapter 3 provides background
information on concept of attack surface, and work related to the studies proposed and performed
in this document. Chapter 4 discusses the motivation and implementation of the RASA approach. Chapter 5 presents the initial study to determine the effectiveness of RASA, along with an exploration
of the effect of random sampling on the results of RASA. Chapter 6 describes the implementation
and evaluation of the additional RASA-Based metrics of change, complexity, and boundary. Chap-ter 7 discusses how RASA covers vulnerabilities of specific classifications and severities. Section 8
compares RASA against the state of the art in vulnerability prediction. Chapter 9 compares RASA
CHAPTER
2
ATTACK SURFACE DEFINITIONS
2.1
Introduction
Michael Howard provided the earliest definition of the term attack surface when he defined it as
“the union of code, interfaces, services, protocols, and practices available to all users, with a strong focus on what is accessible to unauthenticated users.”[How04]Software security researchers and professionals have used Howard’s concept of the attack surface to discuss the overall security posture of a system, or the effectiveness of a given security measure[How05]. For example, reducing the attack surface is one way researchers provide evidence that the system is more secure. Practitioners
can also use attack surface measurements to prioritize their fortification efforts.
However, a variety of definitions exist for the phrase attack surface, which drives how researchers
conduct their measurements. Recent research using the attack surface concept varies, with some
prioritizing the localization of vulnerabilities, others identifying vulnerable code, and others deter-mining how risky specific vulnerabilities are. Younis et al.[You14]analyzed the relationship between the attack surface of Apache HTTP Server and the density of vulnerabilities in the system. Munaiah
et al.[MM16]used call graphs to determine the proximity of security vulnerabilities to the attack surface of the software system and found that vulnerabilities were found near the surface of the
measurements of attack surfaces.
Understanding how the term attack surface is used in the research literature and establishing a baseline definition will help facilitate discussion about RASA in comparison to other approaches
for security testing and review. If RASA and another approach both claim to measure or
approxi-mate the attack surface of a system, but are using different conceptual models for the term, then comparing the approaches will be difficult. Additionally, inconsistent definition between tools and
approaches could confuse practitioners. They may attach to one tool’s concept of attack surface
and not understand why another attack surface tool doesn’t model attack surfaces in the way they expect.
2.2
Systematic Literature Review
To explore the use of the phrase attack surface in the research literature, we performed a systematic
literature review[The18a]of the use of the phrase, including research papers, magazine articles, and technical reports. After identifying a set of 1,433 potential papers for inclusion in our study, we selected 644 that used the phrase attack surface in some way in the text. For these papers, we
determined whether they provided their own definition, cited another definition, or expected the
reader to understand their use of the phrase intuitively. We identified the source of each paper, such as a specific database or aggregator. Additionally, we analyzed the level of granularity of each paper’s
use of attack surface. For example, some papers discussed the attack surface of an entire network of
systems, while others discussed how specific functions affect the attack surface of one system.
2.2.1 Definition Citations
The full text of the relevant papers identified in the previous stage are read and categorized into
categories that are based on papers’ usage context of the phrase attack surface. Since the goal of our study was to understand the various definitions of the phrase attack surface used in the community,
we categorized the relevant papers into one of four categories. Each paper fits into exactly one
category[The18a]:
•
Define
- The paper defines, formally or informally, the phrase attack surface in the text.Papers in prior attack surface literature or papers that include a glossary with a definition of the phrase attack surface are placed into the Define category.
•
Supported Use
- The paper uses the phrase attack surface without explicitly defining it.However, the usage of the phrase is supported by citing a paper that defines the phrase.
•
Unsupported Use
- The paper uses the phrase attack surface with neither an explicit•
Not Relevant
- The paper is not relevant to our SLR. Papers that are categorized into theNot Relevant
category are false positives from the previous stage.The order of the categories presented above is the order in which the categorizations were made.
For instance, if a paper is extending an existing (cited) definition of the phrase attack surface, the paper will be categorized as
Define
and notSupported Use.
When reading the full text of relevant paper for categorized, we also captured the association
(through citation) between papers categorized as
Supported Use
and those categorized asDefine.
We also captured self-associations between papers categorized asDefine
in cases where a paperwas extending or modifying an existing (cited) definition.
In our corpus of 644 papers that used the phrase attack surface, 71% used the term without citing a definition; that is, they assumed the meaning of the term attack surface was well understood.
However, the term attack surface carried a variety of different meanings, with 48 definitions cited in
the remaining 29% of papers that provided a cited definition. Authors not providing support for their use of the phrase indicates a lack of understanding of the different possible definitions, or an
assumption that the audience of their paper have the same definition in mind. From the same data,
we see there are 48 papers categorized as
Define, or providing a definition of attack surface. These
48 papers provide 48 definitions of attack surface in the literature with varying degrees of overlapand authority. Many of these definitions are not themselves cited.
By contrast, 86 papers (or 13%) in our corpus provided
Supported Use, or a citation or a
footnote of their use of the phrase attack surface. These papers skewed towards security focusedworks. We observed that the more closely related the research was to the topic of attack surfaces,
the more likely it was that the researcher supported their definition of attack surface in some way.
2.2.2 Definition Granularity
In addition to categorizing the papers based on the usage of the phrase attack surface, we categorized papers in the
Define
andSupported Use
categories based on the granularity at which the phrasewas used. We used the following categories for the papers based on the granularity of phrase
usage[The18a]:
•
Function
- The paper uses the phrase attack surface with methods, functions or individuallines of code as the lowest unit of reasoning. For example, a paper that discusses the attack sur-face implications of allowing certain set of functions to be accessible through the Application
Program Interface (API).
•
File
- The paper uses the phrase attack surface as applied to source code files. For example,a paper that discusses the attack surface implications of having source code in certain files
•
Binary
- The paper uses the phrase attack surface with source code packages such as binaries,packages, modules or components. For example, a paper that presents different approaches to reduce the attack surface of a binary.
•
System
- The paper uses the phrase attack surface when reasoning about entire systems. Forexample, a paper that presents the security implications of enabling certain features in an
operating system such as Windows and Linux.
•
Computer Network
- The paper uses the phrase attack surface as applied to entire networks.For example, a paper evaluating the notion of isolating certain set of sensitive hosts to a sub-network, inaccessible, in general, to hosts outside of the network.
•
Theoretical
- The paper uses the phrase attack surface in a theoretical capacity. Papers thatare categorized into the Theoretical level of granularity typically attempt to quantify the attack
surface of an entity based on theoretical notions.
We also used
Theoretical
to categorize papers when we could not infer the granularity fromthe full text.
In our corpus, 352 of the 644 (or 55%) papers discussed attack surfaces at the
Theoretical
level, while 149 of the papers discussed the phrase at a Software
System
level. Only 41 papersdiscussed attack surfaces at a
Binary,
File, or
Function
level, possibly indicating that software development work represented a minority of the papers in our corpus. The high percentage oftheoretical uses of the phrase indicates that attack surfaces are still mostly considered a theoretical exercise, with limited number of researchers or practitioners in our corpus applying the concept to
a real software system or computer network.
2.2.3 Clusters of Definitions
The final stage in our SLR was to analyze, and cluster, various definitions of the phrase attack surface from the relevant papers categorized asDefine. For simplicity, we only considered those papers
that has at least one citation at the time of our study. Considering only papers that had at least one
citation resulted in 19 papers to place into clusters.
As with other manual steps, two authors independently analyzed each definition and assigned
it to an appropriate cluster. The clustering of definitions indicates the conceptual similarity among
one or more definitions. The authors generated their own clusters as a part of their individual clustering processes. After generating their own clusters and categorizing the definitions into those
clusters, the authors involved in the clustering phase met to discuss their respective clustering
2.2.4 Results
Upon analysis, we found six uniqueclustersof definitions, or definitions that carried the same or similar meaning to one another. The clusters are as follows:
• Methods:The attack surface is the methods of implementation, data channels, and data
present in the system, with no specific attack features mentioned.
TheMethodscluster is a programming-centric definition that focuses on program flow through
a software system. Such an attack surface could be measured by programs like GNU cflow or other static analysis tools for measuring connections through software systems.
• Adversaries:The attack surface is the union of all possible ways an attacker could cause damage
to a system.
TheAdversariescluster focuses on attacker behavior only, as only points in the system with
active attacks would be considered part of the attack surface. As an example to differentiate the
Methodscluster from theAdversariescluster, there could be entry points from theMethodscluster
that have no equivalent in theAdversariescluster due to a lack of feasible attacks.
• Flows:The attack surface is defined as data flow and control flow only, specifically considering external input and permissions when interacting with the system.
From the above definition, data flow is the order in which data is manipulated in a software
system, and control flow is the sequence in which individual commands are executed. TheFlows
cluster is based on external input. TheFlowscluster would be a subset of theMethodscluster, in
that some paths available in theMethodscluster may be unavailable to a subset of external actors.
TheFlowscluster attack surface could change as user authorization level changes.
• Features:The attack surface is a enumeration of all available attack avenues to a target system.
TheFeaturescluster is a higher level set of definitions that focus on the features available in a system at the level of functionality. The Features cluster differs specifically from the previous
definitions in that it encapsulates functionality in a system rather than the paths data takes through
a system. The Features cluster requires a specific enumeration of parts of the system that are possible attack features, such as a list of open ports, a list of services running by default, et cetera. The Features
cluster is distinct from the methods cluster, as specifics are left ambiguous in the methods cluster.
• Barriers:The attack surface is the method of preventing attacks, rather than the paths attacks
can occur on, by malicious parties.
TheBarrierscluster focuses on preventative efforts in security on a system, such as firewalls or
security policies. Barriers is independent from the other clusters as it focuses on defensive behavior,
rather than possible points of attack.
• Reachable Vulnerabilities:The attack surface is the vulnerabilities that are exposed to end
users via paths or flows, rather than the paths or flows themselves.
Finally, theReachable Vulnerabilitiescluster is focused on the exposure of vulnerabilities that
attackers can exploit in a software system. Using the Reachable Vulnerabilities cluster, a system with
no vulnerabilities does not have an attack surface.
We recommended that practitioners and researchers cite a definition from the cluster that
matches their use case for the term. We did not arrive at a singular definition of attack surface.
Future work in the area of attack surfaces may focus on providing different terminology for some of these clusters of definitions, so that the term attack surface is not as overloaded as it is today.
2.3
Discussion
Taking our own recommendation, we use theFlowscluster as the basis for our usage of the term attack surface for the rest of this document. RASA provides a set of code artifacts with empirical
evidence of previous crashes, meaning that the code on RASA is in use and accessible to users. RASA is independent of specific types of attacks, prevention methods, or the vulnerabilities themselves,
meaning it cannot use the definitions from the Adversaries, Barriers, or Reachable Vulnerabilities
clusters. The Methods cluster may be applicable, but RASA specifically considers end user behavior through the use of crash dump stack traces. Attacker behavior may also be considered applicable
to RASA as attackers sometimes crash systems they attack, but the relationship is not a direct
CHAPTER
3
RELATED WORK
In this chapter, we describe work related to the studies presented in this document.
3.1
Crash Dump Stack Traces
Analyzing crash dump stack traces to build profiles of software or identify defective code is an
active area of research. Castelluccio et al.[Cas17]developed an approach for grouping crash dumps together for easier analysis. Grouping similar crashes together results in less manual analysis for practitioners interested in crash data. The Castelluccio approach is deployed in Mozilla’s Crash
Reporting System.
Bianci et al.[Bia17]use crash data to generate tests designed to reproduce the failures the data represents. Their approach attempts to recreate the conditions of the crash based on the crash data
itself so the practitioner attempting to fix the issue can see it happen themselves.
Recent work in the area of crashes has focused on using crash dump data to reproduce the
behavior that led to the crash. Cui et al.[Cui16]built Retracer, an approach for reverse engineering the execution path from crash data. Understanding the execution path and the state of the system during the execution path can help practitioners fix issues. Chen et al.[CK15]developed an approach called Star, another approach for reverse engineering crashes using symbolic execution.
conse-quences for fixing both defects and security vulnerablities. The volume of recent work in the area of
crash dump reproduction speaks to the value of crash data when attempting to triage defects and vulnerabilities.
3.2
Vulnerability Prediction and Prioritization
Vulnerability Prediction Models (VPMs) are a subset of Defect Prediction Models (DPMs) e.g.[OY14; Tan15; Kam16]specifically on vulnerabilities in software. VPMs have traditionally performed worse than DPMs in literature, vulnerabilities are orders of magnitude more rare than regular defects[Woo14].
Neuhaus et al. [Neu07]found that vulnerabilities were unlikely to occur again in the same component, but components with the same or similar function calls and important libraries were
more likely to have vulnerabilities as well. The Neuhaus result runs somewhat counter to research in defect clustering, which suggests that defects are likely to occur together[Bet08; Men11]
Gegick et al.[Geg10]research the use of text mining in the security field, particularly locating security bug reports. Meneely et al.[MWa; MWb]explored how Linus's law affected the generation of security vulnerabilities. They explored developer activity metrics, or measures of how many
different teams and developers modified a specific piece of code. Meneely et al. made several findings
regarding the effect of developer activity metrics: 1) code modified by independent developer groups were more likely to have a vulnerability; and 2) files modified by nine or more developers were 16
times more likely to have a vulnerability than files changed by fewer than nine developers.
The VPM described by Zimmermann et al.[Zim10]is based on static code metrics, along with pre-and post-release vulnerabilities from Microsoft Windows. Metrics were collected from a Microsoft
system called CODEMINE[Cze13]. The CODEMINE system provides 29 software metrics, measuring the code churn in the software system, the complexity of the software system, and the organizational features of the team that built the software system. These metrics are treated as features in a Random
Forest[Bre01]classifier. They reported a median recall of 0.2 when using all available metrics, with a median precision of approximately 0.45. Rerunning the classifier while only using features from one of the subsets of metrics (code churn, code complexity, and organizational features) resulted
in higher and lower precision and recall numbers from run to run, but the reported figures varied
widely (from 0 to 0.4 for recall, and from 0 to 1 for precision). Zimmermann et al. recommended that users of the VPM use all available metrics.
Shin et al. [SW08; Shi11]focus on churn and complexity when predicting which parts of a codebase are likely to have vulnerabilities. Shin uses machine learning techniques, specifically linear discriminant analysis, Bayesian network modeling, and Random Forest, to build the prediction
models based on the features in Table 8.2. Their approach focuses on reducing the amount of code that needs to be inspected for security concerns. They achieved a reduction of 71% for Mozilla
found that a combined model using complexity, code churn, and developer activity metrics had
a recall of 0.71 and precision of 0.05. Using a Baysean Network approach, the same metrics had a recall of 0.72 and precision of 0.04.
Scandariato and Walden et al.[Hov16; Sca14; Wal14]developed an approach utilizing text mining to predict the location of vulnerabilities in code. Text mining for vulnerability prediction involves splitting source code into individual strings, or tokens, and determining if specific token
are correlated with vulnerable code. For example, instances of NULL could be indicative of potential
null pointer exceptions. The authors have made two replication sites available which informed our construction of a C/C++version of their approach[Scaa; Scab]. While the Scandariato and Walden approaches featured the best precision and recall scores of any documented VPM to date, questions
remain about the oracle used to evaluate their results. Scandariato and Walden used results from HP Fortify1, a security static analysis tool, to generate their Oracle. Previous work has shown that
static analysis tools, particularly for vulnerabilities, has a high false positive rate[Geg08; Geg10], calling the oracle into question.
3.3
Classifying Defects
The classification of defects and vulnerabilities has a long history in the research community. Un-derstanding the types of defects and vulnerabilities that are being predicted (or not predicted) by
specific prediction approaches informs the use case for each approach. Additionally, understanding
the benefits and drawbacks of individual approaches to defect and vulnerability prediction in terms of specific classifications can provide a way to further develop them. Chillarege et al. developed a
technique called Orthogonal Defect Classification (ODC) to develop classifications of defects[Chi92]. Podgurski et al.[Pod03]developed an automated approach for classifying defects using super-vised and unsupersuper-vised pattern classification and multivariate visualization. They group failures
with similar profiles to reduce the total number of unique reports from a software system.
Defect research in software engineering already considers the classifications of defects that occur in different types of software systems. Sullivan et al. compared defects that occur in databases
versus operating systems[SC92].
Li et al. profiled defect characteristics in open source projects[Li06]. They analyzed over 29,000 bugs in open source software systems from two large open source software projects. They found
that the memory-related bugs has decreased as better tooling for these types of bugs have become
available, that some simple memory-related bugs are still present, possibly due to carelessness, and that semantic bugs are the primary root cause of the bugs in their dataset. Additionally, they found
that security bug rates are increasing, and the majority of security bugs have severe impact ratings.
3.4
Classifying Vulnerabilities
In vulnerability classification literature, researchers have mostly focused on whether code can be
classified as vulnerable or not[The15c; The17; MM16; Shi11; Zim10; Sca14].
Austin et al.[AW11]performed a comparison of vulnerability detection techniques and found that a single approach was not sufficient for vulnerability coverage. Austin’s work informs the need
for a vulnerability dataset that not only considers a binary classification of vulnerabilities, but also a
classification process for vulnerabilities.
The Common Weakness Enumeration (CWE)2maintained by MITRE provides guidance on
types of vulnerabilities practitioners may experience. They provide several summaries of the most
dangerous and prevalent vulnerabilities, including Top 25 lists of the most dangerous types of vulnerabilities.
The Common Vulnerability Scoring System (CVSS)3is a published standard used by many
organization to quantify the impact of vulnerabilities on specific organizations and the community. CVSS is on its third iteration, and the site features a calculator for practitioners to use to generate
scores, along with a user guide and examples of the classification and rating process.
The National Vulnerability Database (NVD) maintained by the National Institute of Standards
and Technology (NIST)4makes use of CWE classifications and CVSS scores as part of their database
of publicly disclosed vulnerabilities. CWE classifications are a part of each publicly reported vul-nerability in the NVD. Each vulvul-nerability in the NVD is also assigned a CVSS score as part of the
disclosure process. NVD also reports which particular version of a software product is affected by
the issue, how the issue was discovered, and links to the fix for the vulnerability if available. Incorporation of the previous three standards and databases into vulnerability research could
help practitioners better understand the strengths and weakness of various approaches to
vulnera-bility prioritization and prediction.
3.5
Attack Surface
In this section, we describe both research on attack surface concepts and tools using the attack
surface concept.
3.5.1 Attack Surface Research
Manadhata et al.[MW11]provided one of the earliest measures of attack surfaces in software systems, focusing on entry and exit points. Geer uses the attack surface concept to determine relative risk
measures to the software system[GJ11]. The more exposed a part of a software system is, and the greater the value of the target asset an attacker may be after, the greater the risk factor for the software.
Zhang et al.[Zha15]used package dependencies to determine the attack surface of package based systems.
Research efforts into the configuration definition of attack surface include Heumann et al.’s
work on the attack surface indicator (ASI) metric[Heu10]. ASI is an aggregation of several metrics of web applications that affect the attack surface, such as URL parameters, file upload fields, search fields, and number of domains. ASI provides a picture of the deployed application’s attack surface
rather than the software system itself. For example, if a single web application was deployed on
multiple different servers, various configuration permutations for an application could result in two completely different ASI values for the software system.
In related domains such as networks and power grids, researchers look for ways to limit the
exposure of critical infrastructure using the attack surface concept[FG15].
Work in the area of attack surfaces sometimes takes the form of minimizing the attack surface to
limit the areas that need to be tested or reviewed for security issues. Geneiatakis et al.[Gen15]focused on minimizing the attack surface of databases. They minimize the attack surface by randomizing SQL databases and providing APIs for legitimate users to access data while making attacker access
to the database prohibitively difficult.
Zhang et al.[Zha18]developed an approach for reducing the attack surface of an operating system kernel. Their approach, called KASR, reduces the attack surface of a system via two steps.
KASR is part of a hypervisor on the system running a particular software package. First, KASR removes execution permissions from unused, or dead code. Second, KASR places active code in
separate “segments” and actives each segment as required by the execution of the software package.
KASR found particular success running on the Linux kernel, where it prevented six known kernel rootkits with minor impacts to system performance compared to a standard hypervisor.
While many approaches exist for approximating or reducing the attack surface of software
systems, the generation of a complete attack surface for large software systems remains an open question.
3.5.2 Attack Surface Tools
Tools like Microsoft’s Attack Surface Analyzer5provide practitioners an understanding of the attack
surface of their specific installation of the Windows operating system. Attack Surface Analyzer informs users what ports are open, what services are running on their machine, the state of
permis-sions on their machine, among other attack surface measurements. Unlike many approaches in
the research literature, Attack Surface Analyzer focuses on the configuration of specific instances of
Windows rather than a code-level understanding of the attack surface. Attack Surface Analyzer may find a million different attack surfaces for a million different instances of Windows, depending on
the state of the ports, services, and permissions on the systems.
Anvil Ventures described an early prototype of a Python-based approach for measuring changes in the attack surface of Linux systems6. The command line tool is run once to establish a baseline
attack surface of the system, and then can be subsequently run to determine deviations from the
baseline that was established previously. The tool,Dawgmon, can currently detect changes in open ports and services on the system.
While not a tool, OWASP provides a set of guidelines for analyzing the attack surface of a software
system7. The cheat sheet provides additional feedback on measuring attack surfaces in a web application environment, such as web forms and APIs. OWASP asks the user to consider three
questions when adding and removing features from a system:
• What has changed?
• What are you doing different?
• What holes could you have opened?
The guidelines provided could provide a framework for an attack surface tool specifically geared
towards web applications or APIs.
CHAPTER
4
RISK-BASED ATTACK SURFACE
APPROXIMATION
Risk-based attack surface approximation (RASA) is an automated approach to identifying parts of
the system that are on the attack surface of a software system. RASA identifies an approximated
attack surface by analyzing crash dump stack trace data from the target system. We hypothesize that stack traces from user-initiated crashes have three desirable attributes for measuring attack surfaces:
(a) they represent user activity that puts the system under stress; (b) they include entry points to the
software system; and (c) they provide automatically generated control and data flow graphs. We call our approach anapproximationbecause code entities will only be added to the attack surface when
a crash has occurred. We include the termrisk-basedbecause RASA is an efficient means of finding
the part of the software system that is most susceptible to containing vulnerabilities, as it identifies code that has already been shown to have data flow and control issues via the fact that it appears in
a crash. We assess our approach by analyzing the percentage of actual reported vulnerabilities in
the code and whether they occur in our approximated attack surface.
In this chapter, we motivate the need for RASA, describe why an approximation of the attack
surface is desirable, how an approximation of the attack surface is accomplished, why we refer to
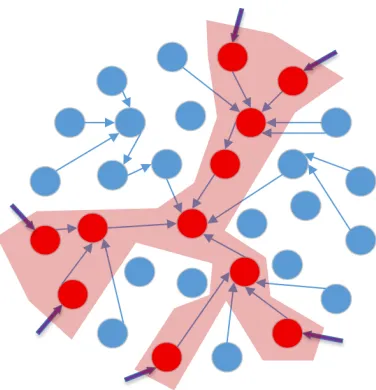
Figure 4.1A graph representation of the attack surface of a software system. Blue nodes represent code that does not appear on the attack surface, while red nodes indicate code on the attack surface.
4.1
Motivation
Vulnerabilities in software are an unfortunate, but inevitable, reality. As a result, software
devel-opment organizations must take a proactive approach to security. The Trustworthy Computing Security Development Lifecycle (SDL) introduced at Microsoft in 2004[Lip04]is one such instance of a proactive approach to software security. One of the elements in the design phase of SDL is
the measurement of the attack surface of software. At the time, the phrase attack surface was new, having been introduced only a year earlier by Michael Howard[How03].
Howard described the attack surface as a measure of “attackability” of a software system, along three dimensions: targets and enablers, channels and protocols, and access rights. Geer[GJ11] explores the concept of limiting attack vectors using the example of two PDF readers: Adobe Reader
and Foxit Reader. Both Adobe Reader and Foxit Reader reduce their attack surface by making document reader functionality available via plugins, which can be disabled by users if they are not
currently using that feature.
Some examples of resources that comprise a system’s attack surface include the following: open ports, services available on the inside of the firewall, code that processes incoming data, and user
interface forms and fields[Man06]. An attacker can use these attack vectors to attack a software system. Practically, some of these attack vectors must be left open for software to function for users. Knowing the attack surface of a piece of software supports decision-making during all phases of
4.2
Why Approximation?
To date, approaches for empirically measuring the attack surface of software systems have relied
on manual effort or on alternative definitions of the attack surface. As valuable as the concept
of attack surface is, we lack a practical means of identifying source code in the software system that is on the attack surface and, therefore, accessible to end users. Manadhata[MW11]proposed metrics to measure attack surface size and empirically measured entry and exit points by building
a call graph, but left identifying the code artifacts between entry and exit points for future work. Other approaches to defining the attack surface have been done at a configuration level without
considering code[BM15; How04], and other approaches by Manadhata et al. using API calls have required significant manual work to accomplish[Man06].
RASA, as an empirical metric-driven approach via crash dump stack trace data, is well suited for
approximating the attack surface in environments where generation of a full call graph is infeasible.
Using an approximation of the attack surface, practitioners can still benefit from a better understand-ing of code that appears on the attack surface, even if that understandunderstand-ing is incomplete. Buildunderstand-ing an
approximation of the attack surface of a software system provides practitioners with information about where security effort should be focused in a software system. For experienced security teams,
an approximation of the attack surface can inform their understanding of their system’s entry and
exit points. For example, security testing could not focus on areas that the approximation indicates is not an on the attack surface, while also suggesting areas of the codebase that tests should be
written for. For inexperienced teams, an initial approximation of the attack surface of their software
system could inform where the first set of security tests or review efforts should take place.
The attack surface of a software system can be considered a subset of a call graph of the system,
as highlighted in Figure 4.1. As additional binaries, files, and functions are added to a software
system, the complexity of creating a complete call graph of the system grows exponentially. Tools for call graph generation like GNU Cflow1have difficulty generating call graphs for systems once
they reach file sizes in the thousands or tens of thousands. Mozilla Firefox has approximately 50,000
total source code files as of May 2018, and cannot run GNU Cflow without excluding large portions of the software system, fundamentally breaking the call graph. Without a call graph for the target
system, building a complete picture of the attack surface is not feasible.
Therefore, RASA’s crash dump stack trace based approach has several advantages for scalability and usability. RASA can be computed in a few seconds after the collection of crash dump stack
trace data. RASA is programming language agnostic, and has no issues moving between different languages. GNU Cflow, on the other hand, is limited to C and C++code. If we want to consider the attack surface of very large systems (e.g. Mozilla Firefox or Microsoft Windows), then we must
offer methods that can be practically applied to large software systems during the development
process. Existing approaches for attack surface measurement, such as the approaches proposed by
Younis and Manadhata[MW11; You14], do not provide code-level insights past entry and exit points of the software system measured. If we want to use knowledge of the attack surface to guide the
prioritization of code-level vulnerability location and removal, we must be able to identify code in
all parts of the software system, not just entry and exit points.
Because we are approximating the attack surface using empirical metrics, we are not building a
full understanding of the attack surface of the software system, or a complete attack surface. We
consider RASA to be a subset of the complete attack surface, because the knowledge that the code on RASA has crashed at least once is empirical evidence that the code is part of the complete attack
surface. If code was not part of the attack surface of the system, it would not be possible for it to
crash after outside input to the system.
Identifying RASA for a software system is, as described earlier, resource efficient compared to
identifying the complete attack surface of a software system. Parsing crash data is a string
manip-ulation problem, and computers can parse crash dump stack trace data more efficiently than it can build a call graph of the entire software system. Building an understanding of the call graph
of a software system from crash data requires significantly less resources, as further described in
Chapter 9.
4.3
Crash Dump Stack Traces
To build our approximation of the attack surface of a software system, we use crash dump stack trace data to build a partial call graph of the target system. A crash occurs when software stops
functioning properly and exits. The software may exhibit a variety of different anomalous behaviors,
including hanging, freezing, or causing fatal system errors. Crashes can occur for a variety of reasons, including incorrect addressing to the program counter of a machine, a buffer overflow error, an
unhandled exception. Some crashes could be exploited by malicious end users to execute arbitrary
code, launch privilege escalation attacks, or exfiltrate data from the system.
Data contained in crash dumps may provide useful information to security practitioners looking
to prevent attacks. For example, attackers sometimes use crashes to find possible weaknesses in
the target system. If an attacker can consistently cause a program to crash, they can find important forensic information about the system properties at the time of the crash, such as what code was
running and what the state of the registers was at the time of the crash. If the crash is readily
repeatable, the crash could be considered a Denial of Service (DoS) attack in itself.
To identify artifacts that may be reached and thus exploited from users, we use stack traces from
crash data, or crash dump stack traces, to identify code artifacts involved with the crash. Stack traces identify code that was loaded in memory at the time of the crash. Typically used for debugging,
in crash dumps identify code artifacts that were executed prior to the crash taking place. The order
of lines, or frames of code artifact in the crash represent the sequence of code artifact calls. The initial entry point is typically the top line item on a stack trace, and should in most cases be the
first artifact touched by external input. Consecutive lines in a stack trace identify code artifacts that
called each other. If a function in foo.cpp calls a function in bar.cpp, we say that there is a direct neighbor relationship from foo.cpp to bar.cpp. The direct neighbor relationship is indicated in a
crash dump stack trace by foo.cpp occurring directly before bar.cpp.
Through the parsing of the stack traces generated from a crash, we can build a listing of the artifacts that external input can access. Our hypothesis is that the subset of code appearing in crash
dump stack traces is more likely to have exploitable security vulnerabilities than code that does
not appear in crash dump stack traces. Malicious users can only exploit vulnerabilities that they can access. If a bad check on incoming data could result in a buffer overflow attack in a specific
function, but no outside user can ever pass input to that bad check, then that vulnerability is not
exposed to end users unless code or configuration changes cause it to be exposed.
4.4
Risk Based
Identifying the “riskiest” code in a software system is beneficial from a prioritization perspective, because testing and review efforts can be focused on those parts of the system. The concept of
risk is common outside of software engineering as well, and is a good avenue to guide discussion
regarding how security vulnerabilities effect a product overall. Linacre et al.[Lin05]produced the Venn diagram in Figure 4.2 illustrating the relationship between a vulnerability, the consequences of
the vulnerability, and the threat posed by the actors on the vulnerability. This model of vulnerability
can be applied not only to security vulnerabilities, but vulnerable parts of any system.
If a high percentage of discovered vulnerabilities are on RASA and the computation resources
requirement of RASA is much lower than that of the complete attack surface, we can consider RASA
a risk-based attack surface approximation because it is an efficient means of identifying the part of the attack surface that is most susceptible to containing exploitable vulnerabilities, despite being
a subset of the complete attack surface of the system. Code that has historical crashes can also
be considered riskier than code that has not crashed, because we have empirical evidence that the code artifacts on the stack traces in those crashes have errors, otherwise the crash would not
have occurred. We also have empirical evidence that the code appearing on crashes is accessible
to outside input, otherwise it would not have appeared on a crashing frame. This combination of density of vulnerabilities, probability of errors, and accessibility creates an environment where