Original Research Article
Maternal and perinatal outcome in pregnancy with high BMI
Pallavi Singh*, Rekha Wadhwani
INTRODUCTION
A healthy foetus from a healthy mother, was coined by Sir Juleus Huxley. The global safe motherhood initiative launched in 1987, is Designed to improve antenatal care and councelling throughout the world. Nutritional status of a women in her pregnancy is one of the main modifiable factors influencing pregnancy and perinatal outcome.1
BMI, body mass index is an important predictor of nutritional status of pregnant woman which has been
considered as an important prognostic indicator of pregnancy outcomes. High maternal body mass index is related to adverse pregnancy outcomes such as preeclamsia, gestational hypertension, pre-and post-term delivery, induction of labour, macrosomia, caesarean section and post-partum haemorrage.
BMI, body mass index, or quetelet index is a value derived from the weight and height of an individual. The BMI is defined as the body mass divided by the square of the body height, and is universally expressed in units of kg/m2, resulting from mass in kilogram and height in
ABSTRACT
Background: BMI, body mass index is an important predictor of nutritional status of pregnant woman which has been considered as an important prognostic indicator of pregnancy outcomes. High maternal body mass index is related to various adverse pregnancy outcomes. This study is designed to see the effect of maternal BMI on pregnancy outcome and perinatal outcome.
Methods: this is a prospective hospital based study conducted from January 2015 to June 2015 in department of Obstetrics and Gynecology, Sultania Zanana Hospital, Bhopal, India. 20 Antenatal women attending OPD in Sultania Zanana hospital randomly selected for the study in their first trimester in their first visit fulfilling inclusion criteria. Their consent for the study was obtained.
Results: It was observed that majority of morbidly obese (66.6%) and obese (47.6%) women were belonging to upper
socioeconomic class. Obesity is associated with increased incidence of pre-eclampsia, gestational hypertension, gestational diabetes, induced delivery, Instrument/assisted deliveries, caesarean delivery, ICU admissions complicating maternal outcome and LGA, NICU admissions and perinatal mortality complicating perinatal outcome.
Conclusions: Maternal BMI shows strong associations with pregnancy complications and outcomes. Obesity is associated with increased incidence of pre-eclampsia, gestational hypertension, gestational diabetes, induced delivery, Instrument/assisted deliveries, caesarean delivery, ICU admissions complicating maternal outcome and LGA, NICU admissions and perinatal mortality complicating perinatal outcome.
Keywords: Abnormal uterine bleeding, Body mass index, Intensive care unit, Large for gestational age, Neonatal intensive care unit, Post-partum hemorrhage, Small for gestational age
Department of Obstetrics and Gynecology, Gandhi Medical College, Bhopal, Madhya Pradesh, India
Received: 19 May 2017
Accepted: 02 June 2017
*Correspondence:
Dr.Pallavi Singh,
E-mail: pal.dr.84@gmail.com
Copyright: © the author(s), publisher and licensee Medip Academy. This is an open-access article distributed under the terms of the Creative Commons Attribution Non-Commercial License, which permits unrestricted non-commercial use, distribution, and reproduction in any medium, provided the original work is properly cited.
metres. The BMI is an attempt to quantify the nutritional status of an individual, and then categorize that person as underweight, normal weight, overweight, or obese based on that value.2
During the last two decades, there has been an alarming rise in the incidence of obesity all over the world. The National Family Health Surveys (NFHS) in India indicated an increase in the obesity from 10.6% in 1998– 1999 to 14.8% in 2005-2006, while there was only a marginal decrease in the incidence of underweight from 36.2% (1998-1999) to 33.0% (2005-2006).3
METHODS
The present study titled is a prospective hospital based study conducted from January 2015 to June 2015 in Department of Obstetrics and Gynecology, Sultaniazanana Hospital Bhopal, India. Antenatal women in their first trimester in their first visit to OPD insultaniazanana hospital. 205 antenatal women attending OPD in sultaniazanana hospital were taken into the study. Data collected using pre- designed Proforma.
Exclusion criteria
• Antenatal women in their first visit in their first trimester of pregnancy.
• singleton pregnancy
Antenatal women attending OPD in Sultania Zanana Hospital, 205 randomly selected for the study in their first trimester in their first visit fulfilling inclusion criteria. Their consent for the study is obtained. Then they are allocated for the study. BMI, body mass index of these antenatal women calculated using formula3
BMI= weight kg/ height m2
The women were categorized into five groups according to their BMI as follows (on the basis of the WHO and the National Institute of Health guidelines):4-5
• Normal (group II): BMI 18.50-24.9 kg/m2
• Overweight (group III): BMI 25-29.9 kg/m2
• Obese (group IV): BMI 30-34.9 kg/m2
• Morbidly Obese (group V): BMI greater than 35 kg/m2.
• The group with normal BMI (18.50 - 24.9 kg/m2)
was used as reference group for the analysis.
Follow up
Women were followed in their subsequent visits in relation to any complication developed during pregnancy and and perinatal outcome. Women were given green strip cards to be brought in further visits for their identification.
RESULTS
Table 1 shows comparison between socio economic status and BMI. It is seen that amongst 3 morbid obese patients, 2 belong to upper class I (66.6%) Among obese 47.6% belonged to upper class.
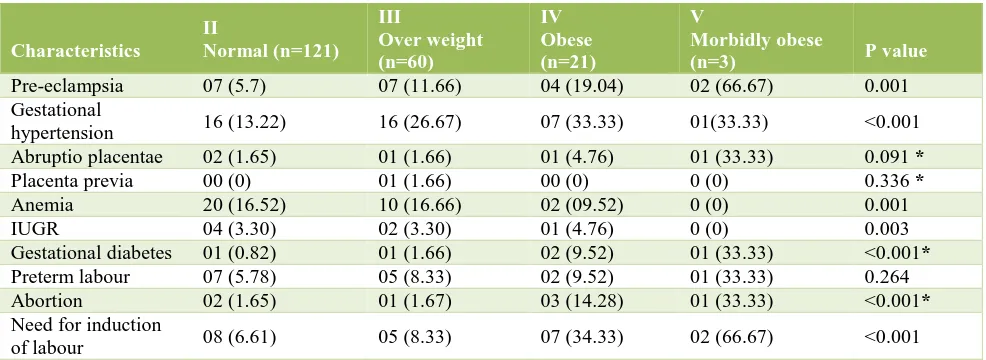
[image:2.595.55.546.547.694.2]As observed in above table highest percentage of pre-eclampsia (66.67%) was seen in women in category of morbidly obese (V) BMI and was found to statistically significant (p=0.001). It is also seen that BMI and pre-eclampsia shows linear trend. As BMI decreases the percentage of pre-eclampsia also decreases as evident from Table 2.
Table 1: Comparison of socio-economic status and BMI.
Normal (n=121)
Over weight (n=60)
Obese (n=21)
Morbid obese (n=03)
Socio- economic status
Upper class I
Number 16 07 10 02
% 13.2 11.6 47.6 66.6
Upper middle class II
Number 59 18 08 01
% 48.7 30.0 38.0 33.3
Lower middle class III
Number 39 31 02 00
% 32.2 51.6 9.5 0
Upper lower class IV
Number 07 04 01 0
% 5.8 6.6 4.7 0
Lower class V
Number 0 0 0 0
% 0 0 0 0
When BMI was compared with gestational hypertension it is found that as BMI increases, the percentage of gestational hypertension also increases. Amongst 21
Table 2: Comparison between BMI and pregnancy outcome.
Characteristics
II
Normal(n=121)
III
Overweight
(n=60)
IV Obese (n=21)
V
Morbidlyobese
(n=3) Pvalue
Pre-eclampsia 07 (5.7) 07 (11.66) 04 (19.04) 02 (66.67) 0.001 Gestational
hypertension 16 (13.22) 16 (26.67) 07 (33.33) 01(33.33) <0.001 Abruptio placentae 02 (1.65) 01 (1.66) 01 (4.76) 01 (33.33) 0.091 *
Placenta previa 00 (0) 01 (1.66) 00 (0) 0 (0) 0.336 *
Anemia 20 (16.52) 10 (16.66) 02 (09.52) 0 (0) 0.001 IUGR 04 (3.30) 02 (3.30) 01 (4.76) 0 (0) 0.003 Gestational diabetes 01 (0.82) 01 (1.66) 02 (9.52) 01 (33.33) <0.001*
Preterm labour 07 (5.78) 05 (8.33) 02 (9.52) 01 (33.33) 0.264 Abortion 02 (1.65) 01 (1.67) 03 (14.28) 01 (33.33) <0.001*
Need for induction
of labour 08 (6.61) 05 (8.33) 07 (34.33) 02 (66.67) <0.001
Figures in parenthesis indicates percentage
Maternal outcomes like Abruptio placentae and placenta previa does not show any statistical significance with BMI. Although in morbidly obese patients the prevalence of abruptio placentae was seen in 33.3%.
[image:3.595.51.543.423.485.2]Percentage of Gestational Diabetes, preterm labour and Abortion is mostly seen amongst obese and morbidly obese patients and is found to be highly statistically significant with p <0.001.
Table 3: Comparison between BMI and mode of delivery.
Mode of delivery II
Normal (n=121)
III Over weight (n= 60)
IV Obese (n= 21)
V
Morbidly obese (n= 3)
[image:3.595.52.543.516.591.2]Vaginal 72 (59.50) 29 (48.33) 10 (48.61) 01 (33.33) LSCS (Total) 31 (25.61) 16 (26.67) 07 (33.33) 02 (66.67) Instrumental/assisted 18 (14.87) 15 (25.00) 04 (19.04) 00 (0)
Table 4: Comparison between BMI and pregnancy outcome (post-partum).
Pregnancy outcome (early post-partum)
II Normal (n=121)
III Over weight (n= 60)
IV Obese (n= 21)
V
Morbidly obese (n= 3)
P value
[image:3.595.53.543.620.708.2]PPH 07 (5.78) 03 (5.00) 03 (14.28) 01 (33.33) 0.068 Infections 07 (5.78) 05 (8.33) 03 (14.28) 00 (0) 0.101 ICU admission 05 (4.13) 04 (6.67) 05 (23.80) 01 (33.33) <0.001
Table 5: Comparison of BMI and perinatal outcome.
Perinatal outcome
II
Normal (n=121)
III Over weight (n= 60)
IV
Obese (n=21) V
Morbidly obese (n=3) P value
SGA 04 (3.30) 02 (3.33) 01 (4.76) 0 (0) <0.001 LGA 02 (1.65) 04 (6.66) 04 (19.04) 01 (33.33) <0.001*
Preterm 07 (5.78) 05 (8.33) 03 (14.28) 0 (0) 0.264 NICU admission 05 (4.13) 04 (6.66) 02 (09.52) 01 (33.33) 0.026 Perinatal Mortality 01 (0.82) 01 (1.67) 01 (4.76) 01 (33.33) 0.024*
As observed in Table 3 which shows different modes of delivery and their comparison between different BMI
morbidly obese patients (66.67%). Comparison of LSCS and BMI shows linear trend of increasing. Table 4 explains comparison of BMI and pregnancy outcome partum) amongst patients. As observed PPH (post-partum hemorrhage) is mostly seen amongst obese (14.28%) and morbidly obese category (33.33%). While infections (either LSCS wound/episiotomy or other) is also common in obese category (14.28%). LGA was found in Morbidly obese category (33.33%), followed by 19.04 % in obese, 6.66% in overweight. LGA shows linear decreasing trend with BMI and is highly significant (p<0.001). As BMI decreases, percentage of LGA babies decreases. Perinatal outcome in terms of NICU admission and perinatal mortality was also significantly higher in high BMI group.
DISCUSSION
Comparison of pregnancy outcomes in different studies
Preeclamsia
In present study pre-eclampsia, as maternal outcome was majorly seen in obese (19.04%) and morbidly obese (66.67%) with p value of 0.001. In another study carried out by Dasguptaet al showed 55.5% of pre-eclampsia in morbidly obese.4 Also a study by Bhattacharya S et al it
was found to be 28.2% with p value <0.05.5 In obese the
percentage in present study was 17.07 % compare with 14.7 % and 12.2 % (Bhattacharya S et aland Yazdani S et al respectively).5,6 In present study as well as other
studies above, preeclampsia was found to be statistically significant with women with raised body mass index.
Gestational hypertension
Present study shows increase in percentage of gestational hypertension with increase in BMI (p value 0.001) Maximum was seen in 33.33 % in obese and morbidly obese compared with study by Dasgupta, et al( 71.4%).4
Other studies by Bhattacharya S et al and Verma A et al the percentage was 42.2 and 30.7 respectively with p value <0.05 and 0.01.5,7 Gestational hypertension in
underweight in present study was found to 11.8% while in study by Bhattacharya S et al it was 13.6% and least 1.8% in study by Demont-Heinrich C et al.8
Need for induction of labour
In present study Induced labour as maternal outcome was mostly seen in Morbidly obese category (66.6%) with p value <0.001 which is highly significant. When we compare present study with other studies, the percentage of induced labour in almost every study in morbidly obese was high with p value statistically significant. Dasgupta et alfound 64.2% induced labour in morbidly obese, while Yazdani S et al, Bhattacharya S et al, Demont-Heinrich C showed 50%, 49% and 41.4% respectively.4,5,8
Gestational diabetes
Gestational Diabetes in present study was seen in obese (9.52%) & morbidly obese with 33.3% and found to be statistically significant (p<0.001). Similar studies showed the percentage of 23 (p<0.001) and 7.5 (p<0.05) by Verma A et al and Demont-Heinrich C et al. In underweight no prevalence of gestational diabetes was seen. While studies carried by Demont-Heinrich C et al and Pakniat H et al showed 1.4% and 1.1%.9
Preterm labour
Present study shows no significance of Preterm labour and BMI with maximum percentage is seen in morbidly obese group (14.28%) followed by obese (9.52%). Other studies by Bhattacharya S et al, Kalk P et al and Demont-Heinrich C et alshows statistical significance.5,8,10
Abortions
Abortions in present study is majorly seen in obese (14.28%) and morbidly obese group with 33.3% (p<0.001) while in another study by Dasgupta A et al shows no women in morbidly obese group with abortion.4
Caesarian section
In present study, women underwent LSCS were more in morbidly obese 66.6% followed by obese in 33.3%. Study by Bhattacharya S et al it is seen in 42.7% and 30.8% in morbidly obese and obese.5 Other studies by
Yazdani S et al, Verma A et al, Demont-Heinrich C et al and Dasgupta A et al in morbidly obese who underwent LSCS were 7.6%, 69.2%, 51.4% and 68.7% respectively.
Thus, most of studies showed relationship between raised BMI and LSCS. Also, instrumental/assisted delivery in present study was most seen in morbidly obese (28.57%), while in study by Bhattacharya S et al it is seen in 24.2%. Other studies by Verma A et al showed no women required assisted/instrumental delivery in morbidly obese BMI group, while in a study by Dasgupta A et al it was seen in 37.5%.
Post-partum haemorhage
In early post-partum period, PPH in present study were seen in morbidly obese (33.3%). A similar study by Verma A et al showed no women with PPH in morbidly obese group. A study by Dasgupta A et al showed 31.6% PPH in morbidly obese group.4
Perinatal outcome in different studies
LGA
Large for gestational age (LGA) in present study was seen predominantly in obese (19.04%) and morbidly obese (28.57%) with p value<0.001 and was statistically significant. Similar studies carried out by Verma A et al and Demont-Heinrich C et al showed that LGA in morbidly obese BMI was seen in 23% and 14% respectively with statistical significance.7,8 Present study
shows no LGA as perinatal outcome in underweight while another study by Kalket P et alshowed 7.8% LGA in underweight BMI category.10
CONCLUSION
Obesity and is a leading, preventable cause of mortality worldwide and it is one of the most serious public health problems of the 21st century. Maternal BMI shows strong associations with pregnancy complications and outcomes. Obesity is associated with increased incidence of pre-eclampsia, gestational hypertension, gestational diabetes, induced delivery, Instrument/assisted deliveries, caesarean delivery, ICU admissions complicating maternal outcome and LGA, NICU admissions and perinatal mortality complicating perinatal outcome. Therefore, we advise pregnant woman to gain a normal BMI before and during pregnancy, with advice of their dietitian and doctor prior to getting pregnant. Thus, the health of women throughout their child bearing years should be addressed, to improve the pregnancy and the perinatal outcomes. Therefore, education programs, health services and nutrition consultation are recommended for women in reproductive age.
Funding: No funding sources Conflict of interest: None declared
Ethical approval: The study was approved by the Institutional Ethics Committee
REFERENCES
1. Institute of Medicine (US) Committee on Nutritional Status During Pregnancy and Lactation. Nutrition
during pregnancy. Washington (DC): National Academies Press (US); 1990.
2. Garrow JS, Webster J. Quetelet's index (W/H2) as a measure of fatness. Int J Obesity. 1984;9(2):147-53. 3. National Family Health Survey (NFHS-3) India
2005-2006. Available at http://rchiips.org/NFHS/factsheet.shtml
4. Dasgupta A, Harichandrakumar KT, Habeebullah S. Pregnancy outcome among obese indians–a prospective cohort study in a tertiary care centre in South India. Int J Sci Stud. 2014;2(2):13-8.
5. Bhattacharya S, Campbell DM, Liston WA, Bhattacharya S. Effect of body mass index on pregnancy outcomes in nulliparous women delivering singleton babies. BMC Public Health. 2007 Jul 24;7(1):168.
6. Yazdani S1, Yosofniyapasha Y, Nasab BH, Mojaveri MH, Bouzari Z. Effect of maternal body mass index on pregnancy outcome and newborn weight. 2012;5:34.
7. Verma A, Shrimali L. Index maternal body mass and pregnancy outcome. J Clin Diagn Res. 2012;6(9):1531-3.
8. Christine Demont-Heinrich et al. The association of prepregnancy body mass index and adverse maternal and perinatal outcomes; colorado department of public health and environment. Health Statistics Section, Colorado Department of Public Health and Environment; 2009.
9. Pakniat H, Movahed F. Association between body mass index and weight gain during pregnancy with preterm delivery. J Qazvin Uni Medic Sci. 2013;17(3):12-9.
10. Kalk P, Guthmann F, Krause K, Relle K, Godes M, Gossing G et al. Impact of maternal body mass index on neonatal outcome. Eur J Med Res. 2009;14(5):216.
Cite this article as: Singh P, Wadhwani R.Maternal and perinatal outcome in pregnancy with high BMI. Int J Reprod Contracept Obstet Gynecol