Volume 5, No. 6, July-August 2014
International Journal of Advanced Research in Computer Science
RESEARCH PAPER
Available Online at www.ijarcs.info
Mining RoboCup Log Files to Predict Own and Opponent Action
Maryam Karimi, Marzieh Ahmazadeh
Dept. of Information Technology Shiraz University of Technology
Shiraz, Iran
Abstract:RoboCup is an international research aimed at improving artificial intelligence and robotics. It is a standard issue to get a wide range of technologies together and obtain new achievements. In 2D simulation league, after each game, server saves a log that contains all information about the game. By using data mining techniques knowledge can be discovered from this massive data. In this research we aimed to extract ball and player positions from log files and pre-process this data to specify some information including the action that have been taken place, start point, and involving players, etc. We mined this data to predict own and opponent action using C4.5 algorithm. The result showed that after applying our method the goal scoring was increased 251.39% with 64.13% confidence interval (with alpha = 0.1).
Keywords:RoboCup, data mining, classification, C4.5, log processing
I. INTRODUCTION
RoboCup is an international research initiative that is an effort to improve artificial intelligence, machine learning, robotics research and robotic intelligence. It is a standard issue to get a wide range of technologies together, examine them and obtain new achievements [1], [2], [3]. RoboCup has a rapid development in recent years. Football game is the topic of most leagues because of its complex characteristics, with the main objective of a competition between humans and robots in the year 2050 [2], [4]. There are different leagues in RoboCup champions such as simulation2D, small size robot, humanoid and etc. 2D simulation league is one the most important games in RoboCup. There are 11 autonomous players and a coach for each team and one ball, simulating the real football game and environment. Each player is a distributed agent that should respond in real time, inaccurate, complex and multi agent system, with limited communication with other players. Players‟ decision making can only be done based on present situation information, but a player can use its experience to predict opponent behavior. Player can estimate that which action could be done successfully in the present state, and then it will be able to choose the proper behavior which leads to better result. Each game lasts 6000 cycles (about ten minutes) and after each game server saves a log that contains all information about ball, players, etc. in each cycle. Logs can be reviewed by developers in order to analyze the game, debug the code and explore probable problems to improve the actual play. All this is done manually by developers which take a lot of time and energy. Using data mining approach, one will be able to process this data very quickly. Log files gather information about ball position, velocity and decay, and also player type, position, velocity, decay, body direction, head direction, stamina (energy), recovery and other information [1].
In other words, using data mining can help to analyze and process log files and produce useful and easily understandable information and patterns from a large amount of data [1], [5], [6], [7], [8]. Data mining has been used in different fields such as marketing, fraud detection, hospitals, banks, municipalities, information systems, operational processes, x-ray machines, web services, etc. [5]. Before
doing data mining, selection, pre-processing and transformation should be done. In selection phase we omit meaningless and unimportant fields by using domain knowledge, while in pre-processing phase aggregate data, changing the scale, stable data, sampling and coding will be done. In transformation phase, data will be normalized and standardized. At this stage, data is ready to be mined and we go to the main step that is using data mining algorithms to extract data and find patterns. Finally evaluation interpretation, visualization and knowledge representation should be done [1], [9].
action in each situation. Then trees are being presented and analyzed.
II. PREVIOUS WORKS
In this section we review some of the papers that have done data mining on different fields in RoboCup.
One of the techniques that had been used for extracting and comparing models for multi-agent robotic system behavior is called process mining. This technique is used in “analyzing multi-agent activity logs using process mining techniques” [5] in which Mining XML is used to read and create robot and team logs in small size league (which is different from logs in soccer2D league), based on state changes. Heuristics Miner, calculate frequency of changing roles and formations, used to build model for actions (tactics). Weka software was used to discover team formation system rules and analyze it with 10-fold cross validation with 68% accuracy. Process mining gains a better insight into multi agent systems behavior.
“No-feature selection”, “gain-feature ranking”, “principal component” & “correlation-base feature selection” has been evaluated in “evaluating feature selection techniques in simulated soccer multi agents system” [10]. Shooter and goalkeeper are used for selecting data set. Samples include ten features: ball, goalkeeper and shooter positions, velocity, distance, neck and body angle. The shoot, results in scoring a goal by player or catching the ball by goal keeper. In this paper, accuracy and tree size had been calculated for four mentioned methods with C4.5. The result showed that reduction in dimension lead to faster and more effective execution of learning algorithms. Correlation-based feature selection will get more accurate result and shorter tree.
Yushan2013 [3] team members collected 100 cycles before each goal, found players moving tread (action sequence), discrete players position in to 2*2 cells and extracted frequent sequential pattern in offensive situation, left, right and center forward. They extracted offensive moving strategy rules to design a new offence strategy, through pass, tactics and improve offensive capability. This resulted in more goals and winning percentage. Yushan2012 used Data Mining to increase success rate of pass [1].
Improving reinforcement learning algorithm, Sarsa [6], by using LVF1 data mining technique and selecting relevant features for the specific problem (here dribble), reduced the complexity, needed memory and time. The variables like agent, opponents‟ and ball‟s velocity, distance, angle, body, initial dribble, initial start and neck was used to decide which action (conduct, hold ball and intercept) should be done in the dribble behavior (conduct the ball to a point without losing it). The result was reduced 35% of variables, 65% of actions, 43% memory, and increased 23% in performance easily and efficiently.
In paper “a data mining approach to solve the goal scoring problem” [2], in order to decide the best time and direction to kick the ball, following CRISP-DM standard over international tournament data, maximize the chance for scoring. 25 metrics like angle of attacker and player vision, position and angle of goal keeper and ball, kick strength, defender position, time and result were used. The score chance was estimated using variable transformation and multilayer perceptron neural network. Comparing LDA2 based approach and this new one shows that the new method
1
Las Vegas Filter 2
Linear Discriminant Analysis
has 7.7% increase in kicks and 78% in goal scores measured by Receiver Operating Characteristic curves [11].
Data mining techniques was also used for RoboCup cognitive agents, self-tuning and online reinforcement learning to choose behavior like shoot and teamwork. Parameters in this study was the distance between shooter and target point, kick speed, distance of goal keeper and ball path, distance between shooter and goal keeper projection to ball path. Using data mining modules result in increasing efficiency and effectiveness of shoot and team work for attack. This approach was resulted in winning simulation league in German Open 2004 and world championship 2004 [12].
In another paper the strategy that was chosen by the coach was dictated by data mining results. Researchers assumed static strategy modeled by finite automata for opponent. They used a polynomial learning algorithm in which the coach considered payoffs and applied learning algorithm on 11 matrixes for 11 players [7].
In paper “a champion of RoboCup coach competition,” [13] coach analyzed and identified pattern and weakness of opponents by a 3 tier learning architecture, gathering players‟ sequential events and predict opponent pattern by statistical calculation. Then he compared this pattern with other teams‟ behaviors to build the model and provide proper strategy. MRL3 tested it successfully and took the first place in IranOpen2006. Unparalleled performance, capability to pattern recognition, handling noise conflict and motivating opponents to take patterns, were main factors in this success.
III. FIRST STEP PRE-PROCESSING AND DATA MINING ALGORITHMS
After each soccer simulation game, RoboCup server saves two log files named rcl and rcg log files. Logs can be reviewed by developers in order to analyze the game, debug the code and explore probable problems to improve the actual play. All this is done manually by developers, which takes a lot of time and energy and this method consists many mistakes. Using data mining approach, one will be able to process this data very quickly. For doing data mining the first thing is to prepare dataset in order to apply data mining algorithms on it. In this paper pre-processing has been done in 2 steps. In this section we explain first step that is selection and pre-processing. Then algorithms and performance parameters have been discussed.
A. Selection and Pre-processing
Soccer simulation rcg log files consist of information such as ball position, ball velocity, player position, velocity, type, body angle, neck angle (the direction that each player is looking at), stamina (remaining energy for each player), etc. for each cycle. Data mining process can gather useful knowledge about patterns in the game. We should select important, relevant and effective features. In order to specify a state we use ball and players position. Then by specifying ball owner in each cycle the action could be recognized. The ball owner in each cycle would be the one who is the nearest of all and have ball in his kickable margin while ball velocity is less than 2 meters per second.
Some actions could be understood from game mode for example if play mode had changed into goal mode, this was a successful shoot. For extracting other actions we followed ball position sequence in continuous cycles. Then by specifying ball owner in each cycle the action that had been taken place could be recognized. For example imagine a
3
game between team A and team B that in cycle 45 the player number 1 from team A owned the ball, then for some cycles, the ball hovered around to reach the next owner. Assume that the player number 3 from team A got the ball, so this action was a pass. If the player remained the same, the action recognized as a dribble. If the action was none of above mentioned so it is obvious that the other team (team B) has gain the ball and the action was unsuccessful. In this case, we will have three options: unsuccessful dribble, unsuccessful pass and unsuccessful shoot. If the player lose the ball near him, it was supposed to be unsuccessful dribble, if its distance with opponent goal was less that 30 and the ball was moving toward the goal it was an unsuccessful shoot, other way it was unsuccessful pass. So by following the ball owner in each cycle we can recognize actions as mentioned. This action will be class variable and ball and players‟ distance and action start point, will be state specifier.
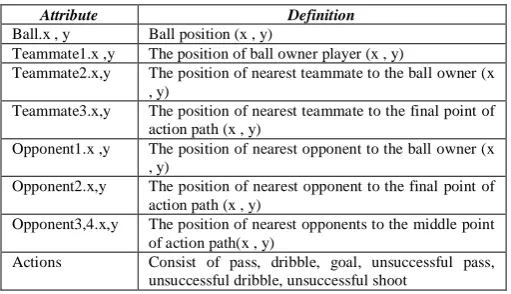
Not all players are involved in an action. Reducing data dimensions (attributes) caused in faster and more effective learning algorithm [10] so 7 players were chosen out of 22, based on distance calculation to ball path, and other players will be ignored. Each position consists of one x and one y. We chose three players from teammate consisted of the owner player, the nearest teammate to the owner and the nearest player to the last point of action path (the path that the ball passing through it during the action). Then chose four players among opponents consisted of the nearest player to the ball, nearest opponent to the last point of action path and two opponents near to the center of action path. After that we formed the dataset by players‟ positions as state and actions as class attribute. As shown in TABLE I actions consisted of pass, dribble, goal, unsuccessful pass, unsuccessful dribble and unsuccessful shoot. Our class attribute was nominal and consisted of 6 values. This means that classification algorithm is proper for prediction, for example by using positions and distances as data attribute and using C4.5 algorithm as classification algorithm, we obtain trees for predicting opponent action, and successfulness of each action in each situation.
Table I. attributes and definitions after first step pre-processing
Attribute Definition
Ball.x , y Ball position (x , y)
Teammate1.x ,y The position of ball owner player (x , y)
Teammate2.x,y The position of nearest teammate to the ball owner (x , y)
Teammate3.x,y The position of nearest teammate to the final point of action path (x , y)
Opponent1.x ,y The position of nearest opponent to the ball owner (x , y)
Opponent2.x,y The position of nearest opponent to the final point of action path (x , y)
Opponent3,4.x,y The position of nearest opponents to the middle point of action path(x , y)
Actions Consist of pass, dribble, goal, unsuccessful pass, unsuccessful dribble, unsuccessful shoot
B. Classification Algorithms and parameters
Agent2d is one of the most popular base codes that are used by RoboCup developers. 43 logs from the base Agent2d-3.2.2 had been processed by using the above mentioned pre-processing algorithm and 5227 instances gained. Then we process this data again (the second step of preprocessing will be explain in section 4). Then we used Weka [14] software, version 3.6.10, to classify data and form a decision tree. Weka is an open source environment for knowledge analysis and data mining. In this paper we had used J48 for building four trees for shoot successfulness, dribble successfulness, pass successfulness, and predict
opponent behavior. Then analyze each tree with 10-fold cross validation.
1) J-48: The algorithm J48 is Weka implementation of C4.5. The algorithm C4.5 splits data into smaller subsets and makes a decision by using data features [15]. C4.5 is based on ID3 for building Decision tree. In this algorithm by calculating “entropy” (the measure of data disorderness) and “gain” (decrease in information entropy) for possible attribute splits, we choose the highest gain that is the lowest entropy to branch on. If it reaches a completely pure subset that all instances have the same class attribute in a tree leaf, it won‟t continue that leaf any more. After building a tree it needs to be pruned to eliminate outliers and make tree more general [10], [16].
2) 10-fold cross validation: 10-fold cross validation is used as test mode. This method splits the data set into ten equal size subsets randomly. Each time the inducer picks out one part. Then trains the model with other 9 parts and tests it with that one part. This method estimates the accuracy by calculating correct classifications over the number of dataset instances [17].
After building each tree some parameters had been calculated for performance measurement. These parameters contained [18], [19]:
Accuracy: percentage of correctly classified test set samples.
Confusion matrix: shows how your classifier, classified samples.
TP rate: number of positive samples that have been predicted correctly.
FP rate: number of negative samples that have been predicted incorrectly.
Precision: TP/(TP+FP)
Recall: proportion of samples that are classified correctly divided by total samples in that class F-Measure: combined precision and recall
ROC Area: the area under roc curve (it is 1in optimal classification and 0.5 in random choosing)
IV. BEHAVIOR SUCCESSFULNESS &PREDICT OPPONENTS BEHAVIOR
[image:3.595.30.286.507.654.2]In this part, another pre-processing has been applied on pre-processed logs to make them ready to be classified and build different trees. In this section, four trees have been made including shoot successfulness, dribble successfulness, pass successfulness and predicting opponent behavior by which we can predict that opponent will keep the ball (hold / dribble) or leave it (pass / shoot). Second step pre-processing has been done on data in TABLE I and by filtering needed actions out of it, calculating distance between teammates and ball, calculating distance between opponents and nearest teammate to them, and dividing ball position into 5*5 m2 cells (soccer simulation field is 105*65 m2 ), TABLE II has been gained.
Table II. attributes and definitions for shoot successfulness
Attribute Definition
Ball.x, Ball.y Ball position x/5 and ball position y/5 Teammate
x(1,2,3)
The distance between teammate x and ball
Opponent x(1,2,3,4)
The distance between opponent x and nearest teammate to him
x(1,2,3) Opponent x(1,2,3,4)
The distance between opponent x and nearest teammate to him
Actions It is different in following sections
Fig.1 shows the diagram of the first step (explained in section3) and second step preprocessing and filtering for shoot, pass, dribble and predict.
Figure 1. the diagram of preprocessing
A. Shoot Successfulness
In this part table II has 199 instances and 10 attributes and actions are consist of goal and unsuccessfulShoot. Then by applying J48 classification and 10-fold cross validation on it the tree in Fig.2. with 5 nodes and 3 leaves with accuracy of 98.995% has been gained. The detailed accuracy and confusion matrix has been showed in Table III and Table IV.
Figure 2. Shoot successfulness J48 tree
Table III. detailed accuracy by class for shoot successfulness
TP rate
FP rate
precisi on
Recall
F-Measures ROC Area
Class
0.98 0 1 0.98 0.99 0.983 goal 1 0.02 0.98 1 0.99 0.983 Un
successful Shoot Weighted
Avg
0.99 0.01 0.99 0.99 0.99 0.983
Table IV. confusion matrix for shoot successfulness
Classified as a b
a=goal 98 2
b=unsuccessfulShoot 0 99
B. Dribble Successfulness
In this part table II has 3569 instances and 10 attributes and actions are consist of dribble and unsuccessfulDribble. Then by applying J48 classification and 10-fold cross validation on it the tree in Fig.3. with 5 nodes and 3 leaves with accuracy of 99.98% has been gained. The detailed accuracy and confusion matrix has been showed in Table V and Table VI.
Figure 3. Dribble successfulness J48 tree
Table V. detailed accuracy by class for dribble successfulness TP
rate FP rate
precisi on
Recall
F-Measures ROC Area
Class
1 0 1 1 1 1 Dribble
1 0 1 1 1 1 Un
successful Dribble Weighted
Avg 1 0 1 1 1 1
Table VI. confusion matrix for Dribble successfulness
Classified as a b
a=dribble 2487 1 b=unsuccessfulDribble 0 2881
C. Pass Successfulness
In this part table II has 3599 instances and 10 attributes and actions are consist of pass and unsuccessfulPass. Then by applying J48 classification and 10-fold cross validation on it the tree with 475 nodes and 238 leaves with accuracy of 80.63% has been gained (could not be placed here because space limitation). The detailed accuracy and confusion matrix has been showed in Table VII and Table VIII.
Table VII. detailed accuracy by class for pass successfulness
TP rate
FP rate
precision Recall
F-Measures ROC Area
Class
0.787 0.169 0.854 0.787 0.819 0.854 Pass 0.831 0.213 0.756 0.831 0.792 0.854 Un
successful Pass Weighted
Avg
0.806 0.189 0.811 0.806 0.807 0.854
Table VIII. confusion matrix for pass successfulness
Classified as A b
a=pass 1577 427
b=unsuccessfulPass 270 1325
D. Predict Opponent Behaviour
In this part table II has 3599 instances and 10 attributes. actions are consists of dribble, pass and shoot that has been gained by changing pass and unsuccessfulPass to pass, dribble and unsuccessfulDribble to dribble and goal and unsuccessfulShoot to shoot. Then by applying J48 classification and 10-fold cross validation on it the tree with 711 nodes and 356 leaves with accuracy of 62.84% has been gained (could not be placed here because of space limitation). The detailed accuracy and confusion matrix has been showed in Table IX and Table X.
Table IX. detailed accuracy by class for predicting opponent behavior
TP rate
FP rate
precision Recall
F-Measures ROC Area
Class
0.422 0.01 0.484 0.422 0.451 0.772 Dribble Weighted
Avg
0.628 0.348 0.628 0.628 0.628 0.675
Table X. confusion matrix for shoot successfulness
Classified as a b c
a=pass 1646 942 40 b=dribble 888 1592 9
c=shoot 48 15 46
V. ANALYZING RESULTS
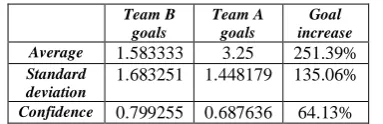
[image:5.595.68.260.384.446.2]In this step we extracted rules from generated trees and inserted the rules in base Agent2d-3.2.2 to put our approach to test. We formed team A by applying our method and rules on agent2D. For that in each cycle the player first considers the state and if it matches the rule that leads to unsuccessful action he avoids doing that action. For example if the current state matches the rule that leads to unsuccessful pass the player will avoid pass in that cycle. Then we formed team B that was the original Agent2D base without any changes. 10 games between team A and team B were carried out to calculate the results. The average, standard deviation and confidence intervals for number of actions were calculated for team A and B in Table XI. Team B pass, dribble and goal means the actions that related to the unchanged Agent base and team A pass, dribble and goal means the actions that happens by the agent2d that the method had been applied to it.
Table XI. Average, standard deviation and confidence intervals for new and old goal scoring
Team B goals
Team A goals
Goal increase
Average 1.583333 3.25 251.39%
Standard deviation
1.683251 1.448179 135.06%
Confidence 0.799255 0.687636 64.13%
As you can see in table XI, the average scored goal before and after applying our method had a great significant increase form 1.583±0.799 to 3.25±0.687. In other words, as it is showed in Table XI. As mentioned before, after applying the method 10 games were carried out to calculate the results between the changed agent2D by applying tree and original agent2D. And after processing these 10 log files we observe that after applying our method the average goal scoring was increased 251.39% with 64.13% confidence interval (alpha=0.1). So we had a great improvement in goal scoring. Considering that most teams use Agent2D as their base code this method can be applied on many of them.
VI. CONCLUSION
In this paper we aimed to apply data mining approach on RoboCup log files. For this purpose we extract and specify some information including the action that have been taken place (pass, dribble, shoot), the start point, and involving players, from RoboCup log files. We used C4.5, algorithm to mine this data to predict own and opponent action and also used 10-fold cross validation to evaluate resulted decision trees. The result showed that after applying our method on base agent2d-3.2.2 goal scoring was increased 251.39% with 64.13% confidence interval (with alpha = 0.1). So applying our method caused improvement in reducing unsuccessful passes and a great improvement in goal scoring. Considering that most teams use Agent2D as their base code this method can be applied on many of them. In future we can use opponent prediction tree to improve mark and block by predicting the probable opponent that would receive pass from owner opponent. We can also predict opponents‟ movements without
ball like formation, block, mark and positioning by following opponents players‟ sequence in continuous cycles.
VII. ACKNOWLEDGMENT
Thanks to Cyrus Robotic soccer simulation2D team members specially Mohammad Sadegh Najafi and Nader Zare.
VIII. REFRENCES
[1] CHENG Ze-kai, LIU Qian, QIN Feng, „Research and Application of Data Mining based on RoboCup Soccer Logs” , Supported by Major Project of Education Department in Anhui (KJ2011A039, 2010KJA051, KJ2012A040), 978-0-7695-5004-6/13 $26.00 © 2013 IEEEDOI 10.1109/ICCIS.2013.104
[2] Renato Oliveira, Paulo Adeodato, Arthur Carvalho, Icamaan Viegas, Christian Diego and Tsang Ing-Ren, “A Data Mining Approach to Solve the Goal Scoring Problem,” Proceedings of International Joint Conference on Neural Networks, Atlanta, Georgia, USA, June 14-19, 2009, 978-1-4244-3553-1/09/$25.00 ©2009 IEEE [3] ZeKai-Cheng, ChengFei-Zhang, Qian-Liu, Feng-Guo,
WenWen-Jin, TanQi-Yu, “YuShan Soccer 2D Simulation Team Description Paper for RoboCup,” 2013.
[4] M. Chen, E. Foroughi, F. Heintz, S. Kapetanakis, K. Kostiadis, r. Kummeneje, I. Noda, O. Obst, P. Riley, T. Steffens, Y. Wang and X. Yin, Users manual: RoboCup soccer server manual for soccer server version 7.07 and later. http://sourceforge.netJprojects/sserver/.
[5] A. Rozinat, S. Zickler, M. Veloso, W.M.P. van der Aalst, and C.McMillen, ”Analyzing Multi-agent Activity Logs Using Process Mining Techniques,” Springer Berlin Heidelberg , pp 251-260, 2009
[6] Davi C. de L. Vieira, Paulo J. L. Adeodato, Paulo M. Goncalves Jr, “Improving Reinforcement Learning Algorithms by the Use of Data Mining Techniques for Feature and Action Selection,” 978-1-4244-6588-0/10/$25.00 ©201 0 IEEE
[7] Amin Milani Fard, Vahid Salmani, Mahmoud Naghibzadeh, Sedigheh Khajouie Nejad, Hamed Ahmadi, “Game Theory-based Data Mining Technique for Strategy Making of a Soccer Simulation Coach Agen,” 01/2007; In proceeding of: Information Systems Technology and its Applications, 6th International Conference ISTA'2007, May 23-25, 2007, Kharkiv, Ukraine, Source: DBLP [8] CHEN Zhuo,YANG Bing-ru,SONG Wei,SONG Ze-feng,
“Survey of sequential pattern mining,” [J].Application Research of Computer 2008,25(7),pp:1960–1963.
[9] Tan, Steinbach, Kumar, Introduction to Data Mining. © Tan, Steinbach, Kumar, 2004
[10] Fahimeh Farahnakian and Nasser Mozayani, “Evaluating Feature Selection Techniques in Simulated Soccer Multi Agents System,” International Conference on Advanced Computer Control. 978-0-7695-3516-6/08 $25.00 © 2008 IEEE,DOI 10.1109/ICACC.2009.96
[11] F. Tom, “An introduction to ROC analysis”. Pattern Recognition Letters, vol. 27, no. 8, pp. 861874, 2006. [12] L. Stankevich, S. Serebryakov, and A. Ivanov, “Data
Mining Techniques for RoboCup Soccer Agents,” . V. Gorodetsky, J. Liu, and V.A. Skormin (Eds.): AIS-ADM 2005, LNAI 3505, pp. 289 – 301, 2005.© Springer-Verlag Berlin Heidelberg 2005
[13] Ramin Fathzadeh, Vahid Mokhtari, Morteza Mousakhani and Fariborz Mahmoudi, “Mining Opponent Behavior, A Champion of RoboCup Coach competition,‟ 1-4244-0537-8/06/$20.00 C 2006 IEEE, 2006
[14] (2014) Weka wenbsite.
[15] R. S. Michalski , I. Bratko and M. Kubat, Machine Learning and Data Mining: Methods and Applications. John-Wiley Publishers, 1998
[16] Thales Sehn Korting, C4.5 algorithm and Multivariate Decision Trees, 2006
[17] Ron Kohavi, ”A study of cross validation and bootstrap for accuracy estimation and model selection”, in the International Joint Conference on Artificial Intelligence IJCAI.1995
[18] Trilok Chand Sharma, Manoj Jain, “WEKA Approach for Comparative Study of Classification Algorithm,” International Journal of Advanced Research in Computer and Communication Engineering Vol. 2, Issue 4, April 2013, Copyright to IJARCCE