Volume 5, No. 5, May-June 2014
International Journal of Advanced Research in Computer Science
REVIEW ARTICAL
Available Online at www.ijarcs.info
Clustering Techniques: A Comprehensive Study of Various Clustering Techniques
Rashi Chauhan
Dept. of Computer Science & Engg
M.Tech. Student of Amity University Haryana, India
Abstract: Clustering means dividing the data into groups (known as clusters) in such a way that objects belonging to a group are similar to each other but they are dissimilar to objects belonging to other groups. This paper is intended to give a review of various clustering techniques in data mining. Various clustering methods reviewed are: Partitioning Methods, Hierarchical Methods, Density Based Clustering Methods, Grid-Based Methods, etc.
Keywords: Clustering, Density, Grid, Hierarchical, Medoids, Outliers, Partitioning
I. INTRODUCTION
Clustering means dividing the data into groups (known as clusters) in such a way that objects belonging to a group are similar to each other but they are dissimilar to objects belonging to other groups[5].
Clustering, in data mining, is a useful technique for discovering interesting data distributions and patterns in the underlying data.
II. PARTITIONING METHODS
Partitioning Methods construct various partitions and then evaluate them by some criterion. Partitioning methods are divided into two subcategories, one is centroid and other is medoids algorithms.Centroid algorithms represent each cluster by using the gravity centre of the instances. The medoid algorithms represents each cluster by means of the instances closest to gravity centre[8]. The well-known centroid algorithm is the k-means. The k-means method partitions the data set into k subsets such that all points in a given subset are closest to the same centre. In detail, it randomly selects k of the instances to represent the clusters. Based up on the selected attributes, the remaining instances are assigned to their closer centers. K-means then computes the new centers by taking the mean of all data points belonging to the same cluster. The process is iterated until there is no change in the gravity centers[2].
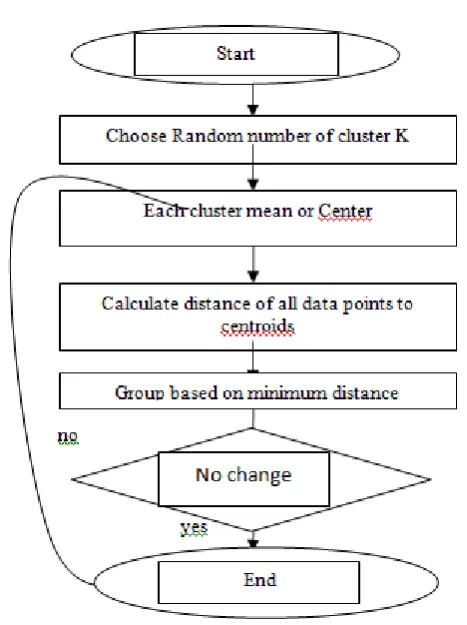
A. K-means Clustering[10]: Algorithm: k-means.
Input:
k: the number of clusters,
D: a data set containing n objects. Output: A set of k clusters. Method:
a. arbitrarily choose k objects from D as the initial cluster centers;
b. repeat
c. (re)assign each object to the cluster to which the
object is the most similar, based on the mean value of the objects in the cluster;
d. update the cluster means, i.e., calculate the mean
value of the objects for each cluster;[9]
[image:1.595.320.554.263.576.2]e. until no change
Figure. 1: K-Mean Clustering process
a. Advantages:
a) Simple
b) Relatively efficient than PAM and CLARA.
c) Fast for low dimensional data.
d) It can find pure sub clusters if large number of clusters is specified.
b. Limitations:
a) K-means has problems when clusters are of
differing
(a). Sizes
(b). Densities
(c). Non-globular shapes
i. Applied only when mean is defined
ii. required to specifythe number of clusters, in advance
iv. Not suitable to find clusters with arbitrary shapes
v. The basic algorithm is not efficient
B. k-Medoids:
Instead of taking the mean value of the object in a cluster as a reference point, medoids can be used, which is the most centrally located object in a cluster. Medoids for
each cluster are calculated by finding object , orandom
within the cluster that minimizes where Cj is the cluster
containing object j and d(i; j) is the distance between objects i and j[2].
Algorithm: k-medoids. PAM(Partitioning Around
Medoids)[9] Input:
k: the number of clusters,
D: a data set containing n objects. Output: A set of k clusters. Method:
a) arbitrarily choose k objects in D as the initial
representative objects or seeds;
b) repeat
c) assign each remaining object to the cluster with the nearest representative object;
d) randomly select a nonrepresentative object,
orandom;
e) compute the total cost, S, of swapping
representative object, oj, with orandom;
f) if S < 0 then swap oj with orandom to form the new set of k representative objects;
g) until no change;[9]
a. Advantages:
a) It is more efficient than k-means in the presence of
noise and outliers because a medoid is less influenced by noisy data than a mean.
b) It works efficiently for small data sets.
b. Limitations:
a) It does not scale well for large data sets.
b) Its processing is more expensive than k-means method.
C. Clarans:
Here,instead of taking the whole set of data, a small portion of the actual data is chosen as a representative of the data.Medoids are then chosen from this sample using PAM[10]. If the sample is selected in a fairly random manner, it should closely represent the original data set. The representative objects (medoids) chosen will likely be similar to those that would have been chosen from the whole data set[10]. CLARA draws multiple samples of the data set, applies PAM on each sample, and returns its best clustering as the output. As expected, CLARA can deal with larger data sets than PAM. The complexity of each iteration now becomes O(ks2+k(nk)), where s is the size of the sample, k
is the number of clusters, and n is the total number of
objects[10].
a. Advantages:
a) CLARANS deals with larger data sets than PAM .
b) CLARANS also enables the detection of outliers.
b. Limitations:
a) Its efficiency depends on the sample size.
b) A good clustering based on samples will not
necessarily represent a good clustering of the whole data set if the sample is biased.
c) It needs multiple data scan.
III. HIERARCHICAL METHODS
a. Agglomerative hierarchical clustering— Each object initially represents a cluster of its own. Then clusters are successively merged until the desired cluster structure is obtained. It is bottom up approach[4]. b. Divisive hierarchical clustering — All objects initially
belong to one cluster. Then the cluster is divided into sub-clusters, which are successively divided into their own sub-clusters. This process continues until the desired cluster structure is obtained. It is top down approach[4].
A. BIRCH:-
It stands for Balanced Iterative Reducing and Clustering using Hierarchies. BIRCH is designed for clustering a large amount of numerical data by integration of hierarchical clustering (at the initial microclustering stage) and other clustering methods such as iterative partitioning (at the later macroclustering stage). It Incrementally construct a CF (Clustering Feature) tree, a hierarchical data structure for multiphase clustering. A CF tree is a height-balanced tree that stores the clustering features for a hierarchical clustering. The clustering algorithm BIRCH is a main memory based algorithm, i.e., the clustering process is carried out with a memory constraint[6].
Phase 1: scan DB to build an initial in-memory CF tree (a multi-level compression of the data that tries to preserve the inherent clustering structure of the data)
Phase 2: use an arbitrary clustering algorithm to cluster the leaf nodes of the CF-tree [1][2].
a. Advantages:
a) Scales linearly: finds a good clustering with a single
scan and improves the quality with a few additional scans
b) It has back-tracking capability.
c) It is also an incremental method that does not require
the whol
b. Limitations:
a) It cannot handle non-numeric data.
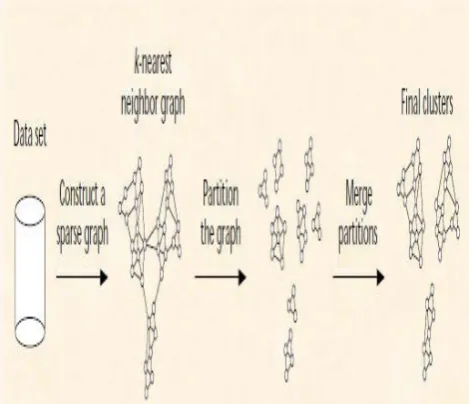
B. Chameleon:-
In agglomerative hierarchical approaches the major disadvantage is that they are based on a static, user specified inter connectivity model, either under estimates or over estimates the inter connectivity of objects and clusters. This type limitation is overcome by the algorithm CHAMELEON. CHAMELEON makes use of a sparse graph, where the nodes represent data objects; weights in the edges represent similarities between the data objects[1]. Chameleon is a hierarchical agglomerative clustering algorithm that uses dynamic modelling to determine the similarity between pairs of clusters. In Chameleon, cluster similarity is assessed based on how well-connected objects are within a cluster and on the proximity of clusters. That is, two clusters are merged if their interconnectivity is high and
on a static, user-supplied model and can automatically adapt to the internal characteristics of the clusters being merged.
[image:3.595.38.274.119.321.2]The merge process facilitates the discovery of natural and homogeneous clusters and applies to all types of data as long as a similarity function can be specified[2].
Figure. 2: depicting chameleon process
Algorithm:
a) Build a k-nearest neighbour graph
b) Partition the graph using a multilevel graph
partitioning algorithm
c) Repeat
d) Merge the two clusters that best preserve
(maximize) the self-similarity
e) Until no more clusters can be merged
a. Limitations of Chameleon:
a) It cannot be applied to high dimensions.
b. Advantages of hierarchical clustering methods: a) Versatility — The single-link methods, for example,
maintain good performance on data sets containing non-isotropic clusters, including well separated, chain-like and concentric clusters.
b) Multiple partitions — hierarchical methods produce not one partition, but multiple nested partitions, which allow different users to choose different partitions, according to the desired similarity level.
(a). Conceptually simple
(b). Theoretical properties are well understood
(c). When clusters are merged/split, the decision is
permanent => the number of different alternatives that need to be examined is reduced
c. Limitations of hierarchical clustering methods:
a) Inability to scale well
b) Divisive methods can be computational hard.
c) There is no back-tracking capability.
IV. DENSITY BASED CLUSTERING METHODS
Density-based clustering algorithms try to find clusters based on density of data points in a region. The main idea of density-based clustering is that for each instance of a cluster the neighborhood of a given radius (Eps) has to contain at least a minimum number of instances (MinPts).
A. DBSCAN: Density-Based Spatial Clustering Of Applications With Noise:
Density-based Algorithm DBSCAN is designed to discover clusters of arbitrary shape such as “S” shape and oval clusters. It finds core objects i.e. objects that have dense neighbourhoods. It connects core objects and their neighbourhoods to form dense regions as clusters.Two global parameters for DBSCAN algorithms are:
a. Eps: Maximum radius of the neighborhood
b. MinPts: Minimum number of points in an Eps-neighborhood of that point
a) Core Object: Object with at least MinPts objects
within a radius ‘Eps-neighborhood’
b) Border Object: Object that on the border of a cluster
c) Directly Density-Reachable: A point p is directly
density-reachable from a point q w.r.t Eps, MinPtsif p belongs to NEps(q) and |NEps (q)| >= MinPts
d) Density-Reachable: A point p is density-reachable
from a point q w.r.t Eps, MinPtsif there is a chain of points p1, …, pn, p1 = q, pn = p such that pi+1 is directly density-reachable from pi.
e) Density-Connected: A point pis density-connected to
a point q w.r.t Eps, MinPtsif there is a point o such that both, p and q are density-reachable from ow.r.t Eps and MinPts[3].
Algorithm[1]
a. Arbitrary select a point p :
b. Retrieve all points density-reachable from p w.r.t. Eps and MinPts.
c. If p is a core point, a cluster is formed.
d. If p is a border point, no points are density-reachable
from p and DBSCAN visits the next point of the
database.
e. Continue the process until all of the points have been
processed.
a. Advantages:
a) It can handle noise efficiently.
b) It can handle clusters of different shapes and sizes. c) It is faster.
d) There is no need to define number of clusters in
advance.
b. Limitations:
a) Varying densities
b) It is not suitable for High-dimensional data
c) It has some difficulties in distinguishing separated
clusters if they are located too close to each other, even though they have different densities.
B. OPTICS:
OPTICS is a clustering algorithm that identifies the implicit clustering in a given dataset and is a density-based clustering approach. Unlike the other density-based clustering algorithm DBSCAN which depends on a global parameter setting for cluster identification, OPTICS uses a multiple number of parameter settings. In that context the OPTICS is an extended work of DBSCAN algorithm. OPTICS is implemented on the concept of Density-based Cluster Ordering which is an extension of DBSCAN algorithm[1].
highly populated clusters for a lower value of ε. Multiple number of distance parameter ε have been utilized to process the data objects. OPTICS ensures good quality clustering by maintaining the order in which the data objects are processed, i.e., high density clusters are given priority over lower density clusters. The cluster information in memory consists of two values for every processed object. one is the core-distance and other is reachability distance. Thus OPTICS produces an ordering of the given database. Along with ordering OPTICS also stores core-distance and reachability distance of each data object, thereby resulting in better quality clusters. The OPTICS clustering algorithm provides an efficient cluster ordering with a set of ordering of the data objects with reachability values and core-values. OPTICS implements pixel oriented visualization techniques for large multidimensional data sets. OPTICS utilizes automatic techniques to identify start and end of cluster structures to begin with and later groups them together to determine a set of nested clusters[1].
C. DENCLUE (DENsity-based CLUstEring):
It is a clustering method based on a set of density distribution functions. The method is implemented based on the following ideas: (1) the influence of each data point can be formally modeled using a mathematical function, can be called an influence function i.e., which describes the impact of a data point within its neighborhood; (2) the overall density of the data space can be modeled analytically as the sum of the influence function applied to all data points; and (3) clusters can then be determined mathematically by identifying density attractors[1].
a. Advantages:
a) Solid mathematical foundation
b) Good for data sets with large amounts of noise
c) Allows a compact mathematical description of
arbitrarily shaped clusters in high-dimensional data sets
d) Significant faster than DBSCAN
b. Limitations:
a. It needs a large number of parameters.
V. GRID BASED METHODS
Grid-based clustering algorithms first quantize the clustering space into a finite number of cells and then perform the required operations on the quantized space. Cells that are contain more than certain number of points are treated as dense and the dense cells are connected to form the clusters. the following are some of the grid-based clustering algorithms are: STatistical INformation Grid-based method – STING , WaveCluster, and CLustering In QUEst – CLIQUE. STING first divides the spatial area into several levels of rectangular cells in order to form a hierarchical structure[1].
Basic algorithm:
a. Define a set of grid cells
b. Compute the density of cells
c. Eliminate cells with a density smaller than a
threshold
d. Form clusters from contiguous cells
A. STING(Statistical Information Grid):
It explores statistical information stored in the grid cells. The spatial area area is divided into rectangular cells.There are several levels of cells corresponding to different levels of resolution. Each cell at a high level is partitioned into a number of smaller cells in the next lower level.Statistical info of each cell is calculated and stored beforehand and is used to answer queries[1].
Parameters of higher level cells can be easily calculated from parameters of lower level cell.
a) Use a top-down approach to answer spatial data
queries
b) Start from a pre-selected layer—typically with a
small number of cells
c) For each cell in the current level compute the
confidence interval
d) Remove the irrelevant cells from further
consideration
e) When finish examining the current layer, proceed to
the next lower level
f) Repeat this process until the bottom layer is reached
a. Advantages:
a) Query-independent, easy to parallelize, incremental
update O(K), where K is the number of grid cells at the lowest level .
b) It facilitates parallel processing and incremental
updating. c) It is efficient.
b. Disadvantages:
a) The quality of STING clustering depends on the
granularity of the lowest level of the grid structure. b) It results into unaccurate clusters despite the fast
processing time of the technique.
B. Wave Cluster :
Wave Cluster is a multi resolution clustering algorithm. It clusters objects using a wavelet transform method .Given a set of spatial objects Oi, 1≤ i ≤ N, the goal of the algorithm is to detect clusters. It first summarizes the data by imposing a multi dimensional grid structure on to the data space. The main idea is to transform the original feature by applying wavelet transform and then find the dense regions in the new space. A wavelet transform is a signal processing technique that decomposes a signal into different frequency sub bands. The first step of the wavelet cluster algorithm is to quantize the feature space. In the second step, discrete wavelet transform is applied on the quantized feature space and hence new units are generated. Wave cluster connects the components in two set of units and they are considered as
cluster. Corresponding to each resolution γ of wavelet
transform there would be set of clusters cr. In the next step wave cluster labels the units in the feature space that are included in the cluster[1].
a. Advantages:
a) It finds clusters for very large spatial databases.
b) It provides unsupervised clustering.
c) Wavelet transformation can automatically result in the
removal of outliers.
d) It can help detect clusters at varying levels of
accuracy.
f) High-quality clusters
g) The ability to work well in relatively high-dimensional
spatial data
C. CLIQUE(Clustering InQUEst):
It represents a grid-and density-based approach for clustering in high-dimensional data space.It partitions each dimension like a grid structure and determines whether a cell is dense based on the number of points it contains[7].
CLIQUE performs multidimensional clustering in two steps:
1st step:CLIQUE partitions the d-dimensional data
space into nonoverlapping rectangular units, identifying the dense units among these. This is done (in 1-D) for each dimension.The subspaces representing these dense units are intersected to form a candidate search space in which dense units of higher dimensionality may exist.
2 nd step: CLIQUE generates a minimal description for each cluster as follows. For each cluster, it determines the maximal region that covers the cluster of connected dense units. It then determines a minimal cover (logic description) for each cluster[1].
CLIQUE Algorithm
a) Find all dense regions in 1-dim space for each
attribute.
This is the set of dense 1-dim cells. Let k=1. b) Repeat until there are no dense k-dim cells
c) k = k+1
d) Generate all candidate k-dim cells from dense
(k-1)-dim cells
e) Eliminate cells with fewer than p points
f) Find clusters by taking union of all adjacent,
highdensity cells of same dimensionality
g) Summarize each cluster using a small set of
inequalities that describe the attribute ranges of the cells in the cluster.
a. Advantages:
a) CLIQUE automatically finds subspaces of the highest
dimensionality such that high-density clusters exist in those subspaces.
b) It is insensitive to the order of input. c) It is scalable.
b. Disadvantages:
a) Need to tune grid size and density threshold
b) May fail if clusters are of widely differing densities,
since the threshold is fixed c) Can still have high mining cost
d) Same density threshold for low and high
dimensionality
VI. CONCLUSION
Clustering of large databases is an important data mining problem. In this paper, several density based clustering techniques proposed for clustering have been discussed. A review has been made on various clustering algorithms. All are discussed along with their advantages and disadvantages. This survey can be helpful for understanding of several clustering techniques for choosing appropriate algorithm. The type of algorithm that is to be chosen depends upon type of clusters that are needed to be finded,type of data set and number of attributes.Clustering methods can be categorized by the shape of the clusters they can find. Clustering algorithms that used simple shapes are not capable to find complex cluster. Ones that used complex approaches are not performed.
VII. REFERENCES
[1]. J. Han, M. Kamber, J.Pei, “Data Mining Concepts and Techniques”, third edition,2012.
[2]. B.G. Obula Reddy and Dr. M. Ussenaiah “Literature Survey On Clustering Techniques”,IOSR Journal of Computer Engineering , Volume 3,Issue 1,July 2012.
[3]. P. Berkhin ,“A Survey of Clustering Data Mining Techniques”,A Book Journal Published in 2008-09.
[4]. A.K.Jain, M.N.Murty and P.J.Flynn, “A Data
Clustering:review”, ACM Computing Surveys,31(3):264-323,1999.
[5]. A. K. Jain, Prof. S. Maheswari ,“Survey of Recent Clustering Techniques in Data Mining”, ,International Journal of Computer Science and Management Research ,Vol 1, Issue 1, Aug 2012.
[6]. R. Xu and D. Wunsch, “Survey of Clustering Algorithms”, IEEE Transactions On Neural Netwoks,Vol.16, No. 3, May 2005 .
[7]. X. Wang and L. Tang ,“Cluster Analysis, Basic Concepts and Algorithms”, 2011 11th IEEE International Conference on Data Mining.
[8]. S.B. Kotsiantis, P.E. Pintelas, “Recent Advances in Clustering: A Brief Survey”,
http://www.cs.utsa.edu/~bylander/cs6243/kotsiantis-clustering.pdf
[9]. P. J. Pathak, S. S. Dongre, “Intrusion Detection through Ensemble Classification Approach”,2nd National Conference on Information and Communication Technology (NCICT) 2011Proceedings published in International Journal of Computer Applications® (IJCA)