International Journal of Advanced Research in Computer Science
(ISSN: 0976-5697)
RESEARCH PAPER
Available Online at www.ijarcs.info
ISBN: 978-93-5300-455-2
DIABETES DATA ANALYSIS USING MAPREDUCE AND CLASSIFICATION TECHNIQUES
M. Ashok Kumar Ph.D Research Scholar Dept. of Computer Science
Periyar University Salem-11 [email protected]
Dr. I. Laurence Aroquiaraj Assistant Professor Dept. of Computer Science
Periyar University Salem-11 [email protected]
ABSTRACT
Data mining techniques can be applied to extract valuable knowledge from data repositories, e.g. through clustering, classification or association rule mining. Mapreduce is a programming technique which is suitable for analyzing large data sets that otherwise cannot fit in your computer's memory. The research hopes to propose a quicker and more efficient technique of diagnosing the disease, leading to timely treatment of the patients. After mapreduce the classification techniques such as KNN and SVM are applied. The performance of classification techniques are analyzed and interpreted.
Keyword: Classification, MapReduce, KNN, SVM.
1. Introduction
Data mining is an extraction of hidden predictive information from large database. Data mining is the process of analyzing data from different perspectives and summarizing it into useful information. Data mining involves the use of sophisticated data analysis tools to discover previously unknown, valid patterns and relationships in large data sets. These tools can include statistical models, mathematical algorithms, and machine learning methods.
Consequently, data mining consists of more than collecting and managing data; it also includes analysis and prediction[1]. With the enormous amount of data stored in files, databases, and other repositories, it is increasingly important to develop powerful means for analysis and perhaps interpretation of such data and for the extraction of interesting knowledge that could help in decision-making. Limitation of Data Mining are primarily data or personnel-related rather than technology-related. Data mining is one step in the KDD process. It is the most researched part of the process. In that effects of diabetes have been reported to have a more fatal and worsening impact on women than on men because of their lower survival rate and poorer quality of life. WHO reports state that almost one – third of the women who suffer from diabetes have no knowledge about it. The effect of diabetes is unique in the case of mothers because the disease is transmitted to their unborn children. Strokes, miscarriages, blindness, kidney failure and amputations are just some of the complications that arise from this disease [5]. For the purposes of this paper, the analyses of diabetes cases have been restricted to pregnant women.
Generally a person is considered to be suffering from diabetes, when blood sugar levels are above normal (4.4 to 6.1 mmol/L) [1]. Pancreas present in the human body produces insulin, a hormone that is responsible to help glucose reach each cell of the body. A diabetic patient essentially has low production of insulin or their body is not able to use the insulin well. There are three main types of diabetes, viz. Type 1, Type 2 and Gestational [2].
• Type 1 – The disease manifest as an autoimmune disease occurring at a very young age of below 20 years. In this type of diabetes, the pancreatic cells that produce insulin have been destroyed.
• Type 2 - Diabetes is in the state when the various organs of the body become insulin resistant, and this increases the demand for insulin. At this point, pancreas doesn’t make the required amount of insulin. Gestational diabetes tends to occur in pregnant women, as the pancreas don’t make sufficient amount of insulin. All these types of diabetes need treatment and if they are detected at an early state, one can avoid the complications associated with them.
Now a day, a large amount of information is collected in the form of patient records by the hospitals. Knowledge discovery for predictive purposes is done through data mining, which is an analysis technique that helps in proposing inferences [6]. This method helps in decision-making through algorithms from large amounts of data generated by these medical centers. Considering the importance of early medical diagnosis of this disease, data mining techniques can be applied to help the women in detection of diabetes at an early stage and treatment, which may help in avoiding complications.
2. Literature Review
A literature review reveals many results on diabetes carried out by different methods and materials of diabetes problem in India. Many people have developed various prediction models using data mining to predict diabetes. Combination of classification-regression-genetic-neural network, handles the missing and outlier values in the diabetic data set, and also they replaced the missing values with domain of the corresponding attribute [13].
The classical neural network model is used for prediction, on the pre-processed dataset. In predictive analysis of diabetic treatment using regression based data mining techniques to diabetes data, they discover patterns using SVM algorithm that identify the best mode of treatment for diabetes across different age [14]. They concluded that drug treatment for patients in the young age group can be delayed whereas; patients in the old age group should be prescribed drug treatment immediately. Prediction and classification of various type of diabetes using C4.5 classification algorithm was carried out in Pima Indians Diabetes Database [15].
sharing of information and electronic communication systems enable access to health services and also promotes additional care over dual eligible patients. It recognizes which patient is requiring more care and attention than others. It gives needed data to determine which strategies should be put in place to maximize positive behavior modification [19].
The predictive analytics works in three areas such as Operations management, Medical management and biomedicine, and System design and planning. Healthcare predictive analytics system can help one of the issues that is to address the cost of patients being repeatedly admitted and readmitted to a hospital for chronic diseases which is similar or multiple. The survey of New England Journal of Medicine tells that one in five patients suffer from preventable readmissions. Therefore,1% of the population accounts for 20% of all US healthcare expenditures almost and 25% for over 80% of all expenditures [20].
Various big data technology stack and research over health care combined with efficiency. Cost savings, etc., are explained in better healthcare [21]. The hadoop usage in health care became more important to process the data and to adopt the large scale data management activities. The analytics on the combined compute and storage can promote the cost effectiveness to be gained using hadoop [22].
In [24] Fuzzy Ant Colony Optimization (ACO) was used on the Pima Indian Diabetes dataset to find set of rules for the diabetes diagnosis. The paper [8] approached the aim of diagnoses by using ANNs and demonstrated the need for preprocessing and replacing missing values in the dataset being considered.
Hence, there is a requirement of a model that can be developed easily providing reliable, faster and cost effective methods to provide information of the probability of a patient to have diabetes. In the present work, an attempt is made to analyze the diabetes parameters and to establish a probabilistic relation between them using Naïve Bayes and Decision Tree approach. For the purpose of analysis the models are tested depending on the percentage of correctly classified instances in the dataset.
3. Methods and Materials
3.1. MapReduce
To use an implementation of MapReduce to manage many large-scale computations in a way that is tolerant of hardware faults.
In brief, a MapReduce computation executes as follows:
1. Some number of Map tasks each is given one or more chunks from a distributed file system. These Map tasks turn the chunk into a sequence of key-value pairs. The way key-value pairs are produced from the input data is determined by the code written by the user for the Map function.
2. The key-value pairs from each Map task are collected by a master controller and sorted by key. The keys are
divided among all the Reduce tasks, so all key-value pairs with the same key wind up at the same Reduce task. 3. The Reduce tasks work on one key at a time, and combine all the values associated with that key in some way. The manner of combination of values is determined by the code written by the user for the Reduce function.
3.1.1 Extensions to MapReduce
MapReduce has proved so influential that it has spawned a number of extensions and modifications. These systems typically share a number of characteristics with MapReduce systems:
1. They are built on a distributed file system.
2. They manage very large numbers of tasks that are instantiations of a small number of user-written functions.
3. They incorporate a method for dealing with most of the failures that occur during the execution of a large job, without having to restart that job from the beginning
3.2. Classification Technique
The classification of big data is becoming an essential task in a wide variety of fields such as biomedicine, social media, marketing, etc. The recent advance in data gathering in many of these fields has resulted in an inexorable increment of the data that we have to manage. The volume, diversity and complexity that bring big data may hinder the analysis and knowledge extraction processes [9]. Under this scenario, standard data mining models need to be re-designed or adapted to deal with this data. The k-Nearest Neighbor algorithm (k-NN) [2] is considered one of the ten most influential data mining algorithms [10].
A medical diagnosis is a classification process. A physician has to analyze lot of factors before diagnosing the diabetes which makes physician’s job difficult. In recent times, machine learning and data mining techniques have been considered to design automatic diagnosis system for diabetes [12]. Recently, there are many methods and algorithms used to mine biomedical datasets for hidden information, including Neural networks (NNs), Decision Trees (DT), Fuzzy Logic Systems, Naive Bayes, SVM, cauterization, logistic regression and so on [11]. These algorithms decrease the time spent for processing symptoms and producing diagnoses, making them more precise at the same time.
4. Proposed Work
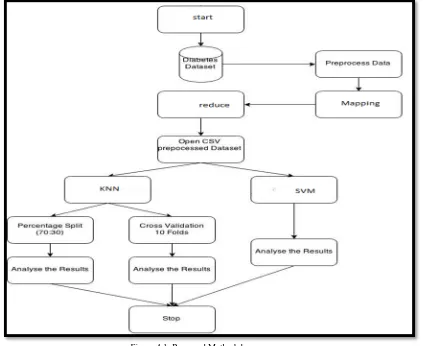
Figure 4.1: Proposed Methodology
4.1. MapReduce Framework
MapReduce [6] is a popular programming framework to support data-intensive applications using shared-nothing clusters. In MapReduce, input data are represented as key-value pairs. Several functional programming primitives including Map and Reduce are introduced to process the data. Map function takes an input key-value pair and produces a set of intermediate key-value pairs. MapReduce runtime system then groups and sorts all the intermediate values associated with the same intermediate key, and sends them to the Reduce function. Reduce function accepts an intermediate key and its corresponding values, applies the processing logic, and produces the final result which is typically a list of values.
MapReduce (MR) is a programming framework developed by Google to address the previous problems. An MR program requires (at least) two components:
1 A mapper is used to filter the input data.
2 A reducer performs a summary of the information provided by the mapper.
The MR framework takes charge of running in parallel multiple mappers/reducers, handles data redundancy, faults, etc. Formal definition
Input data to the problem must be composed of key/value pairs (k, v), belonging to two generic domains k ∈ Min and v ∈ Vin. The data is initially filtered according to a function:
MAP(k, v) = list(k2, v2)
where the output data can belong to different domains k2
∈ Mmap and v2 ∈ Vmap. The results from the map operations can be shuffled and collected, and finally reduced using a different function:
REDUCE(k2, list(v2)) = (k2, list(v3)), with v3 ∈ Vout.
4.2. MapReduce workflow in MATLAB
• The input data is saved in a particular object called datastore, which handles data distribution and partitioning in chunks.
• Each data chunk is processed by a different map function, and the result is stored in an intermediated object of class KeyValueStore.
• The intermediate outputs are grouped by key (i.e. by k2 in our formal definition).
• Each group of KeyValueStore elements is processed by a reduce function.
• Final results are saved in an output datastore object.
4.2.1. Classification Techniques using MATLAB
Thedesigned model allows the k-Nearest neighbor classifier to scale todatasets ofarbitrarysize,justbysimplyaddingmorecomputingnodes if necessary. Moreover, this parallel implementation provides the exact classification rate as the original K-NN model.The conducted experiments, using a dataset with up to 1million instances, show the promising scalability capabilities ofthe proposedapproach.Diabetes mellitus is one of the most serious health challenges in both developing and developed countries. According to the International Diabetes Federation, there are 285 million diabetic people worldwide. This total is expected to rise to 380 million within 20 years.
diabetes disease from highdimensional medical dataset. The experimentalresults obtained show that support vectormachine can be successfully used for diagnosingdiabetes disease. SVM with Radial basis function kernel is used for classification. The performance parameters such as the classification accuracy, sensitivity, and specificity of the SVM and RBF have found to be high thus making it a good option for the classification process.
4.3. K - Nearest Neighbor Algorithm
KNN is a method which is used for classifying objects based on closest training examples in the feature space. KNN is the most basic type of instance-based learning or lazy learning. It assumes all instances are points in n-dimensional space.K-nearest neighbor is a supervised learning algorithm where the result of new instance query is classified based on majority of K-nearest neighbor category. The purpose of this algorithm is to classify a new object based on attributes and training samples. This algorithm used neighborhood classification as the prediction value of the new query instance. A distance measure is needed to determine the “closeness” of instances. KNN classifies an instance by finding its nearest neighbors and picking the most popular class among the neighbors.
4.3.1. Features of KNN
a) All instances of the data correspond to the points in an n-dimensional Euclidean space
b) Classification is delayed till a new instance arrives c) In KNN, the Classification is done by comparing feature vectors of the different points in a space region.
d) The target function may be discrete or realvalued. An arbitrary instance is represented by(a1(x), a2(x), a3(x),.., an(x)), where ai(x) denotes features. Euclidean distance between two instances d(xi, xj)=sqrt (sum for r=1 ton (ar(xi) - ar(xj))2 ). The k-nearest neighbor algorithm is simplest of all machine learning algorithms and it is analytically tractable. In KNN, the training samples are mainly described by n-dimensional numeric attributes. The training samples are stored in an dimensional space. When a test sample (unknown class label) is given, k-nearest neighbor classifier starts searching the ‘k’ training samples which are closest to the unknown sample or test sample.
Closeness is mainly defined in terms of Euclidean distance. The Euclidean distance between two points P and Q i.e. P (p1,p2, …. Pn) and Q (q1, q2,..qn) is defined by the following equation:-
The Simple KNN algorithm is
• Take a sample dataset of n columns and m rows named as R .In which n-1th columns near the input vector and nth column is the output vector
• Take a test dataset of n-1 attributes and y rows named as P.
• Find the Euclidean distance between every S and T
• Then, Decide a random value of K. K is the no. of nearest neighbors.
• Then with the help of these minimum distance and Euclidean distance find out the nth column of each.
• Find out the same output values.
If the values are same, then the patient is diabetic, otherwise not. After this, the accuracy rate and the error rate of the data set are being calculated. The accuracy rate shows that how many outputs of the test dataset are same as the output of the data of different features of the training dataset. The error rate is showing that how many outputs of the data of the test dataset are not same as the output of the data of different features of the training dataset. KNN is a highly effective inductive inference method for noisy training data and complex target functions.
4.3.2. Algorithm: K Nearest Neighbor Approach
Let G = {g1,g2,…,gn} be a set of n labeled objects. X={x1,x2,…,xm} be a training vector with known class labels. Y={y1,y2,…,yk} be a set of testing gene vector without class labels. The algorithm is defined as follows:
Algorithm: KNN
Input: Training Diabetics data With Class Labels. Testing Diabetics data Without Class Labels. Value For K = Number Of K Nearest Neighbors.
Output: Predicted Classes For Test Data. begin
Input y, of unknown classification. Set K, 1 K n.
Initialize i=1.
do until ( K-nearest neighbors found)
Compute distance from y to xiusing Equation[5.6],[5.7] if (i K) THEN
Include xi in the set of K-nearest neighbors
else if ( xi is closer to y than any previous nearest neighbor)THEN Delete farthest in the set of K-nearest neighbors
Include xiin the set of K-nearest neighbors. end if
Increment i. end do until
Determine the majority class represented in the set of K-nearest neighbors. if (no tie occurs) then
Classify y in the class of minimum sum else
end if else
Classify y in the majority class end if
end
4.4. Support Vector Machine
SVMs are set of related supervised learning methods used for classification and regression [2]. They belong to a family of generalized linear classification. A special property of SVM is, SVM simultaneously minimize the empirical classification error and maximize the geometric margin. So SVM called Maximum Margin Classifiers. SVM is based on the Structural risk Minimization (SRM). SVM map input vector to a higher dimensional space where a maximal separating hyperplane is constructed. Two parallel hyperplanes are constructed on each side of the hyperplane that separate the data. The separating hyperplane is the hyperplane that maximize the distance between the two parallel hyperplanes. An assumption is made that the larger the margin or distance between these parallel hyperplanes the better the generalization error of the classifier will be [2]. We consider data points of the form
{(x1,y1),(x2,y2),(x3,y3),(x4,y4)……….,(xn, yn)}. Where yn=1 / -1 , a constant denoting the class to which that point xn belongs. n = number of sample. Each xn is p-dimensional real vector. The scaling is important to guard against variable (attributes) with larger variance. We can view this Training data , by means of the dividing (or separating) hyper plane , which takes
w . x + b = o
Where b is scalar and w is p-dimensional Vector. The vector w points perpendicular to the separating hyperplane. Adding the offset parameter b allows us to increase the margin. Absent of b, the hyperplane is forced to pass through the origin, restricting the solution. As we are interesting in the maximum margin, we are interested SVM and the parallel hyperplanes. Parallel hyperplanes can be described by equation
w.x + b = 1 w.x + b = -1
If the training data are linearly separable, we can select these hyperplanes so that there are no points between them and then try to maximize their distance. By geometry, We find the distance between the hyperplane is 2 / │w│. So we want to minimize │w│. To excite data points, we need to ensure that for all I either
[image:5.595.311.563.235.465.2]w. xi – b ≥ 1 or w. xi – b ≤ -1 This can be written as yi ( w. xi – b) ≥1 , 1 ≤ i ≤ n
Figure 4.2: Maximum margin hyperplanes for a SVM trained with samples from two classes
5. Experiment Analysis and Result
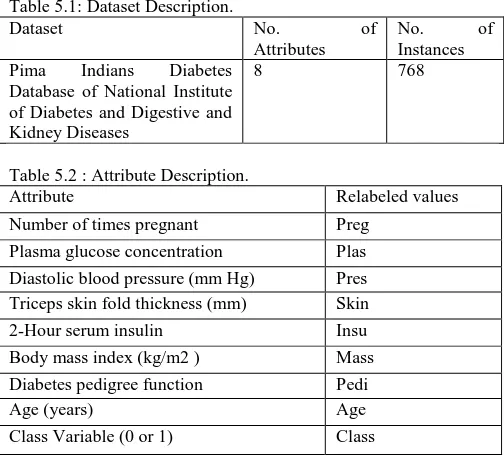
The work explores the aspect of ANN and SVM Classifier as Data Mining techniques in determining diabetes in women. The main objective is to forecast if the patient has been affected by diabetes using the data mining tools by using the medical data available. The classification type of data mining has been applied to the Pima Indians Diabetes Database of National Institute of Diabetes and Digestive and Kidney Diseases. Table 5.1 shows a brief description of the dataset that is being considered.
Table 5.1: Dataset Description.
Dataset No. of
Attributes
No. of Instances
Pima Indians Diabetes Database of National Institute of Diabetes and Digestive and Kidney Diseases
8 768
Table 5.2 : Attribute Description.
Attribute Relabeled values Number of times pregnant Preg
Plasma glucose concentration Plas Diastolic blood pressure (mm Hg) Pres Triceps skin fold thickness (mm) Skin 2-Hour serum insulin Insu Body mass index (kg/m2 ) Mass Diabetes pedigree function Pedi
Age (years) Age
Class Variable (0 or 1) Class
5.1.Validation measures
In this work, the accuracy measures Precision, Recall and specificity were used for measuring accuracy rate of three classification algorithms namely Fuzzy Soft set based classification, K-nearest neighbor approach and Fuzzy K-NN algorithm [4].
5.2. Precision
Precision is a measure of the accuracy provided that a specific class has been predicted. It is defined by:
Precision =tp/(tp+fp)
Where tp and fp are the numbers of true positive and false positive predictions for the considered class.
5.3. Recall
Recall is a measure of the ability of a prediction model to select instances of a certain class from a data set. It is commonly also called sensitivity, and corresponds to the true positive rate.
Recall/Sensitivity= tp/(tp+fn)
5.4. Specificity
Specificity, which is a measure that is commonly, used in two class problems where one, is more interested in a particular class. Specificity corresponds to the True – negative Rate.
[image:5.595.54.231.595.719.2]5.5. Overall classification Accuracy
Accuracy is the overall correctness of the model and is calculated as the sum of correct classifications divided by the total number of classification.
Accuracy=(True Classification)/(Total no of cases).
5.6.Performance Evaluation
Performance of Classification algorithms is evaluated by using accuracy measures for the diabetic’s dataset on before and after dimensionality reduction using mapreduce.
[image:6.595.310.565.60.280.2]The performance of Classification algorithms is analyzed based on Precision, Sensitivity and specificity validity measures on before and after MapReduceand the results are shown in Table 5.3.
Table 5.3: Performance evaluation
Accuracy Measures
Before Mapreduce After Mapreduce
KNN SVM KNN SVM
Precision 0.78 0.83 0.82 0.85
Sensitivity 0.75 0.78 0.80 0.82
Specificity 0.86 0.90 0.91 0.94
The performance of the KNN Classification algorithm is analyzed based on Precision , Sensitivity and specificity validity measures on before and after MapReduceand the results are shown in Fig 5.1.
0 0.5 1
Precision Sensitivity Specificity
[image:6.595.35.282.226.337.2]Before After
Figure 5.1: KNN Performance Evaluation
The performance of SVM Classification algorithms is analyzed based on Precision, Sensitivity and specificity validity measures on before and after MapReduceand the results are shown in Fig 5.2.
0 0.2 0.4 0.6 0.81
Precision Sensitivity Specificity
[image:6.595.39.280.401.495.2]Before After
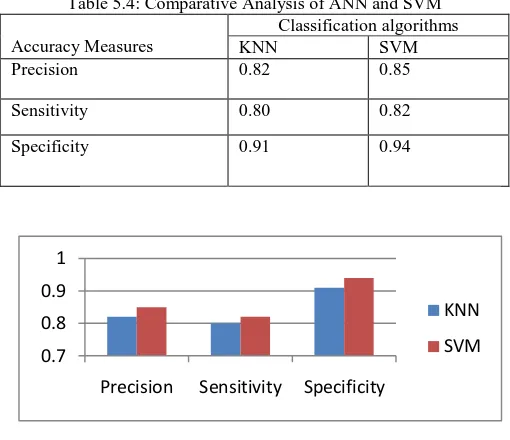
Figure 5.2: SVM Performance Evaluation The comparative analysis of Classification algorithms is analyzed based on Precision, Sensitivity and specificity validity measures on after MapReduceand the results are shown in Table 5.4.
Table 5.4: Comparative Analysis of ANN and SVM
Accuracy Measures
Classification algorithms
KNN SVM
Precision 0.82 0.85
Sensitivity 0.80 0.82
Specificity 0.91 0.94
0.7 0.8 0.9 1
Precision Sensitivity Specificity
KNN SVM
Figure 5.3: Comparative Analysis
Table 5.5: Overall Accuracy for Classification Algorithms
Classification Algorithm Accuracy
KNN 88 %
SVM 93 %
6. Conclusion
The automatic diagnosis of diabetes is an important real-world medical problem. Detection of diabetes in its early stages is the key for treatment. This work shows how KNN and SVM are used to model actual diagnosis of diabetes for local and systematic treatment, along with presenting related work in the field on before and after MapReduce. Experimental results show the effectiveness of the proposed model. This research work also shows the importance of the MapReduceapproach for the performance of classification techniques after MapReduceis better than the performance before MapReduce. In future it is planned to gather the information from different locales over the world and make a more precise and general prescient model for diabetes conclusion. Future study will likewise focus on gathering information from a later time period and discover new potential prognostic elements to be incorporated. The work can be extended and improved for the automation of diabetes analysis.
References
1. Jiawei Han and Micheline Kamber, "Data Mining Concepts and Techniques”, Morgan Kauffman Publishers, 2001 2. S. Kumari and A. Singh, “A Data Mining Approach for the
Diagnosis of Diabetes Mellitus”, Proceedings of Seventh lnternational Conference on Intelligent Systems and Control, pp. 373-375, 2013.
3. C. M. Velu and K. R. Kashwan, “Visual Data Mining Techniques for Classification of Diabetic Patients”, 3rd IEEE International Advance Computing Conference (IACC), 2013 4. S.Sankaranarayanan and Dr Pramananda Perumal.T,
[image:6.595.39.278.560.684.2]5. Mostafa Fathi Ganji and Mohammad Saniee Abadeh, “Using fuzzy Ant Colony Optimization for Diagnosis of Diabetes Disease”, Proceedings of ICEE 2010, May 11-13, 2010
6. T.Jayalakshmi and Dr.A.Santhakumaran, “A Novel Classification Method for Diagnosis of Diabetes Mellitus Using Artificial Neural Networks”, International Conference on Data Storage and Data Engineering, 2010.
7. Sonu Kumari and Archana Singh, “A Data Mining Approach for the Diagnosis of Diabetes Mellitus”, Proceedings of 71th lnternational Conference on Intelligent Systems and Control ISCO – 2013.
8. White, A.P., Liu, W.Z.: Technical note: Bias in information-based measures in decision tree induction. Machine Learning 15(3), 321–329, 1994.
9. A.S. Manjunath, M.A. Jayaram, “Application of Genetic Algorithm Optimized Neural Network Connection Weights for Medical Diagnosis of Pima Indians Diabetes”. International Journal on Soft Computing ( IJSC ), Vol.2, No.2, May 2011.
10. Changjing Shang and Qiang Shen, “Aiding Classification of Gene Expression Data with Feature Selection: A Comparative Study”, International Journal of Computational Intelligence Research. ISSN 0973-1873 Vol.1, No.1, pp. 68–76, 2005. 11. Ping Chang and Jeng-Shong Shih, “The Application of Back
Propagation Neural Network of Multi-channel Piezoelectric Quartz Crystal Sensor for Mixed Organic Vapours”.Tamkang Journal of Science and Engineering, Vol. 5, No. 4, pp. 209-217, 2002.
12. Pradipta Maji and Sankar K. Pal, “Fuzzy–rough sets for information measures and Selection of relevant genes from microarray data”, IEEE transactions on systems, man, and cybernetics—part b: cybernetics, vol. 40, no. 3, June 2010. 13. Qiang Shen, Alexios Chouchoulas, “ A Rough fuzzy approach
for generating classification rules”, ww.elsevier.com/locate/patcog, Pattern R
ecognition 35 (2002) 2425 – 2438.
14. Ronaldo C. Prati, Gustavo.E. A, Batista.P.A, and Maria C. Monard, “Class imbalances versus class overlapping: an analysis of a learning system behavior”. Springer-Verlag Berlin Heidelberg 2004.
15. Sellappan Palaniappan, Tan Kim Hong, “Discretization of Continuous Valued Dimensions in OLAP Data Cubes”.IJCSNS International Journal of Computer Science and Network Security, VOL.8 No.11, November 2008.
16. K.Thangavel, P.Jaganathan,A.Pethalakshmi, Karnan.,“Effective Classification with Improved Quick
Reduct For Medical Database Using Rough System”, BIME Journal, Volume (05), Issue (1), Dec., 2005.
17. Karegowda, M.A. Jayaram, A.S. Manjunath, “Cascading K-means Clustering and KNearestNeighbor Classifier for Categorization of Diabetic Patients” IJEAT Vol.1 No.3 pp 147-151,2012.
18. Hardik Maniya, Mosin I. Hasan, Komal P.Patel “Comparative study of Naïve Bayes Classifier and KNN for Tuberculosis”, IJCA pp 22-26,2011.
19. W. Yu, and W. Zhengguo (2007), “A Fast KNN algorithm for text categorization”, Proceedings of the Sixth International Conference on Machine Learning and Cybernetics, Hong Kong, pp.3436-3441
20. Asha Gowda Karegowda ,MA.Jayaram‘Integrating Decision Tree and ANN for Categorization of Diabetics Data’ International Conference on Computer Aided Engineering, December 13-15, IIT Madras, Chennai, India in 2007. 21. Siti Farhanah Bt Jaafar and DannawatyMohdAli, “Diabetes
mellitus forecast using artificial neural networks”, Asian conference of paramedical research proceedings, 5-7, September, , Kuala Lumpur, MALAYSIA in 2005.
22. Rajeeb Dey and Vaibhav Bajpai and Gagan Gandhi and Barnali Dey, ”Application of artificial neural network technique for diagnosing diabetes mellitus”, IEEE Region 10 Colloquium and the Third ICIIS, Kharagpur, INDIA December 8-10 in 2008.
23. Y. Angeline Christobel, P.Sivaprakasam, “A New Classwise k nearest Neighbor (CKNN) Method for the Classification of Diabetes Dataset”.
24. “Forecast of Diabetes using Modified Radial basis Functional Neural Networks” International Conference on Research Trends in Computer Technologies (ICRTCT) Proceedings published in International Journal of Computer Applications® (IJCA) (0975 – 8887) ,G. Magudeeswaran and D. Suganyadevi, Sreesaraswathi Thyagaraja College Pollachi-642 107, Tamil Nadu in 2005.
25. “Diagnosis of Diabetes Mellitus based on Risk Factors” International Journal of Computer Applications (0975 – 8887) Volume 10– No.4, November 2010
26. Nahla H. Barakat, Andrew P. Bradley, and Mohamed Nabil H. Barakat,”Intelligible support vector machines for diagnosis of diabetes mellitus”, IEEE transaction on information technology in Biomedicine, Vol. 14, No. 4, July 2010.
27. A. H. Project, “Apache hadoop,” 2015. [Online]. Available: http: //hadoop.apache.org/
28. A. M. Project, “Apache mahout,” 2015. [Online]. Available: http: //mahout.apache.org/
29. M. Zaharia, M. Chowdhury, T. Das, A. Dave, J. Ma, M. McCauley, M. J. Franklin, S. Shenker, and I. Stoica, “Resilient distributed datasets: A fault-tolerant abstraction for in-memory cluster computing,” in Proceedings of the 9th USENIX conference on Networked Systems Design and Implementation. USENIX Association, 2012, pp. 1–14. 30. A. Frank and A. Asuncion, “UCI machine learning
repository,” 2010. [Online]. Available: http://archive.ics.uci.edu/ml in 2010.
31. National Diabetes Information Clearinghouse (NDIC), http://diabetes.niddk.nih.gov/dm/pubs/type1and2/#signs
32. Global Diabetes Community,