Volume 3, No. 7, Nov-Dec 2012
International Journal of Advanced Research in Computer Science
RESEARCH PAPER
Available Online at www.ijarcs.info
ISSN No. 0976-5697
Stress Recognition in Physiological Signals from Drivers
Dhananjay Kumar*
Department of Biomedical Engineering, School of BioSciences and Technology (SBST)
VIT University, Vellore TamilNadu, India dhananjay.k.choubey@gmail.com
Anshul Sarvate
Department of Biotechnology, School of BioSciences and Technology (SBST)
VIT University, Vellore TamilNadu, India
Kumar Gaurav Shankar
Department of Computer Science JNU
Abstract: The work deals with the fatigue analysis of automobile drivers by acquiring their physical signals.It is done by acquiring the E.C.G. signal of drivers.The QRS wave complex of E.C.G is detected and its width and amplitude is found out. The whole work is done is time domain, QRS is detected using Pan Tompkins algorithm.Neural network is trained using nntoolbox of MATLAB. Due to significant real time fatigue condition of drivers, it is competent to lessening the figure of accidents to a major extent. The fatigue analysis is being processed by correlating the acquired signals obtained from a team of drivers in different driving conditions by the use of MATLAB software.
Keywords: ECG, MATLAB, QRS Complex, neural network
I. INTRODUCION
The increasing employ of on-board electronics and in-vehicle info systems has prepared the estimation of driver job require an region of increasing value to both governing bodies and industrialists [1] and accepting driver irritation has been listed by global research groups as a important area for rectify intellectual transportation systems [2]. Protocols to evaluate drivers workload have been developed using eye glimpse and on-road metrics, but these have been criticized due to its high cost value and difficulty of getting [3], and consistent heuristics such as the 15-Second law for whole work time, planned to provide an higher boundary for the whole time acceptable for completing a navigation system work, do not give exibility to report for alteration in the driver's surroundings [3]. As a substitute, this study shows how physiological sensors can be used to acquire electronic signals that can berefined automatically by an on-board computer to provide active indications of a driver's interior status under normal driving conditions. These kinds of matriceshave been projected for combat aircraft pilots [4] and have been used in simulations [5], but have not been used for the detection of stress levels approximating a regular daily travel using sensors that do not frustrate drivers' opinion of the path.
This experimentation was planned to observe drivers' physiologic reactions during real-world driving situations under regular conditions. Executing an experiment in actual traffic situations ensures that the results will be more directly relevant to use in these situations; on the other hand it imposes constraints on the kinds of sensors that can be used and the level to which investigational conditions can be controlled. Within these constraints, two types of investigation were performed on the collected signals.
Investigation I was intended to distinguish three common stress levels: low, medium, and high using five minute intervals of records from well defined segments of rest, city and highway driving. For this investigation, features from all sensors were pooled using a model recognition procedure and the diverse types of segments were recognized. Investigation II was intended to offer a more comprehensive description of how individual physiological features changes with driver stress at every second of the drive, including those segments of the drive between the rest, city and highway segments. For this investigation a regular metric of observed stressors was created by scoring video recording from individual drives. This metric was then correlated with features derived from all of the sensors on a regular basis. Traditionally, stress has been explained as a response from a peaceful state to an agitated state for the reason of preserving the integrity of the individual. For an individual as well developed and sovereign of the natural atmosphere as socialized man, the majority stressors are thinker, emotional and perceptual[6].
Pan Tomkins algorithm is used for the detection of QRS complex. This algorithm has four steps-Band pass filter: the output of high pass filter and the output of low pass filter is subtracted to get band pass filter.
Differentiator: It is used to approximate the ideal d/dt oprrator uoto 30Hz and it suprreses the low frequency component of P and r wave.
Squaring: It makes the result positive and adds up the large difference of QRS complex.
Integration: It smoothens up the output.
target data.when there is increase in width or amplitude this indicated the stress.
The recognition algorithm presented in investigation could be run in actual time by having the on-board computer maintain a continuously updated trace of the data from the last five minutes of the drive in memory and doing the investigation constantly on this pane of data. Even if none of the physiological signals monitored here respond fast enough to contribute to automatic vehicle control, this kind of constant monitoring, with a one to three minute delay in driver status assessment, is quick adequate to begin modified changes to the driver's in-vehicle atmosphere to assist mitigate emotional distress. For example in elevated stress situations, few users might wish visual navigation prompts to turn on or dim, since these types of warnings have been found to have a negative impact on situational consciousness [9]. On the other hand, if intelligent accident prevention were safely available in low speed traffic jams, driving could become entirely automated in such situations and a irritated driver could lighten up by watching a movie or by working on their laptop.
II. MATERIALS AND METHODS
A. MATLAB:
This software is used to analyze the physiological signal. In matlab first the E.C.G. signal was loaded, then the dirft was cancelled, then high pass filter was designed, then a low pass filter was designed then the difference of these two filters were taken. Then derivative filter was operated on the signal, this filter cancels the low frequency component of P and T wave. Then the signal was squared where the negative wave will become positive, then the average of the signal was taken.
B. Pan Tomkins Algorithm:
This algorithm is used for detecting the QRS wave complex.
This algorithm has four steps:
a. Band pass filter: The difference of high pass filter and low pass filter is a band pass filter.
b. Derivative operator: This removes up to 30 HZ of noise,it suppreses the low frequency component of P and T Wave.
c. Squaring: This makes a result positive and adds up the difference of QRS complex.
d. Integration: This will smoothen the output.
C. Nntoolbox:
This toolbox is used for the training of neural network. This is avaliable in toolbox section of MATLAB.
III. RESULTS AND DISCUSSION
A real time implementation would have been difficult to test on this driving route because the stress levels for the driving conditions outside of the rest, city and highway segments was not well defined by the design. To better assess the stress conditions of the entire drive, analysis looked at sixteen drives individually and created a continuous record of observable stressors from video tapes of the entire drive. This analysis also calculated continuous variables for each of the sensors and compared them to a continuous metric stress indicators scored throughout the
entire drive. These variables were evaluated to determine which features provided the best single continuous indicator of driver stress.
In new concept cars, such as the Toyota Pod car, continuous signals that correlate highly with stress level could be used to control the expressive changes in the cars lights and color [11], perhaps alerting others to the extra load on that driver. Furthermore, using aggregate continuous records of driver stress over a common commuting path, city planners could help quantify the emotional toll of traffic trouble spots" which could help prioritize road improvements.
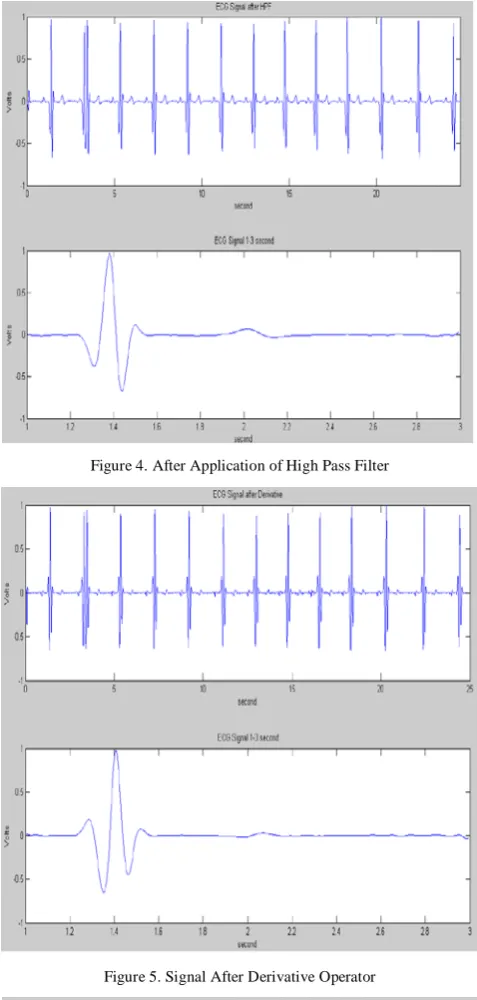
For this experiment, heart rate, ECG, data were used (fig1). The algorithm was first tested on the thirty minute training segments, and then it was run continuously to detect stress in real time. We have performed the pan tomkins algorithm for each step by designing a code for the given criteria In most biosignals, the signal excursion is restricted to a small range, superimpose on a outsized baseline which may slowly drift over a big range (fig2). After that we have performed for the low pass filter in which high frequency signal were stopped there only ,low frequency signal were further analyzed (fig3). Then same study has been performed using high pass filter and data was anlysed where high frequency signal were analyzed only (fig4). Further derivative operator was used to reduce the noise atleast upto 30Hz.It remove low frequency signals of P and T waves as shown in fig5.
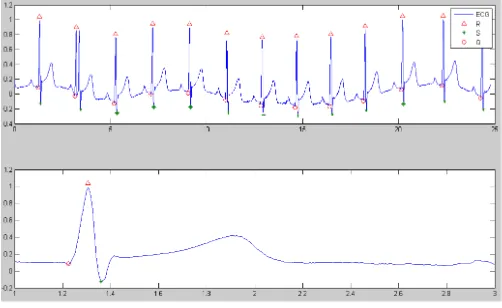
In next step squarting was performed, in this step negative signal gets changed into positive signal and big difference in QRS is added (fig6). Averaging has been performed in the next step, where average of all the signal has been taken at a time (fig7). After this integration has been performed for smoothening of the signal as it has been described in the (fig8). Finally the QRS wave has been detected for the drivers as displayed in (fig9). In this way when a high stress level was detected, the simulation adapted by turning of two of the subtasks, enabling a 33% reduction in errors (fig 10, 11,12). Analysis for road conditions could be made constant and drivers could be allowed to make safe errors while talking on the cell phone or using visual navigation aids. If a high stress condition were detected using the algorithm on the last ten minutes of data, the driver distractions could be turned off until the driver recovered to a medium stress level.
booths, were taken which was just was just over ten minutes long.
Figure 1. Input Figure of the QRS Detection
Figure 2. Drift After Cancellation
Figure 3. After Application of Low Pass Filter
Figure 4. After Application of High Pass Filter
Figure 5. Signal After Derivative Operator
Figure 7. Signal After Averaging Figure 8. Signal After Integration
Figure 9. QRS Detection
This is the step of detection of QRS complex, from the workspace
left = Columns 1 through 7
279 643 989 1347 1726 2135 2525
Columns 8 through 13
2893 3267 3664 4078 4478 4851 right = Columns 1 through 7
326 691 1037 1395 1773 2182 2573
Columns 8 through 13
2941 3315 3712 4125 4526 4899 z = 379.9000
hr = 31.5873
Figure 10. Performance graph
Figure 11. Network Training Tool
Figure 12. Creating Network Data
IV. CONCLUSION
In the future, we may want vehicles to be more intelligent and responsive, managing information delivery in the context of the driver's situation. Physiological sensing is one method of accomplishing this goal. This study tested the applicability of physiological sensing for determining a driver's overall stress level in a real environment using a set of sensors that do not interfere with the driver's perception of the road.
V. REFERENCES
[1]. Y. I. Noy. (2001) International harmonized research activities report of working group on intelligent transportation systems (ITS).Proceedings of the 17th International Technical Conference on the Enhanced Safety of Vehicles. [Online]. Available:
[2]. P. Burns and T. C. Lansdown. (2000) E-distraction: The challenges for safe and usable internet services in vehicles.NHTSA Driver Distraction Internet Forum. [Online].Available:http://www.nrd.nhtsa.dot.gov/departme nts/nrd-13/driverdistraction/Papers.htm
[3]. National Highway Tra_c Safety Administration (NHTSA). Proposed driver workload metrics and methods project. [Online].Available:http://www.nrd.nhtsa.dot.gov/departme nts/nrd-13/driver-distraction/PDF/32.PDF
[4]. M. J. Skinner and P. A. Simpson, \Workload issues in military tactical aircraft," Int. J. of Aviat. Psych.,2002, vol. 12, no. 1, pp.79-93.
controlled adaptive aiding," Proceedings of the Human Factors and Ergonomics Society 46th Annual Meeting, 1999, vol. 3, pp. 61- 64.
[6]. H. Selye, Selye's Guide to Stress Research. Van Nostrand Reinhold Company, 1980.
[7]. I. J. K. G. Eisenhofer and D. Goldstien, \Sympathoadrenal medullary system and stress," in Mechanisms of Physical and Emotional Stress. Plenum Press, 1988.
[8]. A. Baddeley, Selective attention and performance in dangerous environments," British Journal of Psychology, 1972, vol. 63, pp. 537- 546.
[9]. M. Vidulich, M. Stratton, and G. Wilson, \Performance-based and physiological measures of situational awareness," Aviation, Space and Environmental Medicine, May 1994, pp. 7-12.
[10]. R. Helmreich, T. Chidster, H. Foushee, S. Gregorich, and J. Wilhelm, How e_ective is cockpit resource management training? issues in evaluating the impact of programs to enhance crew coordination," Flight Safety Digest,1990, vol. 9, no. 5, pp. 1- 17.