70:1 (2014) 107–115 | www.jurnalteknologi.utm.my | eISSN 2180–3722 |
Full paper
Jurnal
Teknologi
Full paper
Effects of Compressed Natural Gas (CNG) Injector Position on Intake
Manifold towards Diesel-CNG Dual Fuel (DDF) Engine Performance
A. Supeea*, R. Mohsinb, Z. A. Majidb, M. I. Raizc
aFaculty of Petroleum and Renewable Energy Engineering (FPREE), Universiti Teknologi Malaysia, 81310 UTM Johor Bahru, Johor, Malaysia
bUTM-MPRC Institute for Oil and Gas (formerly known as Gas Technology Centre-GASTEG), Universiti Teknologi Malaysia, UTM Johor Bahru, Johor, Malaysia
d
Faculty of Petroleum and Renewable Energy Engineering (FPREE), Universiti Teknologi Malaysia, UTM Johor Bahru, Johor, Malaysia
*Corresponding author: [email protected]
Article history
Received :28 November 2013 Received in revised form : 4 July 2014
Accepted :15 August 2014
Graphical abstract
Abstract
In Diesel-CNG (Compressed Natural Gas) Dual Fuel (DDF) system, CNG is generally inducted in the intake manifold by CNG injector which is mounted on the intake manifold whereas diesel fuel is directly injected into engine cylinder using existing diesel fuel injector system. Status quo of optimum CNG injector position on intake manifold will provide better gaseous fuel mixing quality, produce high turbulence kinetic energy and thus improve the performance of the diesel engine under DDF system. Thus, under full load condition at 2750 rpm, the engine performance and exhaust gas emissions tests such as nitric oxides (NOx), carbon
dioxide (CO2), carbon monoxide (CO) and hydrocarbon (HC) were conducted on a diesel engine under DDF
system for optimization of CNG injector position. Four CNG injector position on intake manifold were selected and optimum position of CNG injector was found to be at "position 2" which results in higher power output and less exhaust gas emissions. Further analysis by Computational Fluid Dynamics (CFD) shows that CNG injector at "position 2" exhibit better quality of homogeneous CNG-air mixture and higher turbulence kinetic energy compared to other position. Based on the findings, an optimization of CNG injector position on intake manifold provide promising modification method due to the simple, cheaper and commercially acceptable.
Keywords: Diesel-CNG dual fuel (DDF) system; optimum CNG injector position on intake manifold; power output; exhaust gas emissions; Computational Fluid Dynamics (CFD)
Abstrak
Dalam sistem dwi bahan bakar Diesel-CNG (Gas Asli Termampat), lazimnya CNG dimasukkan ke dalam pancaroga pengambilan melalui penyuntik CNG yang dipasang di pancaroga pengambilan manakala bahan bakar diesel disuntik secara terus ke dalam silinder enjin menggunakan sistem suntikan bahan bakar diesel sedia ada. Status bahawa kedudukan optimum penyuntik CNG pada pancaroga pengambilan akan memberikan kualiti campuran bahan bakar gas yang lebih baik, menghasilkan tenaga kinetik gelora yang tinggi dan seterusnya mempertingkatkan prestasi enjin diesel yang menggunakan sistem DDF. Oleh itu, dalam keadaan bebanan penuh pada 2750 rpm, ujian prestasi enjin dan pengeluaran gas ekzos seperti nitrik oksida (NOx), karbon dioksida (CO2), karbon monoksida (CO) dan hidrokarbon (HC) telah dilakukan ke atas
enjin diesel yang menggunakan sistem DDF bagi pengoptimuman kedudukan penyuntik CNG. Empat kedudukan penyuntik CNG di pancarongga pengambilan telah dipilih dan kedudukan optimum penyuntik CNG telah ditemui di "kedudukan 2" yang mana menghasilkan kuasa keluaran yang lebih tinggi dan pengeluaran gas ekzos yang kurang. Analisis lanjutan oleh Computational Fluid Dynamics (CFD) menunjukkan bahawa penyuntik CNG di "kedudukan 2" mempamerkan kualiti campuran CNG-udara yang lebih baik dan tenaga kinetik gelora yang lebih tinggi berbanding dengan kedudukan lain. Berdasarkan penemuan ini, pengoptimuman kedudukan penyuntik CNG di pancaroga pengambilan memberikan kaedah pengubahsuaian yang baik kerana ianya mudah, lebih murah dan diterima secara komersial.
Kata kunci: Sistem dwi bahan bakar Diesel-CNG (DDF); kedudukan optimum injektor CNG di pancaroga pengambilan; kuasa keluaran; pengeluaran gas ekzos; Computational Fluid Dynamics (CFD)
1.0 INTRODUCTION
Environmental pollution released by conventional diesel engines and also the rising cost of the diesel liquid fuel exhibit that many research have been conducted in order to find the best solution to overcome these issues.With current advancement in automotive technologies, diesel-compressed natural gas (CNG) dual fuel (DDF) engines provide a short-medium solution in term of pollution emissions and fuel consumption reduction [1-4].CNG is a clean burning fuel and have high octane number which is suitable for relatively high compression ratio diesel engines. Besides that, it can generate homogeneous mixture when mixes with air, produce an efficient combustion and results in substantial reduction in exhaust gas emissions [5-8].
Currently, only two type of methods are available for CNG injection in DDF system. It is either directly injected in the cylinder or in most applications to date, it is inducted in the intake manifold [9-10].For the second method, CNG and air are mixed and compressed as in a conventional diesel engine.The mixture of air and gaseous fuel unable to auto ignite themselves due to their high auto-ignition temperature. Hence, the injection of "pilot" amount of liquid diesel fuel near the end of compression stroke will initiate the combustion of CNG-air mixture.Diesel fuel auto-ignite and acts as ignition sources for the surrounding air-gaseous mixture [11-14].
Performance of the DDF engines in term of power output and exhaust gas emissionsare greatly influenced by the optimum position of CNG injector fixed on the intake manifold. If the CNG injector mounted at a large distance from the engine cylinder for the purpose of allowing extra mixing time, entire inducted gaseous fuel unable to reach into the cylinder within the available time meanwhile if the CNG injector mounted close to the engine cylinder, the fluids unable to mix appropriately due to insufficient mixing time. As a results, low turbulence kinetic energy and poor mixture quality produced and lead to the drop in DDF engine performance. Previous works proved that there exist relationship between the position of CNG injector mounted on the intake manifold with the degree of homogeneous mixture formation produced [15]. Optimum CNG injector position on intake manifold results in better quality of homogeneous mixture produced and disadvantage such as fuel accumulation which lead to the chances of backfiring can be avoided. Besides that, power output and efficiency of the DDF engines also affected by the amount of air induced in engine cylinder. Reduction of the air quantity induced will lead to a drop in power and efficiency. Therefore, DDF engines should not to be throttled on the air side [10].
The main objectives of this research are to propose an optimum position of CNG injector mounted on intake manifold and to determine the effects of injector position towards diesel engine performance in term of power output and exhaust gas emissions. The ratio for the diesel and CNG fuels consumption for the tested engine was set to the 30:70 respectively via diesel and CNG Electronic Control Unit (ECU) setting whereas for the air, it was admitted to the intake manifold without controlled or un-throttled. In the first part of this research, power output and exhaust gas emissions tests under full load condition at 2750 rpm were conducted on a diesel engine under DDF system for optimization of CNG injector position. The emissions tested included nitric oxides (NOx), carbon dioxide (CO2), carbon
monoxide (CO) and hydrocarbon (HC) emissions. For the second part, Computational Fluid Dynamics (CFD) analysis software (FLUENT Version 6.2.16) was used to investigate the possible mechanisms for an optimum position of CNG injectors that resulted in better engine performance focused in flow behavior of methane and air in intake manifold. The results for both parts
were presented in theform ofgraphs, visual illustration of CNG-air concentration and turbulence kinetic energy respectively.
2.0 EXPERIMENTAL
2.1 Type of Fuels
2.1.1 Compressed Natural Gas (CNG)
CNG used in this research has been supplied by Gas Malaysia Sdn. Bhd. (GMSB). Composition of CNG consists of 92.73% methane, 4.07% propane and 3.20% of other hydrocarbon. Table 2.1 shows physical and chemical properties of natural gas used [16].
Table 2.1 Physical and chemical properties of CNG [16]
Properties Description
Appearance Colourless gas
Odour Pungent ordour - Mercaptan mixture added
Boiling point -162 °C Vapor density at
760 mm Hg
0.747 kg/Sm3
Specific gravity at 760 mm Hg
0.61
Flash point -187 °C Auto ignition
temperature
537 °C
2.1.2 Diesel
Diesel fuel used in this research hasbeen supplied by Petroliam Nasional Berhad (Petronas). The physical and chemical properties of the diesel fuel is stated in Table 2.2 [17].
Table 2.2 Physical and chemical properties of diesel [17]
Properties Description
Kinematic viscosity at 40°C
1.5 mm2/s (minimum) 5.8 mm2/s (maximum)
Lubricity 460 µm (maximum)
Total sulphur 500 mg/kg (maximum) Cetane number 49 (minimum) Flash point 60 °C (minimum) Density at 15 °C 0.810 kg/L (minimum)
0.870 kg/L (maximum)
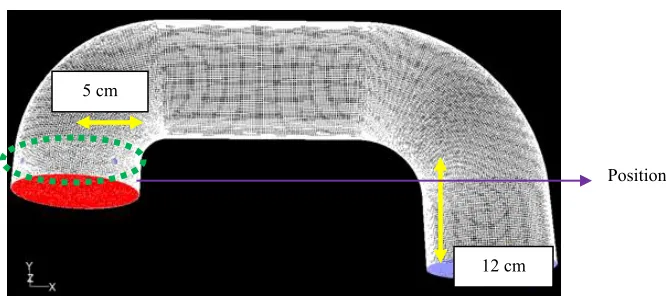
2.2 CNG Injector Position on Intake Manifold
Figure 2.1 (a) Position of CNG injector on intake manifold (position 1)
Figure 2.1 (b) Position of CNG injector on intake manifold (position 2)
Figure 2.1 (c) Position of CNG injector on intake manifold (position 3)
Figure 2.1 (d) Position of CNG injector on intake manifold (position 4)
Position 1 34 cm
2.7 cm
Position 2 29 cm
12 cm
5 cm
12 cm
Position 4 20 cm
21 cm
2.3 Laboratory Works
HINO diesel engine was used and the detailed specifications of the engine are listed in Table 2.3. The engine was tested under different position namely as "position 1", "position 2", "position 3" and "position 4". During tests, the inlet water pressure of dynamometer was kept constant at 3 bars meanwhile outlet temperature of cooling water was kept constant at 75°C. Under full load condition, same engine speed which is 2750 rpm was used for power output and exhaust gas emissions. The data for power output and engine speed were recorded from DYNOmite DYNAMOMETER (by LANDSea) and exhaust gas emissions data such as HC and NOx in ppm, percentages of CO and CO2
were recorded from EMS Exhaust Gas Analyzer (model 5002).
Table 2.3 Engine specifications
Model HO7C
Displacement (cc) 6728
Bore x Stroke 110 mm x 118 mm Cylinder Number 6
Firing Order 1-4-2-6-3-5 Horse Power (HP) 180 HP @ 3000 rpm Cooling Type Water Cooling Fuel Supply System Direct Injection (DI)
2.4 Simulation Works
Four position of CNG injector on intake manifold were considered and each position consist of four CNG injectors.All of them were designed using GAMBIT Version 2.2.30 software. Computational Fluid Dynamics (CFD) analysis software (FLUENT Version 6.2.16) was used to investigate the possible mechanisms for an optimum position of CNG injectors that resulted in better engine performance focused in flow behavior of methane and air in intake manifold. Methane was selected because it is major composition in CNG. In the present study, coarse meshes were used for air inlet and mixture outlet sections and finer meshes were used for CNG fuel inlet section. Different type of meshes were selected based on general guideline of model meshing which is always mesh the more critical domains such as high velocity and high pressure or pressure drop fields with finer mesh compared to the less critical ones. This is the reason why finer meshes were selected for CNG fuel inlet section. Total numbers of cells generated for all four position were ranging from 624762 to 959687. Parameters involved in simulation works are listed in Table 2.4.
Table 2.4 Defined parameters in CFD simulator
Parameter Definition
Solver
Segregated
2D Space
Absolute velocity formulation
Cell-based gradient option
Superficial velocity porous formulation
Energy Energy equation was applied
Viscous model
k-epsilon (2 equation)
Standard k-epsilon model
near wall treatment was defined as standard wall function
Species Model
Species transport model
Mixture material was defined as methane and air
Operating Condition
Initial operating pressure of the air was defined as ambient pressure (101325 Pascal)
Final operating pressure of CNG and air mixture was assumed to be the same with initial operating pressure of CNG
Boundary Condition
Air inlet defined as velocity inlet which equal to 6.3714 m/s.
Air density was 1.165 kg/m3
CNG inlet defined as velocity inlet which equal to 46.436 m/s.
CNG density was 0.711 kg/m3
Control Solution
Momentum, turbulence kinetic energy and turbulence dissipation rate were controlled using Power Law.
3.0 RESULTS AND DISCUSSION
3.1 Power Characteristics of the Engine under Full Load Condition at 2750 rpm
Figure 3.1 shows that higher power output produced by diesel engine under DDF mode operation with CNG injector at position 2 compared to the CNG injector at position 1, position 3 and position 4. Power output obtained by CNG injector at position 2 was slightly below 168 HP at 2750 rpm. This might be due to the all injected gaseous fuel in intake manifold reached into engine cylinder within the available time during suction stroke of the engine. So, chances of backfiring in the intake manifold due to the fuel accumulation can be minimized and resulting higher power output. Besides that, this optimum position also allowed the formation of homogeneous mixture between CNG and air to be form prior to entry to the engine cylinder and thus lead to the better engine performance. Other researcher also found that there exist critical distance of gas injector on intake manifold which increased the degree of homogeneous gaseous mixture [15]. They also calculated time required for the whole mixture to be inducted inside the engine cylinder and conclude that gas injector position plays vital role in determining either time taken for the mixture to reach the engine cylinder exceeding available time during suction stroke or not.
3.2 Exhaust Gas Emissions of the Engine under Full Load Condition at 2750 rpm
3.2.1 Nitric Oxides (NOx) Emissions
NOx emissions in ppm unit released by the engine is depicted in
Figure 3.2. Overall, there is no specific trend for the NOx
emissions produced by CNG injector at four different position on intake manifold. Almost 5% to 8% NOx emissions were reduced
by CNG injector at position 2 compared to other position. The reason for this difference is mainly due to the low concentration of oxygen within engine cylinder of the engine. An equal amount of air was replaced by CNG. As the oxygen concentrations reduced, slower rate of combustion produced and peak cycle temperature become lower. As a results, NOx emissions were
reduced. This can be clearly seen in CNG-air concentrations as mentioned in the next section (CNG-air Concentrations) where CNG injector at position 2 results in highest concentration of CNG at the exit of intake manifold compared to CNG injector at position 1, position 3 and position 4.
Figure 3.2 Nitric Oxides (NOx) emissions of the engine for different
injector position
3.2.2 Hydrocarbon (HC) Emissions
Figure 3.3 illustrates the variation of the experimental values of HC emissions with CNG injector position. As known, HC emissions are greatly influenced by the quality of combustion process inside the engine cylinder [18-19]. Moreover, under DDF mode operation, combustion process strongly depends on the total relative air-fuel ratio since this factor plays a significant role on the flame propagation mechanism [20]. CNG injector at position 2 released less HC emissions compared to other position. This is mainly due to the lower amount of CNG escaping the combustion process and stoichiometric values of total relative air-fuel ratio which favouring the flame propagation mechanism. Improvement in both factors results in better quality of gaseous fuel combustion process.
Figure 3.3 Hydrocarbon (HC) emissions of the engine for different injector position
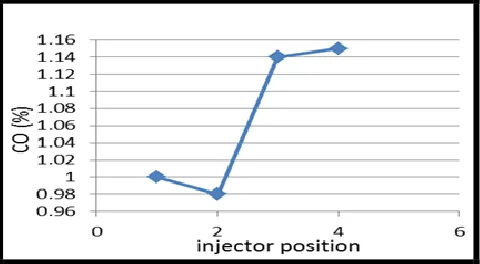
3.2.3 Carbon Monoxide (CO) Emissions
Figure 3.4 shows the variation of CO emissions with CNG injector position on intake manifold. CO emissions were significantly lower for CNG injector at position 2 compared to others at the tested speed and load condition. The rate of CO formation is a function of the air-fuel ratio, unburned gaseous fuel availability and mixture temperature, which control the rate of fuel oxidation and decomposition [18-20]. CNG injector at position 2 shows lower CO emissions which is below 1% and this may be attributed mainly to the improvement of the gaseous fuel combustion quality, particularly during premixed controlled combustion phase, contributes to lower unburned gaseous fuel availability and higher CNG-air mixture temperature, thus contributing to lower formed CO emissions.
Figure 3.4 Carbon Monoxide (CO)emissions of the engine for different injector position
3.2.4 Carbon Dioxide (CO2) Emissions
Figure 3.5 indicates that DDF system using CNG injector at position 2 results in better CO2 emissions compared to other
position. CNG injector at position 4 exhibit the highest CO2
Figure 3.5 Carbon Dioxide (CO2) emissions of the engine for different
injector position
3.3 Flow Behavior of Methane and Air in Intake Manifold
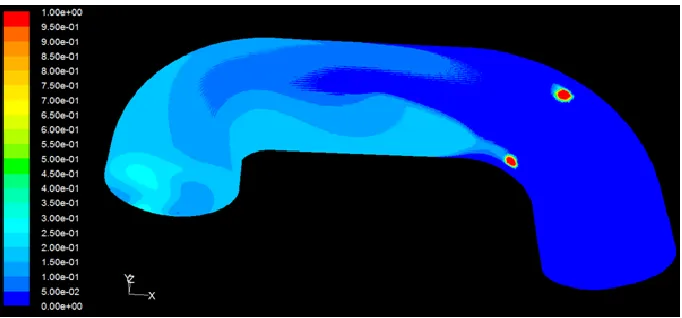
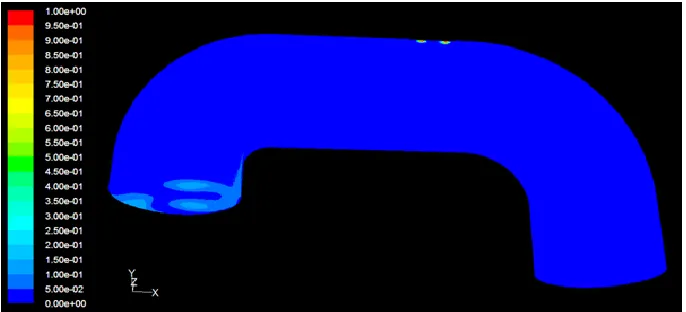
3.3.1 CNG-air Concentrations
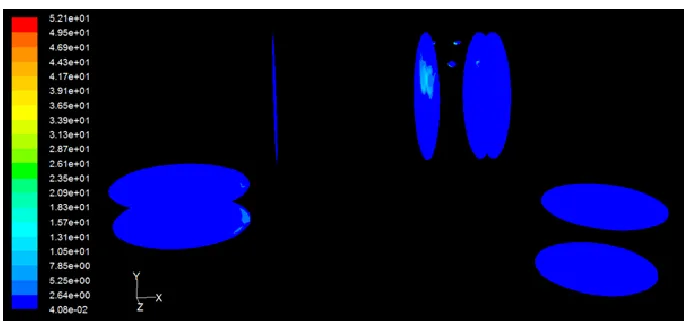
Visual illustrations of CNG-air concentration for four different CNG injector location are depicted in Figure 3.6: (a), (b), (c) and (d). Better quality of homogeneous mixture was obtained using CNG injector at position 2 and it is represented by Figure 3.6: (b). This is due to the high turbulence kinetic energy effects as described in turbulence kinetic energy section which occurs at mixing region (position 2). Figure 3.6: (a) shows intermediate homogeneous mixing quality of CNG and air at the exit of intake manifold produced by CNG injector at position 1. Meanwhile mixing quality for the CNG injector at position 3 and position 4 can be classified as poor homogeneous mixing quality and they are depicted in Figure 3.6: (c) and (d) respectively. The effects of the degree of homogenous mixture produced using four different CNG injector position were fully elaborated under power characteristics of the engine and exhaust gas emissions section.
Figure 3.6 (a) CNG-air concentrations at position 1
Figure 3.6 (c) CNG-air concentrations at position 3
Figure 3.6 (d) CNG-air concentrations at position 4
3.3.2 Turbulence Kinetic Energy
Visual illustrations of turbulence kinetic energy for four different CNG injector location are shown in Figure 3.7: (a), (b), (c) and (d). CNG injector at position 2 as depicted in Figure 3.7: (b) results in highest turbulence kinetic energy at mixing region and the value was 100.1 m2/s2. This higher turbulence kinetic
energy increased the degree of homogeneous mixture as previously mentioned in CNG-air concentrations section.This is due to the high momentum produced at 90º bend of intake manifold. Restriction or 90º bend at intake manifold cause sudden increase in air flow velocity from the inlet section. As a results, higher velocity of the mixture produced at position 2 when CNG and air flows collide with each other. The flow with higher velocity will force the one with lower velocity to flow
back thus these two flows will accumulate and produce better mixing quality of the mixture.
Previous researcher also obtained better mixing quality of the gaseous mixture due to the high turbulence effects such as velocity and turbulence intensity [15]. Increase in velocity of the mixture enhances the turbulence intensity and leads to better mixing characteristics of the gaseous mixture. Turbulence kinetic energy at mixing region for position 1, position 3 and position 4 are depicted in Figure 3.7: (a), (c) and (d) respectively. Overall, low turbulence kinetic energy produced by these three CNG injector position which represented by below 11 m2/s2. This might be due to the unsuitable CNG
Figure 3.7 (a) Contours of turbulence kinetic energy at position 1
Figure 3.7 (b) Contours of turbulence kinetic energy at position 2
Figure 3.7 (d) Contours of turbulence kinetic energy at position 4
4.0 CONCLUSION
At constant engine speed and full load condition, an optimum position of CNG injector mounted on intake manifold was found to be at position 2 which results in highest power output and less exhaust gas emissions. From simulation point of view, high turbulence kinetic energy and homogeneous mixture of CNG and air was produced by CNG injector at position 2 and thus improve the performance of the diesel engine under DDF mode operation.Based on the findings, the research entitled effects of Compressed Natural Gas (CNG) injector position on intake manifold towards diesel-CNG dual fuel (DDF) engine performance provide promising modification method due to the simple, cheaper and commercially acceptable and can be very valuable if opted to apply this technology on existing diesel engine.
Acknowledgement
Authors would like to extend gratitude to the Ministry of Science Technology and Innovation (MOSTI) for the financial support. The Department of Renewable Energy Engineering, Faculty of Petroleum & Renewable Energy Engineering and UTM are highly acknowledged for providing continuous technical and facilities support.
References
[1] Carlucci, A. P., A. de Risi, D. Laforgia, and F. Naccarato. 2008. Experimental Investigation and Combustion Analysis of a Direct Injection Dual-fuel Diesel–natural Gas Engine. Energy. 33(2): 256– 263.
[2] Karim, G. A. 2003. Combustion in Gas Fueled Compression: Ignition Engines of the Dual Fuel Type. Journal of Engineering for Gas Turbines and Power. 125(3): 827–836.
[3] Lin, Z. and W. Su. 2003. A Study on the Determination of the Amount of Pilot Injection and Rich and Lean Boundaries of the Pre-mixed CNG/air Mixture for a CNG/diesel Dual-fuel Engine. SAE Technical Paper. 2003-01-0765.
[4] Barata, J.M.M. 1995. Performance and Emissions of a Dual Fueled DI Diesel Engine. SAE Technical Paper. 952364.
[5] Karim, G. A. and M. O. Khan. 1968. Examination of Effective Rates of Combustion Heat Release in a Dual-Fuel Engine. Journal of Mechanical Engineering Science. 10(1): 13–23.
[6] Agarwal, A. and D. N. Assanis. 1998. Multi-Dimensional Modeling of Natural Gas Ignition Under Compression Ignition Conditions Using Detailed Chemistry. SAE Technical Paper. 980136.
[7] Badr, O., G. A. Karim, and B. Liu. 1999. An Examination of the Flame Spread Limits in a Dual Fuel Engine. Applied Thermal Engineering. 19(10): 1071–1080.
[8] Pirouzpanah, V. and B. O. Kashani. 1999. Prediction of Major Pollutants Emission in Direct-Injection Dual-Fuel Diesel and Natural-Gas Engines. SAE Technical Paper. 1999-01-0841.
[9] Korakianitis, T., A. M. Namasivayam, and R. J. Crookes. 2011. Natural-gas Fueled Spark-ignition (SI) and Compression-ignition (CI) engine Performance and Emissions. Progress in Energy and Combustion Science. 37(1): 89–112.
[10] Sahoo, B. B., N. Sahoo, and U. K. Saha. 2009. Effect of Engine Parameters and Type of Gaseous Fuel on the Performance of Dual-fuel Gas Diesel Engines—A Critical Review. Renewable and Sustainable Energy Reviews. 13(6–7): 1151–1184.
[11] Hountalas, D. T. and R. G. Papagiannakis. 2000. Development of a Simulation Model for Direct Injection Dual Fuel Diesel-Natural Gas Engines. SAE Technical Paper. 2000-01-0286.
[12] Karim, G. A. 1980. A Review of Combustion Processes in the Dual Fuel Engine—The Gas Diesel Engine. Progress in Energy and Combustion Science. 6(3): 277–285.
[13] Karim, G. A. and Z. Liu. 1992. A Predictive Model for Knock in Dual Fuel Engines. SAE Technical Paper. 921550.
[14] Hountalas, D. T. and R. G. Papagiannakis. 2001. A Simulation Model for the Combustion Process of Natural Gas Engines with Pilot Diesel Fuel as an Ignition Source. SAE Technical Paper. 2001-01-1245. [15] Chintala, V. and K. A. Subramanian. 2013. A CFD (computational
fluid dynamics) Study for Optimization of Gas Injector Orientation for Performance Improvement of A Dual-fuel Diesel Engine. Energy. 57(0): 709–721.
[16] Berhad, G. M. Chemical Safety Data Sheet (Natural Gas). 2011 October [cited 2013 September, 25]; Revision 4:[Available from: http://www.gasmalaysia.com/about_gas/chemical_safety_data_sheet.p hp
[17] Petronas. Diesel (Euro 2M). 2011 March [cited 2013 September, 25];
Available from:
http://www.mymesra.com.my/images/microsite/commercial/pdf/diesel _euro_2M.pdf.
[18] Heywood, J. B. 1988. Internal Combustion Engine Fundamentals. McGraw-Hill.
[19] Ramos, J. I. 1989. Internal Combustion Engine Modeling. New York: Hemisphere Pub.
![Table 2.1 Physical and chemical properties of CNG [16]](https://thumb-us.123doks.com/thumbv2/123dok_us/1365637.1169338/2.612.341.535.452.541/table-physical-chemical-properties-cng.webp)