ABSTRACT
Lewis, David Dylan. DropHead Formwork System Implications in Flat Plate Concrete Floor Construction. (Under the direction of Dr. David W. Johnston.)
DROPHEAD FORMWORK SYSTEM IMPLICATIONS IN FLAT PLATE
CONCRETE FLOOR CONSTRUCTION
by
DAVID D. LEWIS
A Thesis submitted to the Graduate Faculty of North Carolina State University in partial fulfillment of
the requirements of the degree of Master of Science
CIVIL ENGINEERING
Raleigh, North Carolina
July 2005
APPROVED BY:
_________________________ _________________________ Dr. Mervyn J. Kowalsky Dr. Michael L. Leming
BIOGRAPHY
David D. Lewis was born in Baton Rouge, Louisiana on December 26, 1978. He grew up in the Denham Springs suburb of Baton Rouge and graduated from Denham Springs High School in May of 1996. He enrolled in Louisiana State University in the fall of 1996 where he received his Bachelor of Science in Civil Engineering in December of 2002 from the Department of Civil and Environmental Engineering at Louisiana State University. He also received a minor in both structural engineering and construction management from Louisiana State University.
While attending Louisiana State University, he participated in a co-operative education experience that allowed him to work with an engineering firm for a semester. He also participated in an independent study program for senior class credit, which included conducting research on piping materials for the Louisiana Department of Transportation and Development. For summer work, he helped to conduct a survey on building codes that have been adopted across the state of Louisiana.
ACKNOWLEDGEMENTS
First and foremost, I would like to express thanks and gratitude for the direction and guidance by my Lord and Savior, Jesus Christ. I attribute all successes to Him, whether in my past, present, or future. I know that this stage in my life is one that the Lord had ordained for me and His grace upon my life is the only reason that I was able to accomplish something that would have been impossible without Him. Philippians 4:13
I would also like to express my love and appreciation to my wife, Jennie Marie Lewis, who has had to endure with me the process of completing this task. I know that times have been tough, both financially and emotionally and your continued support, whether verbal or non-verbal, has meant the world to me. Thank you, my darling.
I would like to express my deepest appreciation and gratitude to my advisor, Dr. David W. Johnston. His direction, guidance, and most of all, his patience with me in the development of this thesis is deserving of my utmost respect. Thank you.
Further gratitude is extended to the other members of the thesis committee, Dr. Leming and Dr. Kowalsky for their review of the literature and their constructive suggestions.
I offer a special note of thanks to Dr. William Rasdorf for his invaluable advice and encouragement along the way. Thank you for caring enough to reach out.
TABLE OF CONTENTS
Page
List of Figures ... vii
List of Tables ... viii
1. Introduction...1
1.1.Background...1
1.2.Problem Statement...3
1.3.Research Objectives...3
1.4.Research Significance...4
2. Review of Literature ...5
2.1.Introduction...5
2.2.Construction Loads ...5
2.3.Shoring Analysis Methods...8
2.4.Load Factors ...10
2.5.Strength Evaluation ...11
2.5.1. Tensile Strength ...12
2.5.2. Bonding...12
3. Shoring Analysis...14
3.1.Introduction...14
3.1.1. Description of Traditional Method ...14
3.1.2. Description of the New Method...16
3.2.Construction Load Analysis ...18
3.2.2. Traditional Analysis...19
3.2.3. Analysis with New Method ...21
3.2.4. Partial Activation ...24
4. Strength Analysis and Results ...29
4.1.Strength Criteria...29
4.2.Slab Analysis Approaches ...31
4.3.Punching Shear ...34
4.3.1. Reinforced Slab Punching Shear ...36
4.3.2. Plain Concrete Slab Punching Shear...39
4.4.Flexure Capacity...41
4.4.1. Reinforced Flexural Capacity ...41
4.4.2. Plain Concrete Flexural Capacity ...45
4.4.3. Cracking Moment in Reinforced Section ...48
4.5.Beam Shear ...49
5. Example Use of Analysis Results ...51
5.1.Introduction...51
5.2.Construction Dead Load ...51
5.3.Construction Live Load ...51
5.4.Construction Material Load ...52
5.5.Factored Load Combination ...54
5.6.Comparison to Strength Available...55
6. Conclusions and Recommendations ...57
6.2.Recommendations for Future Research...58
7. References...60
8. Appendix...61
8.1.Shoring Analysis...61
8.2.Structural Integrity Analysis...82
8.3.Verification of Calculations...99
8.3.1. Punching Shear : Reinforced ...100
8.3.2. Punching Shear : Plain Concrete...100
8.3.3. Flexure : Reinforced : One Way : Parallel to Beam ...100
8.3.4. Flexure : Reinforced : One Way : Perpendicular to Beam ...101
8.3.5. Flexure : Reinforced : Two Way : Parallel to Beam...102
8.3.6. Flexure : Reinforced : Two Way : Perpendicular to Beam...103
8.3.7. Flexure : Plain Concrete : One Way : Parallel to Beam ...103
8.3.8. Flexure : Plain Concrete : One Way : Perpendicular to Beam ...104
8.3.9. Flexure : Plain Concrete : Two Way : Parallel to Beam...104
8.3.10.Flexure : Plain Concrete : Two Way : Perpendicular to Beam...105
LIST OF TABLES
Table Page
2.1 Minimum loading guidelines for scaffolds ...6
2.2 Classes of working surfaces for combined uniformly distributed live loads...8
2.3 Construction load factors ...10
2.4 ACI 318-05 references...11
3.1 Activation percentage analysis cases ...25
3.2 Load carried by lower floors when floor 10 is placed ...28
4.1 Factored moments in column strips ...43
5.1 Fully loaded transport angle weight...52
LIST OF FIGURES
Figure Page
1.1 Drophead (courtesy of Meva) ...2
3.1 Drophead shore with removable beams and panels (courtesy of Meva) ...16
3.2 Drophead-beam-panel method...17
3.3 Activation of floor slab (courtesy of Meva) ...22
3.4 Loads carried by floor “i” when floor “i + 3” is placed...26
3.5 Loads carried by floor “i” when floor “i + 2” is placed...27
3.6 Loads carried by floor “i” when floor “i + 1” is placed...27
4.1 Alternatives for development of structural strength based on ACI 318 and an example assumed concrete compressive strength gain ...31
4.2 Typical floor plan and shore layout ...33
4.3 Slab supported by column or shore...35
4.4 Example variations in shore punching shear resistance conditions ...36
4.5 Punching shear diagram...37
4.6 Plan view of shoring system ...38
4.7 Reinforced slab shore punching shear design strength load capacity (100x100 mm shore, 2.70 m primary beam, 1.6 m panel)...39
4.8 Plain slab shore punching shear design strength load capacity (100x100 mm shore, 2.70 m primary beam, 1.6 m panel)...40
4.9 Moment resistance with and without negative moment capacity ...42
4.10 Reinforced slab shore one way flexural factored load capacity (100x100 mm shore, 2.70 m primary beam, 1.6 m panel)...43
4.12 Plan view of shore strip...45 4.13 Plain slab shore one way cracking strength factored load capacity
(100x100 mm shore, 2.70 m primary beam, 1.6 m panel)...47 4.14 Plain slab shore two way cracking strength factored load capacity
(100x100 mm shore, 2.70 m primary beam, 1.6 m panel)...47 4.15 Plain slab shore one way crack development load capacity
(100x100 mm shore, 2.70 m primary beam, 1.6 m panel)...48 4.16 Plain slab shore two way crack development load capacity
(100x100 mm shore, 2.70 m primary beam, 1.6 m panel)...49 4.17 Shear force diagram ...50 4.18 Reinforced slab shore beam shear load capacity
1. INTRODUCTION
1.1 Background
When erecting any concrete structure, there must be formwork in order to shape and mold the concrete into its final form. In multi-story building construction, formwork underneath the floor being cast serves as the mold and vertical elements called shores support the forms from the previously constructed floors below.
Since the loads of the fresh concrete, formwork, placing personnel, and placing equipment for a floor are typically greater than the load capacity of the floor below, a system of shores and reshores is used to distribute the loads over several lower floors. In the traditional forming/shoring method, the formwork is removed when the concrete slab that is being supported has gained enough strength to carry its own weight, and reshores are inserted between floors to distribute added construction loads to several floors below.
Throughout the history of concrete construction, there have been occasional building failures during construction caused by inadequate formwork or insufficient shoring and reshoring. The cause has often been the premature removal of the concrete floor temporary support or inadequate analysis of the early age strength of the concrete floor system. Concrete has lower strength at early ages. This must be taken into consideration when designing the formwork system and requires the contractor to be knowledgeable about the strengths of the concrete at early ages. The principal properties of concern are the flexural and shear strength of the concrete floor system.
two most critical factors that affect the early strength of a concrete slab are the age of the concrete and the curing temperature of the concrete. These two factors determine the rate of strength gain and the maturity of the concrete at a given time. The higher the temperature of the concrete, the faster a concrete section will gain maturity and therefore gain strength. Maturity increases with age, but at a higher rate with higher concrete temperatures and a lower rate with lower concrete temperatures.
New methods have been developed for the shoring and reshoring process, which improve the economy of the construction process by allowing removal and reuse of some forming elements at an earlier concrete age. An example is a forming system that allows the forming panels and panel support beams to be removed by lowering the head of the shore, while leaving the loaded shore in place as shown in Figure 1.1.
As in any industry, new and improved construction methods must be introduced in order to have a safer and more economical construction process. An example of this is the Drophead Shore Formwork System. This report introduces this new method and studies the effects it has upon the structural integrity of a slab during construction.
1.2 Problem Statement
Knowledge among structural designers of the shoring and reshoring process for construction of multi-story buildings is often limited to traditional methods, which involve complete removal of the shores and forming systems at certain stages of the process. New, more efficient and safe systems and methods have been introduced which allow removal of the forming elements while the shores remain in place. An example is the MevaDec Drophead Formwork System for slabs. Structural engineers and construction engineers need information and analytical procedures, which will help them to understand how such systems perform in relation to building code standards for design of concrete structures and construction safety standards and regulations for construction of buildings.
1.3 Research Objectives
The objectives of this research are the following:
1. Examine the construction loads on the slabs that span between shores and how those loads are applied during the construction process.
3. Compare traditional methods of shoring and reshoring for multistory concrete construction with the Drophead Shore method.
4. Investigate the early age strength of concrete slabs for resisting loads upon stripping of the formwork panels while shores remain in place.
5. Investigate the effects of having various percentages of slab activation due to partial rather than full release of the shores.
1.4 Research Significance
2. REVIEW OF LITERATURE
2.1 Introduction
In this chapter, a summary of literature reviewed concerning multistory concrete slab shoring and reshoring is presented. Information from industry standards regarding the recommended and required loadings is presented. Analytical methods for determining how these loads are distributed through, and resisted by, a multistory concrete structure will be discussed. Finally, literature discussing the rate at which a concrete slab matures or gains compressive strength and how this strength gain is related to punching shear, tensile strength, and bond strength will be introduced.
2.2 Construction Loads
Before undertaking an analysis, the loads on a particular structure during construction must be determined. The loads applied to a structure during construction are different from the loads encountered during the service of the building. There are several resources for reference in determining appropriate loads on buildings during construction.
has gained sufficient strength to support its own weight plus any loads that may be imposed upon the slab. Section 1926.703 (e) states that all forms and shores are not to be removed until the employer determines that the concrete has gained sufficient strength to support its weight and any superimposed loads. OSHA11 does not necessarily list requirements for live load allowances, but it does expect the designer to take all precautions necessary to prepare for any possible live loads that might occur. Several non-mandatory references are listed in Appendix A to Subpart Q. Among those are ACI 3476, ACI SP-47, and ANSI A10.912.
OSHA11 lists guidelines in the non-mandatory appendices concerning scaffold specifications and intended loads for various applications. Although scaffolds are not the same as formwork or shores/reshores, they are similar systems. The scaffold guidelines (Table 2.1) provide possible live load levels that could be imposed on the structure.
Table 2.1 Minimum loading guidelines for scaffolds
Rated Load Capacity Intended Load Application
Light-Duty 25 psf Uniformly over the entire span Medium-Duty 50 psf Uniformly over the entire span Heavy-Duty 75 psf Uniformly over the entire span One-person 250 lbs Concentrated at the center of the span Two-person 250 lbs Concentrated 18 inches to the left or right
of the center of the span
Three-person 250 lbs Combination of one-person and two-person application
allowance for normal reinforcement. Fortunately, these dead loads can be estimated fairly well and used directly for analysis purposes.
ACI 347-046 recommends that slab formwork be designed for a minimum live load of 50 psf occurring during placing of the concrete. This would provide for the weight of the workers, and any small equipment used. If motorized carts are used, the minimum live load should be 75 psf. Including a minimum dead load of 50 psf, the minimum combined dead and live load should be no less than 100 psf, and when motorized carts are used, it should be no less than 125 psf. ACI SP-47 contains guidelines for determining the distribution of those loads in the multistory structure under construction. An application of that analysis procedure is presented in Chapter 3 of this report.
ASCE 379 provides requirements for loads on structures during construction and lists the minimum concentrated personnel and equipment loads for design. A minimum concentrated load of 250 lbs (1.1 kN) should be used in strength calculations of individual structural members. If the actual loads exceed this minimum requirement, the actual loads should be used. For working surfaces or areas, it is traditional to use a uniformly distributed load for design purposes. ASCE 379 uses 4 basic classes: very light duty, light duty, medium duty, and heavy duty. Table 2.2 shows the minimum requirements for combined loads on working surfaces. It is important to note that these loads are the combination of personnel, equipment, and material in transit or staging.
construction and more specifically includes the transportation of concrete using buckets, chutes, or handcarts. It also includes any masonry or structural steel construction along with rebar placement. Although OSHA11 does not give specific definitions of the duty classifications in Table 2.1, OSHA11 and SEI/ASCE 379 are consistent in the requirements and they are also in general agreement with ACI 347-046.
Table 2.2 Classes of working surfaces for combined uniformly distributed live loads (ASCE 37-02)
Uniform Load Operational Class
psf kN/mm2
Very Light Duty 20 0.96
Light Duty 25 1.20
Medium Duty 50 2.40
Heavy Duty 75 3.59
ANSI12 specifies a minimum formwork dead load of 10 psf. ANSI12 also incorporates many other of the recommendations of ACI 3476 as requirements. If motorized carts are used, the live load allowance shall increase by an additional 25 psf, for a total vertical load of 125 psf. The total vertical load shall not be less than 100 psf.
2.3 Shoring Analysis Methods
vertical force from the shores can be considered a distributed load instead of a concentrated load. Finally, a typical construction cycle usually rises at a rate of one floor per week.
In their example analysis of the construction loads applied to slabs, 3 sets of shores were used. The analysis showed that peak or maximum applied slab loads occurred at a time in which all available shoring sets were being used to support the floors below. Continued analysis was conducted using varying amounts of shoring sets. It was concluded that although increasing the number of shored levels does bring about an increase in the maximum applied slab loads, it also delays the occurrence of the maximum slab loads allowing more time to develop greater strength. This seems to be in agreement with ACI 3476.
ACI 3476 also states that increasing the number of reshored floors decreases the maximum load applied to the slab. This is because the reshores allow for a greater distribution of the loads throughout the floors.
ACI SP-47 lists recommended assumptions for analysis of the shoring and reshoring process.
1. The shores and reshores are infinitely stiff relative to the slabs.
2. Any slabs that are interconnected by shores all deflect equally when a new load is added, and carry a share of the added load in proportion to their relative stiffnesses. 3. All of the slabs have equal stiffness, therefore, added loads are shared equally by the
interconnected slabs
These assumptions are not perfectly true. However, actual field measurements have indicated that any error introduced from these assumptions is generally small and normally neglected.
2.4 Load Factors
After over 10 years of development, SEI/ASCE 379 was released in 2002 as a standard for determining construction loads and load factors. It provides a detailed description of possible load factors. Table 2.3 lists the load factors that are applicable to the research presented in the following chapters.
Table 2.3 Construction load factors
Load Description Load Factor (max)
D Permanent Structure Dead Load
0.9 (when counteracting with wind or seismic loads) 1.4 (when combined with only construction or material load)
1.2 (for all other combinations) CD
Temporary Structure Dead Load
0.9 (when counteracting with wind or seismic loads) 1.4 (when combined with only construction or material load)
1.2 (for all other combinations) CFML
Fixed Material
Dead Load 1.2
CVML Variable Material
Dead Load 1.4
CP Personnel and
Equipment Load 1.6
For the shoring and reshoring process, the applicable loading combination is most typically:
UC = 1.2D + 1.2CD + 1.2CFML + 1.4CVML + 1.6CP (2.1)
This is consistent with the provisions of ACI 318-05 for the permanent structure of U = 1.2D + 1.6L, a reduction from the previous requirement of U = 1.4D + 1.7L, where L is the permanent structure live load. The reduction in the factor of safety for the permanent structure has implications for construction process safety that benefited in the past from the extra structural capacity, which has sometimes covered an insufficient engineering of the shoring and reshoring operations. The loss of this extra capacity increases the importance of engineering the construction process.
2.5 Strength Evaluation
ACI 318-058 is a building code requirement for structural concrete members. This report will use the equations and limitations from ACI 318-058 for any area of structural analysis that is investigated. The particular areas of concern are punching shear, flexure, and beam shear. Table 2.4 lists the chapters and sections from which pertinent information will be taken.
Table 2.4 ACI 318-05 references
Description Chapter Section
Punching Shear (reinforced) 11 12 Punching Shear (plain concrete) 22 5
Flexure (reinforced) 9 1
Flexure (plain concrete) 22 5
2.5.1 Tensile Strength
An estimate of the tensile strength at early ages is required for the analysis of cracking strength. Neville3 indicates the tensile strength is often expressed by researchers as a function of the compressive strength.
ft = k(f’c)n (2.2)
Various researchers and practitioners have used a range of values for both coefficients k and n. The exponent coefficient n often ranges from ½ to ¾ and the coefficient k often ranges from 5 to 12 with an average value of 8.3. There are many factors controlling this relationship, which is unique for each set of raw materials. Neville13 earlier suggested
ft = 9.5(f’c)0.5 (2.3)
which has coefficients within the often used ranges.
2.5.2 Bond
Bond strength can also be an important factor due to the possibility of experiencing a loss of bond strength due to early loading of a slab. Although ACI 318-058 gives various requirements for bonding, it does not specifically mention limitations for bond strength during the curing stages of concrete.
3. SHORING ANALYSIS
3.1 Introduction
For multi-story concrete construction, freshly cast-in-place floors must be temporarily supported. This temporary system includes the formwork, shoring, and reshoring. Shores are the temporary vertical elements used to transfer the weight of a freshly cast floor to the previously cast floors below. The formwork system is usually made of wood, steel, and aluminum framing elements including panels, joists, beams, shores, and lateral bracing.
During construction of concrete buildings, it is necessary to share the construction loads of workers, materials, forms, and freshly placed and early age concrete over several previously cast floors. The loads at the upper level during construction are typically greater than the single floor design strength of the completed structure and the strength is less due to the early age of the concrete. Distributing the loads over several lower floors can achieve a state that is safe for the workers and avoids damage to the structure. A typical traditional construction cycle would often include one set of shores and two sets of reshores. However, this depends upon the rate of strength gain of the concrete used, the loadings for which the structure was designed, and the length of time available for the project.
3.1.1 Description of Traditional Method
There are four main steps in a typical construction cycle for a multistory concrete building.
2. The casting of the floor slab
3. The removal of the formwork and shoring system
4. The placement of the reshoring system (this step may include the removal of a set of reshores from a lower level).
3.1.2 Description of the New Method
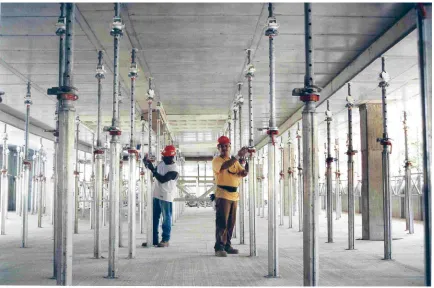
A new shoring system used is one that involves steel shores with a retractable head known as a drophead, aluminum beams, and aluminum framed panels with an integrated plastic forming face. The top of the shore has a plate that is in direct contact with the placed concrete as shown in Figure 3.1. The shore head to which the beams are attached can be dropped allowing the beams and panels to be removed while the shore remains in place.
Figure 3.1 Drophead shore with removable beams and panels (courtesy of Meva)
support its own weight, except for the short span between the shores. This in turn affects the speed at which new floors can be constructed.
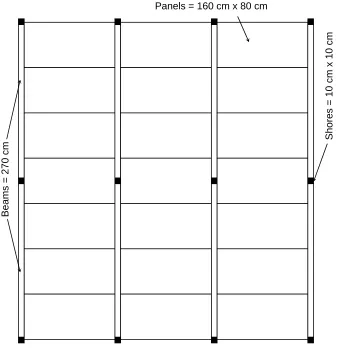
One of the forming arrangements that can be used is noted as the Drophead-beam-panel-method. In this method, the ready-made panels are inserted between the rows of primary beams, which are supported by the adjustable shores attached to the removable drophead. An example of the arrangement of the panels and beams in this approach is shown in Figure 3.2.
Figure 3.2 Drophead-beam-panel method
Panels = 160 cm x 80 cm
Beams =
27
0
cm
S
hore
s
= 1
0
cm x 1
0
With this method, the layout should begin in a corner and it is best, in general, to assemble the rows of beams in a perpendicular direction to the longest wall. The beams range in length from 80 cm (2.6 ft) to 270 cm (8.85 ft). The specific layout of the beams and panels can be determined on site, but are best determined through pre-planning. Also, the secondary beams can be used as supplemental supports to help customize the beam/panel layout around columns and similar irregular areas.
3.2 Construction Load Analysis
3.2.1 Assumptions
During the construction of a building, any load that is imposed upon the partially completed structure would be considered a construction load. As previously mentioned, these construction loads can exceed the service loads for which the individual floors were designed. In addition, during construction the age of the concrete floors below is such that they have often not attained their full 28-day strength. Therefore, an analysis must be made of the loads imposed upon the structure during the construction process. Some of the possible construction loads include vertical loads imposed by the structure self weight, temporary support systems (forms), personnel, equipment, and construction materials.
1. The shores and reshores are infinitely stiff relative to the slabs.
2. Any slabs that are interconnected by shores all deflect equally when a new load is added and carry a share of the added load in proportion to their relative stiffness. 3. All of the slabs have equal stiffness; therefore, the interconnected slabs share added
loads equally.
4. The ground level floor or any other base support is assumed to be rigid.
As with all assumptions made for an analysis, they are not exact. However, actual field measurements have indicated that any error introduced from these assumptions is generally small and normally neglected.
3.2.2 Traditional Analysis
Four loads are typically considered in the analysis of the shoring process. They include the slab weight, the form and shore weight, the construction live load, and the weight of the reshores, all expressed as uniform distributed loads. Each of these loads is expressed as a proportion of the dead weight of the concrete slab, D. For the example where the slab weighs 100 psf, forms and shores weigh 10 psf, reshores weigh 5 psf, and the construction live load is 50 psf, the loads expressed as a proportion of D are:
Slab Weight 1.000
Form/shore Weight 0.100
Construction Live Load 0.500
Reshore Weight 0.050
Slab # Load Carried by Slab Load Carried by Shore
Begin Change End
1 0.000 0.000 0.000
1.600
Initially, the shoring system must support all of the loads that are applied from the placement of the first slab. The loads that have been applied in the above figure include the weight of the slab, the form weight, and the construction live load. The construction live load is removed immediately following the placement of the slab and the load carried by the shore drops to 1.100D. Once the slab gains sufficient strength, the shores can be removed.
Slab # Load Carried by Slab Load Carried
by Shore
Begin Change End
1 0.000 1.000 1.000
0.000
As shown in the above figure, during the process of removing the shores, the slab is now activated and begins to support its own self-weight. The weight that was previously supported by the shores, minus their own self-weight, is now transferred to any connected slabs. In this case, there is only one slab to transfer the loads to. Obviously, since the shores have been removed, there is not any load being supported by the shores. In the figure below, it is shown that when the reshores are added, there is no additional weight transferred to the slab. The reshores are snuggly fit to the bottom of the slab as only to minimize deflection of the slab. Therefore, the only weight carried by the shore is its own self-weight.
Slab # Load Carried by Slab Load Carried
by Shore
Begin Change End
1 1.000 0.000 1.000
This analysis continues as higher floors are constructed. A repetitive pattern will be seen to develop as the analysis progresses to the higher floors. A complete traditional analysis for a structure can be found in Appendix 8.1.
A disadvantage of the traditional approach is that the forms and shores must be completely removed from a given floor before the reshores are placed. Minimizing sets of forms and achieving rapid reuse is important since the formwork costs often represent 40 to 60% of the structure cost. The construction schedule is often controlled by the time required for the slab to become self-supporting before the forms can be stripped.
3.2.3 Analysis with New Method
For the new method with drophead shores, the same assumptions are applied and the loads are transferred through the temporary structure with the same principles. The difference is that the Drophead-beam-panel method has slightly different steps and applied load stages. Stripping the beams and panels while the shores stay in place, the stresses in the slab are initially limited to those induced by the short span between the shores. While work proceeds on form erection and reinforcement placement for the floor above, the previously cast slab can gain additional strength before activation. At the appropriate time, the shore heads are dropped, transferring load to the slab while the shores remain in position providing a safety net for the activated floor as shown in Figure 3.3.
down of this formwork system varies. This does not necessarily change the analysis; it only changes the order in which certain loads are transferred throughout the formwork system and interconnected slabs.
Figure 3.3 – Activation of floor slab (courtesy of Meva)
Below is a compilation of the steps involved in this new method. 1. Setting up the formwork system
3. Removing the aluminum beams and panels
4. Setting up the formwork system on the next floor
5. Activating the first slab (lowering shores)
6. Snug up the shores to act as reshores
7. Casting the next floor slab
has been activated. An example analysis for this method for a structure can also be found in Appendix 8.1.
3.2.4 Partial Activation
Removing a set of shores completely all at the same time will result in the full load from above being carried in the slab being “activated;” however, this does not always occur. Sometimes the shores are released only a few at a time, or just one at a time. In this process, an individual shore may be released fully, and resnugged, but, when a second adjacent shore is released, load again accumulates in the first shore. Thus, all shores supporting a slab do not end up fully released unless the release cycle is repeated several times. As a result, the slab may not be fully activated. An example of a slab being partially activated at 80% of the initial shore load is shown below. In this particular example, the loads that are being applied are the placed reinforcement at 0.100D, forming panels and shore at 0.100D, the weight of the slab at 1.000D, and the shores below that are released to become reshores at 0.050D. Notice that the shores continue to carry some load after the slab is activated at 0.80(0.100D + 0.100D + 1.000D).
Slab # Load Carried by Slab Load Carried
by Shore
Begin Change End
2 0.000 0.000 0.000
0.200
1 0.000 0.960 0.960
0.290
seemed to apply the most load to the interconnected slabs, but the most critical was Case 2. Therefore, Figures 3.4, 3.5, and 3.6 are representations of Case 2. Each slab under consideration is referred to as slab “i”.
Table 3.1 Activation percentage analysis cases
Case Description Load at top slab
1 When shores, forms, and reinforcement are being erected and placed
CD = 0.100D (reinforcement)
CFML = 0.050D (forms)
CFML = 0.050D (shores)
CP = 0.200D (forming live load)
2 When the slab is being placed including construction live load of 0.500D
CD = 1.000D (slab)
CFML = 0.050D (forms)
CFML = 0.050D (shores)
CP = 0.500D (placing live load)
3 When a slab is being activated
CD = 0.100D (reinforcement)
CFML = 0.050D (forms)
CFML = 0.050D (shores)
4 When the lowest level of shores is
completely removed N/A - No load on top slab
Figure 3.4 Loads carried by floor “i” when floor “i + 3” is placed
Clearly, the more that a slab is activated, the less load that is applied to the lower most interconnected slab. For example, if the slab was initially activated 100%, then the load being carried by floor 7 is 1.467D. If the slab was initially activated 40%, then the load now carried by floor 7 is 1.990D.
Figure 3.5 shows the load in slab “i” when slab “i + 2” is being placed. For example, when slab 10 is placed, the load in slab 8 is 1.566D if the initial slab activation is 100% and 1.570D if the initial activation is 40%.
0.000 0.200 0.400 0.600 0.800 1.000 1.200 1.400 1.600 1.800 2.000 2.200 2.400
1 2 3 4 5 6 7 8 9 10
Floor "i"
Loa
d re
la
tiv
e
to D
e
a
d
We
ight of S
la
b
100% Act
80% Act
60% Act
40% Act
Figure 3.5 Loads carried by floor “i” when floor “i + 2” is placed
Figure 3.6 Loads carried by floor “i” when floor “i + 1” is placed
0.000 0.200 0.400 0.600 0.800 1.000 1.200 1.400 1.600 1.800 2.000 2.200 2.400
1 2 3 4 5 6 7 8 9 10
Floor "i"
Loa
d re
la
tiv
e
to D
e
a
d
We
ight of S
la
b
100% Act
80% Act
60% Act
40% Act
0.000 0.200 0.400 0.600 0.800 1.000 1.200 1.400 1.600 1.800 2.000 2.200 2.400
1 2 3 4 5 6 7 8 9 10
Floor "i"
Loa
d re
la
tiv
e
to D
e
a
d
We
ight of S
la
b
100% Act
80% Act
60% Act
No matter what percentage of activation initially occurs when the shores are released, the floor 2 loads below the floor being cast eventually carries a load that is approximately 1.6D.
Figure 3.6 shows the load in slab “i” when slab “i + 1” is being placed. The lower the percentage of activation that takes place, the less the load that will be carried by the uppermost previously cast slab. Using the same example of when slab 10 is placed, the load in slab 9 is 1.667D if the initial slab activation is 100% and 1.140D if the initial activation is 40%.
Table 3.2 confirms that although the way the loads are distributed varies, the total amount of load that is distributed throughout the concrete floors remains the same regardless of the initial activation percentage as would be expected.
Table 3.2 Load carried by lower floors when floor 10 is placed Activation
Floor
100% 40%
9 1.667 1.140
8 1.566 1.570
7 1.467 1.990
Total 4.700 4.700
4. STRENGTH ANALYSIS AND RESULTS
4.1Strength Criteria
Approaches for evaluating early strength have varied in practice. For several editions, ACI SP-47 has contained analysis examples based on assuming the structure floor strength at an early age compared to the 28-day strength is directly proportional to the proportion of concrete compressive strength developed. Unfortunately, the examples do not result in workable solutions and methods for accelerating strength gain are suggested. ACI 3188 assumes that the strength evaluation procedures therein are not a function of age and are applicable over a wide range of concrete strengths. CIRIA Report 1364 presents an excellent summary of many of the issues involved plus discussions of the methods available for improved evaluation of in-place strength, such as maturity, penetration, pullout, and break-off tests.
The actual rate of concrete compressive strength gain varies with the concrete temperature and characteristics of the mixture proportions and ingredients. Figure 4.1 presents an analysis of components of structure strength gain versus time based on an assumed concrete compressive strength gain relationship. The relationship assumed for the concrete compressive strength gain is based on the following equation form:
f’ct = [t / (a + bt)]f’c (4.1)
where f’c = compressive strength at 28 days, psi;
f’ct = compressive strength at t, psi;
t = concrete age, days;
For the case of f’ct / f’c = 1.0 at 28 days and f’ct / f’c = 0.7 at 7 days, the equation becomes:
f’ct = [t / (4 + 0.857t)]f’c (4.2)
This assumption is for example purposes only. Other concrete may gain strength at different rates or behave differently depending on concrete temperature, cement type, etc.
The strengths were estimated using the methods of ACI 3188. As noted previously by others and summarized in CIRIA Report 1364, the flexural strength gain is very rapid. For reinforcing amounts seen in flat plates, typically < 1%, the flexural strength gain even at very early ages (Figure 4.1) is higher than for bond, beam shear, and punching shear. Bond and shear behavior at early ages has been more controversial and still needs more attention for the benefit of construction. Some recommendations in the CIRIA Report4 suggest that the strength gain for bond and shear versus the 28-day strength should be conservatively assumed proportional to the concrete compressive strength gain or that standard shear strength prediction methods should not apply below a concrete strength of 10 MPa (1450 psi). Other investigations suggest the early strength is predictable (Neville3) and that early loading to normal limitations from the predictable strengths has no detrimental effect on performance of the permanent structure (Shah1, Clark and Johnston2). In ACI 3188, both bond and shear are expressed as a function of the square root of concrete compressive strength as illustrated in Figure 4.1. Some practitioners have suggested a compromise with other root relationships such as (fc-time / fc-28) 0.7 or applied a lower limit of 8 MPa (1150 psi),
for the minimum compressive strength, based on experience.
0.0 0.1 0.2 0.3 0.4 0.5 0.6 0.7 0.8 0.9 1.0
0 2 4 6 8 10 12 14 16 18 20 22 24 26 28
TIME (t), days
STRENGT
H
t
/ ST
R
E
N
G
T
H
28
Flexure, p = 0.5% Flexure, p = 1.0% Flexure, p = 1.5% Flexure, p = 2.0% Shear (beam, punching) [fct/fc28]^0.5
[fct/fc28]^0.7 Compressive strength
Figure 4.1 - Alternatives for development of structural strength based on ACI 318 and an example assumed concrete compressive strength gain
4.2 Slab Analysis Approaches
When the reinforcement for concrete floor slabs is designed, it is designed for the loads that will be imposed during the service life of the building. It is not designed specifically for loads encountered during construction. For flat plates, which do not have any beams between columns, the slab is designed by subdividing it into a series of column strips and middle strips (Figure 4.2) with widths which depend on the spacing of the columns or supports. ACI 318-058 defines a column strip as a design strip with a width on each side of a column centerline equal to 0.25 l1 or 0.25 l2 whichever is less. The terms l1 and l2 are defined
reinforcement required in each direction is a function of the moments at the critical sections. There is only positive moment across most of the span and negative moment near and over the columns. The middle strips have positive moment over much of their span, but negative moment in part of the support region provided by the column strips. Because of this, there will be differing amounts of reinforcement throughout the slab. Positive moment requires bottom-reinforcing steel in that direction and negative moment requires top-reinforcing steel in that direction. Thus, the reinforcement pattern can vary in the different locations. Figures 4.3b and 4.3c show an example of the possible variation in reinforcement.
The shores supporting the slab also make up their own temporary “bays” as shown in Figure 4.3a. However, the shores have a smaller spacing and the reinforcement pattern in the “bay” between shores is thus often highly variable in its suitability for the moments and shears generated by early construction loads when the form panels are stripped and the slab must span between the supporting shores. Due to the short spans involved, the column strips between shores can be referred to as “shore strips”. Figure 4.2 helps to illustrate the column or “shore” strip.
b) Column strip example reinforcement
c) Middle strip example reinforcement a) Slab plan and example shore layout
Middle Strip
Column Strip Column
Strip
l1
l2
0.5 l1 or 0.5 l2, whichever is less
Below is a list of the areas of analysis that were examined.
• Punching Shear at the Shore (without shear reinforcement) o Reinforced for Flexure
o Plain Concrete (temperature steel only on compression face)
• Flexural Strength in spans between shores o Reinforced on tension face
o Plain Concrete (temperature steel only on compression face) o Crack Development
• Beam Shear (without shear reinforcement)
The objective of the analysis is to determine the total uniform distributed load that can be carried by the early age slab in spanning between shores after stripping the beams and panels but before activation of the slab. A sample of results for the primary controlling cases in presented in this chapter. The complete set of results is provided in Appendix 8.2.
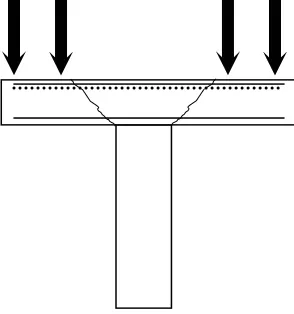
4.3 Punching Shear
There are many different levels of load sensitivity for each structural member. Concrete slabs are one of the most sensitive structural members during the construction process due to shear dependency. One of the more likely failure modes could be punching shear. Punching shear is load transferred through a slab to an interior column, or shore, and is sometimes referred to as two way shear. This can occur in a column bearing on a footing, or in our case, a flat slab supported by a column or shore. Figure 4.3 illustrates a slab supported by a column or a shore.
Vu < φVn (4.3)
where Vn is the nominal shear resistance of the slab and Vu is the factored shear force due to
the loads. The strength reduction factor for shear, φ, is equal to 0.85. Shear forces exerted on the slab can be resisted by the punching shear strength of the concrete,Vc, and any shear
Figure 4.3 Slab supported by column or shore
reinforcement,Vs, that is in the slab. For this analysis, it is assumed that there is no shear
reinforcement within the slab section; thus, Vs is zero and equation 4.3 reduces to:
Vu < φVc (4.4)
where Vc is the shear strength obtained from the concrete section alone. According to Shah2,
Figure 4.4 Example variations in shore punching shear resistance conditions
4.3.1 Reinforced Slab Punching Shear
The provisions in ACI 318-05 Chapter 11 for nominal two-way shear resistance of a slab for a square reaction area can be reduced to the following equation:
φVn = φ4(f'c0.5)[4(w + d)d] (4.5)
Figure 4.5 defines the dimensional variables in this equation.
The variables for punching shear strength are the size of the square shore head, “w”, the concrete strength, f’c, and the depth of the slab, d. A range of slab depths and concrete
strengths were used to evaluate the effects these variables have on the nominal punching shear load capacity. In all examples, the length of the “shore strip” was center-to-center spacing of the shores with the beams used to support the Meva shoring panels. The longest Meva beam with a length of 2.7 m (Beam 270) was used for the examples in this chapter. Results for other lengths are presented in Appendix 8.2. The size of the shore bearing plate is 10 cm x 10 cm (3.9 in. x 3.9 in.) and w = 10 cm (3.9 in.). Thus, the typical layout is as shown in Figure 4.6
. . . . . . . . . .
d h
100 mm sq. Shore head a) Situation in
negative moment regions of slab
b) Situation in positive moment regions of slab
. . . .
Figure 4.5 Punching shear diagram
For example, consider a slab thickness of 7.5 in. This slab is to contain at least a minimum amount of reinforcement on the top face with a clear cover of approximately 0.75 in. The depth, d, will be the slab thickness less the clear cover and the diameter of the reinforcement bar. The diameter of the bar could range from 0.375 in to about 1 in. Therefore, it will be assumed for analysis purposes to have a depth “d” of 6.00 in. Substituting these values into equation 4.5 and for a concrete compressive strength of 1500 psi, the punching shear capacity of the slab section is
φVn = 0.85[4(15000.5)[4(3.9 + 6)(6)]] = 31,404 lbs
Figure 4.6 illustrates the tributary area in which the factored load is assumed applied. The critical section for punching shear is at the perimeter located at d/2 from the face of the shore. Load within the perimeter can normally be neglected. However, a more conservative
w d
approach is assumed by taking the load on the entire tributary area as the load that must be supported.
Tributary Area = (1.7 m)(2.8 m) = 4.76 m2 = 51.24 ft2
Figure 4.6 Plan view of shoring system
Using this area, the ultimate punching shear capacity distributed load of 613 lbs/ft2 is determined by dividing the punching shear strength by the tributary area.
Figure 4.8 presents the ultimate load capacity of slabs based on punching shear for a range of concrete strengths developed and various slab depths, d. The punching shear capacity has been divided by the tributary area to determine the ultimate load capacity.
Panels
160 cm x 80 cm
Beam = 270 cm
1.7 m 2.8 m
Tributary Area 2.8 m
Figure 4.7 - Reinforced slab shore punching shear design strength load capacity (100x100 mm shore, 2.70 m primary beam, 1.6 m panel)
4.3.2 Plain Concrete Slab Punching Shear
There is also the possibility that the slab reinforcement is located only on the face of the slab in contact with the shore since the shore may be located in an area that is a positive moment region for the overall floor design. Therefore, it is necessary for such cases, to consider the punching shear strength of the plain concrete section. ACI 318-05 Chapter 22 provides methods for calculating the punching shear strength of plain concrete. For the case of the square shore of dimension w, and a slab thickness of h as shown in Figure 4.5b, the ultimate shear capacity is:
φVn = φ[4/3 + 8/(3β)](f'c0.5)[4(w + h)h] (4.6)
but not greater than φ2.66(f'c0.5)[4(w + h)h] (4.7)
0 100 200 300 400 500 600 700 800 900 1000 1100 1200 1300 1400 1500 1600 1700 1800 1900 2000
0 500 1000 1500 2000 2500 3000 3500 4000 4500
Concrete Compressive Strength Developed (psi)
Punching Shear
Fact
or
ed Load Capacit
y
(
p
sf
)
0.0 4.8 9.6 14.4 19.1 23.9 28.7 33.5 38.3 43.1 47.9 52.6 57.4 62.2 67.0 71.8 76.6 81.4 86.1 90.9 95.7
0.0 3.4 6.9 10.3 13.8 17.2 20.7 24.1 27.6 31.0
Concrete Compressive Strength Developed (MPa)
Punching Shear
Fact
or
ed Load Capacit
y
(
k
Pa)
β is defined as the ratio of the long side to the short side of the concentrated load or reaction area. In this example, the shore head is square, thus, β is equal to 1.0. The full thickness of the slab, h, is used in determining the ultimate shear resistance. After comparing these two equations, it becomes clear that equation 4.7 controls when β = 1.0. Figure 4.9 was developed from equation 4.7.
Figure 4.8 - Plain slab shore punching shear design strength load capacity (100x100 mm shore, 2.70 m primary beam, 1.6 m panel)
Using Figure 4.9, the punching shear capacity can be determined for plain concrete slab situations. To help understanding of how this figure was established, an example follows. Using the same size slab and compressive strength as in the previous example, with h = 7.5 inches, the punching shear capacity was calculated as:
φVn = 0.85[4/3 + 8/[(3)(1.0)]](15000.5)[4(3.9 + 7.5)7.5] = 45,181 lbs φVn = 0.85(2.66)(15000.5)[4(3.9 + 7.5)7.5] = 30,046 lbs
0 100 200 300 400 500 600 700 800 900 1000 1100 1200 1300 1400 1500 1600 1700 1800 1900 2000
0 500 1000 1500 2000 2500 3000 3500 4000 4500
Concrete Compressive Strength Developed (psi)
Punc hi ng She a r Fa c tor e d Loa d Ca pa c it y ( p s f) 0.0 4.8 9.6 14.4 19.1 23.9 28.7 33.5 38.3 43.1 47.9 52.6 57.4 62.2 67.0 71.8 76.6 81.4 86.1 90.9 95.7
0.0 3.4 6.9 10.3 13.8 17.2 20.7 24.1 27.6 31.0
Concrete Compressive Strength Developed (MPa)
It is clear that the second equation controls. Therefore, using the same tributary area as in the previous example, the ultimate punching shear capacity is approximately 586 lbs/ft2.
4.4 Flexural Capacity
Flexure of the early age slab spanning between shores after stripping must also be considered. A series of analyses considering one way and two way action along with moments generated in both directions of the slab section have been developed. The equations used for the nominal strength of a concrete section and the factored loads can be found in ACI 318-05, Chapter 9.
φMn = φ[Asfy(d - a/2)] (4.8)
where a = Asfy / 0.85f’cb
Mu = wl2/8 simple span (positive moment) (4.9)
Mu = wl2/10 continuous span (negative moment) (4.10)
4.4.1 Reinforced Flexural Capacity
provided considering both continuous spans and simple spans, with the latter assuming flexural cracking may develop over the shores as indicated in Figure 4.9.
Figure 4.9 Moment resistance with and without negative moment capacity
ACI 318-058 gives the following equations for minimum area of steel.
As,min = 3[(f’c0.5)/(fy)]bd (4.11)
but not less than
200bwd/fy (4.12)
Examining these two equations, equation 4.12 controls for concrete strengths less than 4500 psi. A 28 day strength of 4000 psi or higher is typically used in modern construction, so equation 4.12 provides the conservative lower bound for reinforcement that should be available.
Because flexure occurs in both directions of the two-way slab simultaneously, an adjustment is made to the one-way moment capacities calculated. ACI 318-058 states that for factored moments in column strips, the column strip shall be proportioned to resist portions in percent of interior negative moment as shown in Table 4.1
Mc
The variable α1 is the ratio of flexural stiffness of a beam section to the flexural stiffness of a
width of slab. Since there are no beams, α1 is zero. Therefore, the column or “shore” strip
shall be proportioned to resist 75% of the factored moment.
Table 4.1 Factored moments in column strips
l2/l1 0.5 1.0 2.0
α1l2/l1 = 0 75% 75% 75% α1l2/l1 > 1.0 90% 75% 45%
This will increase load capacities for a two-way slab system. In Figures 4.11 and 4.12 respectively, one-way and two-way flexural capacity in the direction parallel to the beam are illustrated. These capacities were calculated based on the assumption of a reinforced, simply supported beam.
Figure 4.10 - Reinforced slab shore one way flexural factored load capacity (100x100 mm shore, 2.70 m primary beam, 1.6 m panel)
0 100 200 300 400 500 600 700 800 900 1000 1100 1200 1300 1400 1500 1600 1700 1800 1900 2000
0 500 1000 1500 2000 2500 3000 3500 4000 4500
Concrete Compressive Strength Developed (psi)
One W
ay Fl
exur
e
Fact
or
ed Load Capaci
ty
(
p
sf
)
0.0 4.8 9.6 14.4 19.1 23.9 28.7 33.5 38.3 43.1 47.9 52.6 57.4 62.2 67.0 71.8 76.6 81.4 86.1 90.9 95.7
0.0 3.4 6.9 10.3 13.8 17.2 20.7 24.1 27.6 31.0
Concrete Compressive Strength Developed (MPa)
One W
ay Fl
exur
e
Fact
or
ed Load Capaci
ty
(
k
Pa)
Figure 4.11 - Reinforced slab shore two way flexural factored load capacity (100x100 mm shore, 2.70 m primary beam, 1.6 m panel)
Both of these figures illustrate the moments calculated in the direction parallel to the column or “shore” strip. Moments were also calculated in the direction perpendicular to the column strips. Depending on the span between supports, the parallel or perpendicular direction may control. Figure 4.13 illustrates the shore strip that was used in the flexural analysis.
Using equation 4.11, the minimum area of steel for the column strip can be calculated.
As,min = 200*33.4*6/60,000 = 0.669 in2
Using this information, “a” can now be calculated as:
a = (0.669)(60,000) / (0.85)(1500)(33.4) = 0.9411 in. This allows the calculation of the flexural capacity as:
φMn = 0.9[0.669(60,000)(6-0.9411/2)] / 12 = 16,646 ft-lbs
0 100 200 300 400 500 600 700 800 900 1000 1100 1200 1300 1400 1500 1600 1700 1800 1900 2000
0 500 1000 1500 2000 2500 3000 3500 4000 4500
Concrete Compressive Strength Developed (psi)
Two Way Fl
exur
e
Fact
or
ed Load Capaci
ty
(
p
sf
)
0.0 4.8 9.6 14.4 19.1 23.9 28.7 33.5 38.3 43.1 47.9 52.6 57.4 62.2 67.0 71.8 76.6 81.4 86.1 90.9 95.7
0.0 3.4 6.9 10.3 13.8 17.2 20.7 24.1 27.6 31.0
Concrete Compressive Strength Developed (MPa)
Two Way Fl
exur
e
Fact
or
ed Load Capaci
ty
(
k
Pa)
Using equation 4.9, the calculated moment capacity can be converted into a uniform line load. Then dividing by the total tributary width of 5.57 ft (1.7 m) between shores, a maximum factored distributed load, qu, that can be supported can be calculated as:
qu = (16,646/0.75)(8) / (9.1)2(5.57) = 378 lbs/ft2
Figure 4.12 Plan view of shore strip
4.4.2 Plain Concrete Flexural Capacity
The possibility of the “shore strip” being in an area of the permanent structure where the slab has negative moment only and thus no bottom steel must be investigated. For this situation, the construction strength is based on the slab cracking strength. The analysis performed assumes that any reinforcement in the concrete section does not contribute to the flexural strength. The only reinforcement in this area would be for temperature and
Beam = 270 cm
Panels
160 cm x 80 cm
42.5 cm
shrinkage and load resistance is provided only by the strength of the plain concrete. ACI 3188 Chapter 22 limits the flexural capacity of plain concrete as shown in equation 4.13.
φMn = φ5(f’c0.5)S (4.13)
where “S” is the elastic section modulus of the cross section. The section modulus of a rectangular cross section is defined as bh2/6. The width of the section is the width of the “shore” strip. The height is the full thickness of the slab. For the “shore” strip,
S = (33.4)(7.5)2 / 6 = 313 in3
The cracking strength can now be calculated using equation 4.13 as:
φMn = 0.9[5(15000.5)(313)] / 12 = 4,545 ft-lbs
Using equation 4.10, the calculated moment capacity can be converted into a uniform line load. Then dividing by the total tributary width of 5.57 ft (1.7 m) between shores, a maximum factored distributed load, qu, that can be supported can be calculated as:
qu = (4545)(10) / (9.1)2(5.57) = 99 lbs/ft2 for one way action
qu = (4545/0.75)(10) / (9.1)2(5.57) = 132 lbs/ft2 for two way action
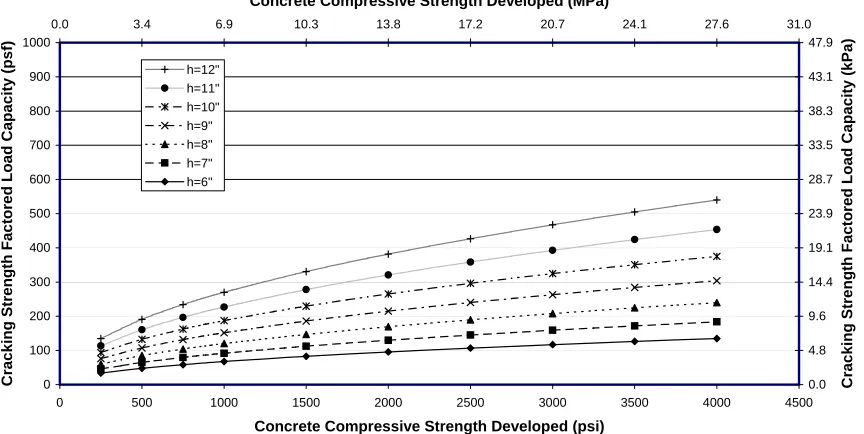
Figure 4.13 - Plain slab shore one way cracking strength factored load capacity (100x100 mm shore, 2.70 m primary beam, 1.6 m panel)
Figure 4.14 - Plain slab shore two way cracking strength factored load capacity (100x100 mm shore, 2.70 m primary beam, 1.6 m panel)
0 100 200 300 400 500 600 700 800 900 1000
0 500 1000 1500 2000 2500 3000 3500 4000 4500
Concrete Compressive Strength Developed (psi)
Cr acki ng St re ngt h Fact or
ed Load Capaci
ty ( p sf ) 0.0 4.8 9.6 14.4 19.1 23.9 28.7 33.5 38.3 43.1 47.9
0.0 3.4 6.9 10.3 13.8 17.2 20.7 24.1 27.6 31.0
Concrete Compressive Strength Developed (MPa)
Cr acki ng St re ngt h Fact or
ed Load Capaci
ty ( k Pa) h=12" h=11" h=10" h=9" h=8" h=7" h=6" 0 100 200 300 400 500 600 700 800 900 1000
0 500 1000 1500 2000 2500 3000 3500 4000 4500
Concrete Compressive Strength Developed (psi)
C ra c k ing S tre ngth Fa c tore d Loa d C a pa c ity (ps f) 0.0 4.8 9.6 14.4 19.1 23.9 28.7 33.5 38.3 43.1 47.9
0.0 3.4 6.9 10.3 13.8 17.2 20.7 24.1 27.6 31.0
Concrete Compressive Strength Developed (MPa)
4.4.3 Cracking Moment in Reinforced Section
In some structures there may be a concern to avoid visible cracking in the concrete slab at the time of stripping the form panels. Therefore, an analysis of slab crack development due to early loading is required. The concern is not preventing collapse since the structure is reinforced, rather it is predicting the working loads that would cause cracks to occur. Analysis is based upon the same assumptions as for the plain concrete slab cracking strength except that the cracking stress is based on a value estimating the actual tensile strength of concrete, rather than a reduced value. Neville13 has suggested an estimated of tensile strength as 9.5(f’c0.5). Thus, the flexural cracking strength will be determined as:
φMcr = φ9.5(f’c0.5)S (4.14)
Figure 4.15 - Plain slab shore one way crack development load capacity (100x100 mm shore, 2.70 m primary beam, 1.6 m panel)
Figures 4.15 and 4.16 show the maximum loads at which cracks will occur in a concrete section. The values in these figures include the weight of the slab itself. The self
0 100 200 300 400 500 600 700 800 900 1000
0 500 1000 1500 2000 2500 3000 3500 4000 4500
Concrete Compressive Strength Developed (psi)
Cr
ack Devel
opment
Load Capaci
ty
(
p
sf
)
0.0 4.8 9.6 14.4 19.1 23.9 28.7 33.5 38.3 43.1 47.9
0.0 3.4 6.9 10.3 13.8 17.2 20.7 24.1 27.6 31.0
Concrete Compressive Strength Developed (MPa)
Cr
ack Devel
opment
Load Capaci
ty
(
k
Pa)
weight of the slab would have to be deducted in order to determine the maximum superimposed load. For example, consider the case in which a two-way slab had a thickness of 7.5 in. and the slab had developed a concrete compressive strength of 1500 psi. From Figure 4.16, the load capacity at which cracks would begin to occur is about 250 psf. Subtracting the self-weight of the slab (90.6 psf) would indicate crack development would occur at an applied load of about 190 psf.
Figure 4.16 - Plain slab shore two way crack development load capacity (100x100 mm shore, 2.70 m primary beam, 1.6 m panel)
4.5 Beam Shear
ACI 3188 defines beam shear capacity as φVn, which is dependent upon the
compressive strength of the concrete section along with any added strength from shear reinforcement. With the assumption that there is no shear reinforcement within the slab, φVn
becomes φVc. ACI 318-058 defines the parameters for beam shear capacity as:
φ = φ 0.5
0 100 200 300 400 500 600 700 800 900 1000
0 500 1000 1500 2000 2500 3000 3500 4000 4500
Concrete Compressive Strength Developed (psi)
Cr
ack Devel
opment
Load Capaci
ty
(
p
sf
)
0.0 4.8 9.6 14.4 19.1 23.9 28.7 33.5 38.3 43.1 47.9
0.0 3.4 6.9 10.3 13.8 17.2 20.7 24.1 27.6 31.0
Concrete Compressive Strength Developed (MPa)
Cr
ack Devel
opment
Load Capaci
ty
(
k
Pa)
The variables “b” and “d” are the width of the “shore” strip and the depth of the slab, respectively. Using equation 4.15, the beam shear capacity can be calculated as:
φVc = 0.85(2)(1500)0.5(33.4)(6) = 13,220 lbs
The maximum shear force to be resisted is taken as the shear at the center of the support. A more precise required shear would be that at d/2 away from the support. However, the former is more conservative and, as shown in Figure 4.17, it is unnecessary to calculate shear at any other point along a beam. Figure 4.18 provides the capacity based on shear strength for various slab depths and concrete compressive strengths.
Figure 4.17 – Shear force diagram
Figure 4.18 - Reinforced slab shore beam shear load capacity (100x100 mm shore, 2.70 m primary beam, 1.6 m panel)
V
0 100 200 300 400 500 600 700 800 900 1000
0 500 1000 1500 2000 2500 3000 3500 4000 4500
Concrete Compressive Strength Developed (psi)
B
eam S
h
ear F
acto
red
L
o
a
d
C
a
p
acity (p
sf)
0.0 4.8 9.6 14.4 19.1 23.9 28.7 33.5 38.3 43.1 47.9
0.0 3.4 6.9 10.3 13.8 17.2 20.7 24.1 27.6 31.0
Concrete Compressive Strength Developed (MPa)
B
eam S
h
ear F
acto
red
L
o
a
d
C
a
p
acity (kP
a
)
5. EXAMPLE USE OF ANALYSIS RESULTS
5.1 Introduction
The purpose of this chapter is to compare the results from the strength analysis to the actual factored loads that are required for a specific case. For the examples, the slabs will have a thickness, h, of 7.5” and have developed a concrete compressive strength of 1500 psi at the time of load application.
5.2 Construction Dead Load
Dead loads applied include the elements of the forming system and the dead weight of the slab. It can be reasonably assumed that the unit weight of the concrete is 145 pcf. This density of concrete includes normal reinforcement that may be in the slab. For the 7.5” slab, the dead load is:
D = (145 lbs/ft3)(7.5 in)(1 ft/12 in) = 90.6 lbs/ft2 (5.1)
5.3 Construction Live Load
The construction live load consists of workers and equipment and is defined as CP by
concentrated and few tools are involved; thus the uniform load associated with very light duty is applicable. Very light duty corresponds to a personnel load, CP, of 20 lb/ft2.
5.4 Construction Material Load
The next area of concern is material load applied during the setup of the formwork, shores, beams, and panels. The material load could consist of a transport angle fully loaded with forming panels or a full rack of primary beams or secondary beams as shown in Figure 5.1. Only one can occupy a given area at a given time. Table 5.1 lists the different parts of a transport angle.
Table 5.1 Fully loaded transport angle weight Total Weight
Item Weight
(kg) No. (kg) (lbs)
Folding angle 17.0 2 34.0 75.0
Rigid angle 12.9 2 25.8 56.9
Swivel wheels 1.2 4 4.8 10.6
MD-panels 24.0 12 288.0 634.9
Total 352.6 777.35
Figure 5.1 – Fully loaded transport angle and piling rack (courtesy of Meva)
Table 5.2 Fully loaded piling rack Total Weight
Item Weight
(kg) No. kg lbs
Piling Rack 155 1 155 341.7
Primary Beam 23 20 460 1014.1
Total 615 1355.8
Piling Rack 155 1 155 341.7
Secondary Beam 9 50 450 1014.1
Total 605 1333.8
5.5 Factored Load Combinations
The calculated loads can now be factored and combined in accordance with SEI/ASCE 379 as discussed in Chapter 2. Since the racks have a fixed configuration and a maximum loading arrangement, they can be considered to be a fixed material load, CFML. In
other cases in which the construction material may be stored more loosely, it may be more appropriate to consider it as variable material load.
Using these load factors, a required ultimate load is obtained for comparison to the capacities of punching shear, flexural strength, and beam shear. For the loads involved , Equation 2.1 reduces to:
UC = 1.2D + 1.6CP + 1.2CFML (5.2)
The personnel load and the material load of the rack cannot occupy the same area at the same time. Also, it must be understood that the 63 lbs/ft2 is a construction load that is applied only over the area occupied by the piling rack. In order for this load to be used in the same equation as the dead and personnel load, it must be converted to a load that is applied over the full tributary area. A conservative approximation would be to apply the personnel load, which has the higher load factor, over the entire area and to reduce the material load by:
CP(1.6/1.2) = 20(1.6/1.2) = 26.7 psf