University of Windsor University of Windsor
Scholarship at UWindsor
Scholarship at UWindsor
Electronic Theses and Dissertations Theses, Dissertations, and Major Papers
2014
Modeling of Water Quality in Canard River Watershed
Modeling of Water Quality in Canard River Watershed
Baldhir Singh
University of Windsor
Follow this and additional works at: https://scholar.uwindsor.ca/etd
Recommended Citation Recommended Citation
Singh, Baldhir, "Modeling of Water Quality in Canard River Watershed" (2014). Electronic Theses and Dissertations. 5111.
https://scholar.uwindsor.ca/etd/5111
This online database contains the full-text of PhD dissertations and Masters’ theses of University of Windsor students from 1954 forward. These documents are made available for personal study and research purposes only, in accordance with the Canadian Copyright Act and the Creative Commons license—CC BY-NC-ND (Attribution, Non-Commercial, No Derivative Works). Under this license, works must always be attributed to the copyright holder (original author), cannot be used for any commercial purposes, and may not be altered. Any other use would require the permission of the copyright holder. Students may inquire about withdrawing their dissertation and/or thesis from this database. For additional inquiries, please contact the repository administrator via email
Modeling of Water Quality in Canard River Watershed
By
Baldhir Singh
A Thesis
Submitted to the Faculty of Graduate Studies
through the Department of Civil and Environmental Engineering in Partial Fulfillment of the Requirements for
the Degree of Master of Applied Science at the University of Windsor
Windsor, Ontario, Canada
2014
Modeling of Water Quality in Canard River Watershed
by
Baldhir Singh
APPROVED BY:
______________________________________________ A. Fartaj
Mechanical, Automotive and Materials Engineering
______________________________________________ N. Biswas
Civil and Environmental Engineering
______________________________________________ T. Bolisetti, Principal Advisor
Civil and Environmental Engineering
______________________________________________ R. Seth, Co-advisor
Civil and Environmental Engineering
iii
DECLARATION OF ORIGINALITY
I hereby certify that I am the sole author of this thesis and that no part of this thesis has
been published or submitted for publication.
I certify that, to the best of my knowledge, my thesis does not infringe upon anyone’s
copyright nor violate any proprietary rights and that any ideas, techniques, quotations, or any
other material from the work of other people included in my thesis, published or otherwise, are
fully acknowledged in accordance with the standard referencing practices. Furthermore, to the
extent that I have included copyrighted material that surpasses the bounds of fair dealing within
the meaning of the Canada Copyright Act, I certify that I have obtained a written permission from
the copyright owner(s) to include such material(s) in my thesis and have included copies of such
copyright clearances to my appendix.
I declare that this is a true copy of my thesis, including any final revisions, as approved
by my thesis committee and the Graduate Studies office, and that this thesis has not been
iv
ABSTRACT
Anthropogenic activities have disturbed the naturally sustained cycles beyond their
self-recovering capabilities. Deteriorating surface water in Great Lakes has become a serious
issue. To improve the water quality, the enhanced understanding of processes and sources
of pollution is required. In this study, SWAT is used for modeling hydrological and
pollutant fate and transport processes in agricultural dominated tile drained Canard River
Watershed located in Essex County. SWAT model was developed with primary focus on
understanding trends and sources of sediments and indicator microbe E. coli. Daily
monitored weather and streamflow from 1995 to 2012 was used to calibrate and validate
the model. The daily NSE for calibration period (2001-2007) and validation period
(2009-2012) was 50% and 55% respectively. Sediments concentration and loading was
found to be higher during winter and spring while lower in fall and summer. E. coli
v
ACKNOWLEDGEMENTS
The successful completion of this research project would not have been possible without
the generous support of several people. I would like to take this occasion to thank my
graduate advisor, Dr. Tirupati Bolisetti, who not only provided sound technical guidance
and practical help, but was always full of encouragement. I am also very thankful for his
invaluable assistance towards my professional career.
My very special thanks go to Dr. Rajesh Seth for facilitating my research, scientific
guidance and for providing any possible support that a graduate student could need. I also
acknowledge his valuable insights at appropriate times which directed the course of my
research. I would also like to offer my sincere thanks to Dr. Nihar Biswas and Dr. Amir
Fartaj for their suggestions with regard to this thesis.
I wish to thank Md. Masihur Rahman for his help with data acquisition, model set up and
numerous discussions. I express my sincere gratitude to Carina (Xue) Luo for her help in
getting GIS data. Without your help, this onerous task would not have been possible. I
would also like to thank my friend Numanul Subhani for constantly encouraging me and
motivating me towards my goal.
vi
TABLE OF CONTENTS
DECLARATION OF ORIGINALITY ... iii
ABSTRACT ... iv
ACKNOWLEDGEMENTS ...v
LIST OF TABLES ... ix
LIST OF FIGURES ...x
TABLE OF APPENDIX ... xii
LIST OF ABBREVIATIONS/SYMBOLS ... xiii
CHAPTER 1:INTRODUCTION ...1
1.1 Background ... 1
1.2 Problem Definition... 6
1.3 Objectives ... 7
1.4 Structure of Thesis ... 7
CHAPTER 2:LITERATURE REVIEW ...8
2.1 Water Budget ... 8
2.2 Hydrological Cycle ... 10
2.3 Water Pollution ... 11
2.3.1 Sediments ... 12
2.3.2 Nutrients ... 13
2.3.3 Pathogens ... 13
2.4 Model Description ... 24
2.4.1 Types of models ... 25
2.4.1 Model Selection ... 26
2.4.2 Current available models ... 26
2.5 Soil and Water Assessment Tool ... 32
2.6 Summary ... 36
vii
3.1 Model Development... 38
3.2 Site Description ... 38
3.3 Data Acquisition ... 40
3.3.1 Climate Data ... 41
3.3.2 Digital Elevation Model (DEM) ... 42
3.3.3 Soil Data... 43
3.3.4 Monitored Streamflow and Sediment Data ... 44
3.3.5 Landuse and Tile Drainage ... 45
3.3.6 Crop and Management Data ... 46
3.3.7 Microbial Source Data ... 47
3.4 Arc SWAT Model Setup ... 51
3.4.1 Watershed Delineation ... 51
3.4.2 Hydrological Response Units (HRUs) ... 53
3.4.3 Land Management Operations ... 54
3.4.4 Climate Data ... 55
CHAPTER 4:CALIBRATION AND VALIDATION ...57
4.1 Sensitivity Analysis ... 57
4.1.1 Flow ... 57
4.1.2 Sediment ... 59
4.1.3. Microbial Parameters ... 60
4.2 Calibration and Validation ... 61
CHAPTER 5:RESULTS AND DISCUSSION ...64
5.1 Streamflow Time Series Analysis ... 64
5.1.1 Average Annual Flow Comparison ... 65
5.1.2 Seasonal Flow Comparison ... 66
5.1.3 Average Monthly Flow Time Series Comparison ... 67
5.1.4 Daily Flow Time Series Comparison ... 68
5.2 Water Budget Analysis ... 72
5.2.1 Annual Water Budget ... 72
5.2.2 Average Monthly Water Budget ... 73
viii
5.2.4 Sub-watershed Based Water Budget Analysis ... 76
5.3 Sediment Analysis ... 80
5.3.2 Seasonal Range Comparison: ... 83
5.3.3 Average Annual Sediment Loading Trends ... 90
5.3.4 Seasonal Sediment Loading ... 91
5.3.5 Flow vs Sediment Comparison ... 92
5.3.6 Monthly Average Loading ... 94
5.3.7 Sediment Yield ... 94
5.4 Microbial Analysis ... 95
5.4.1 Daily Concentration of E. coli ... 95
5.4.2 Average Annual E. coli Loading ... 96
5.4.3 Seasonal E. coli Analysis ... 97
5.3.4 Source Characterization ... 99
5.4.5 Sub-watershed Contribution ... 100
5.5 Summary ... 102
CHAPTER 6:CONCLUSIONS AND RECOMMENDATIONS ...103
6.1 Conclusions ... 103
6.2 Recommendations ... 105
REFERENCES ...107
APPENDICES ...127
ix
LIST OF TABLES
Table 2. 1: Ontario legislations related to water budget (AquaResource 2013) ... 9
Table 2. 2: Hydrological Model Comparison ... 28
Table 3. 1:Data Sources ... 41
Table 3. 2: Climate Station Data ... 42
Table 3. 3: Livestock Data ... 48
Table 3. 4: Septic Tanks in each Sub-Watershed ... 49
Table 3. 5: Microbial Loading from Different Sources ... 51
Table 3. 6: Microbial Parameters Values ... 55
Table 4. 1: Sensitivity Analysis for Flow Parameters ... 58
Table 4. 2: Sensitivity Analysis of Sediment Parameters ... 59
Table 4. 3: Sensitivity Analysis of Microbial Parameters ... 60
Table 5. 1: Average Annual Water Budget ... 72
Table 5. 2: Annual Water Budget from 2001 to 2012 ... 73
Table 5. 3: Seasonal Water Budget ... 76
x
LIST OF FIGURES
Figure 2. 1: Components of a Water Budget (Conservation Ontario 2009) ... 10
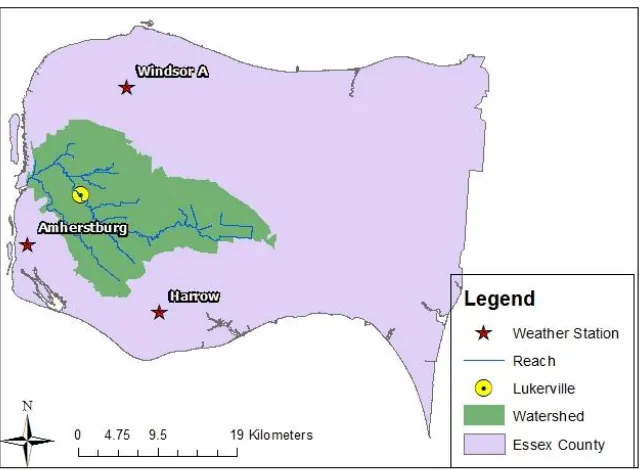
Figure 3. 1: Location of Canard River Watershed ... 40
Figure 3. 2: Digital Elevation Model (DEM)... 43
Figure 3. 3: Soils of Canard River watershed ... 44
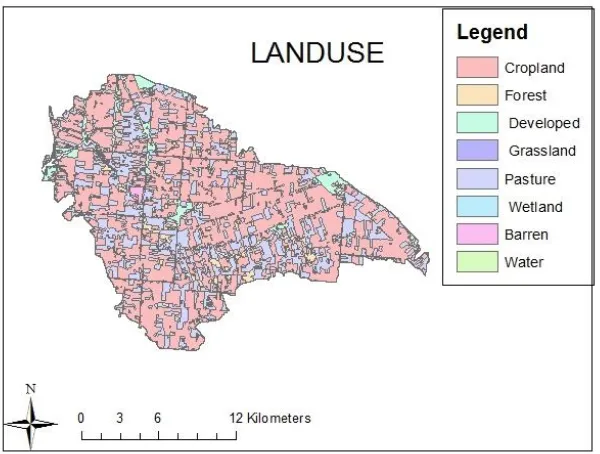
Figure 3. 4: Landuse Map of Canard River watershed ... 45
Figure 3. 5: Tile Drainage Map of Canard River watershed ... 46
Figure 3. 6: Stream, Monitoring Station and Sub-basin outlets ... 52
Figure 3. 7: Delination of watershed and sub-watersheds of Canard River watershed ... 53
Figure 4. 1: Flow Calibration (2001 - 2006) ... 62
Figure 4. 2: Flow Validation (2009 - 2012) ... 63
Figure 5. 1: Average Annual Flow Comparison ... 65
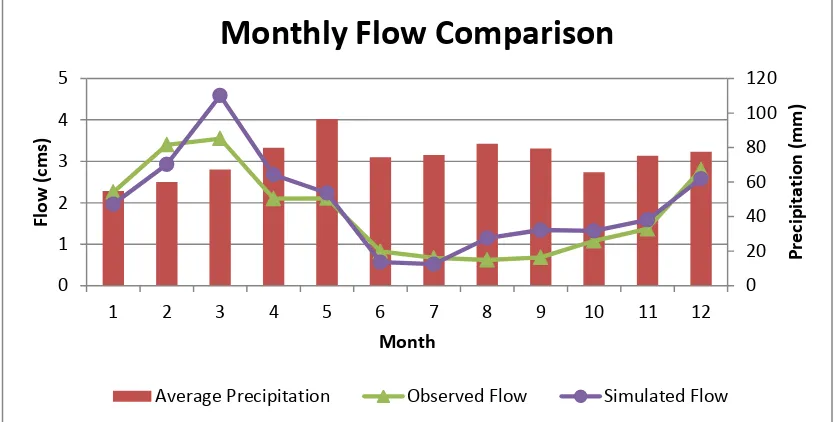
Figure 5. 2: Average Monthly Flow Comparison ... 66
Figure 5. 3: Monthly flow comparison for calibration period ... 67
Figure 5. 4: Monthly flow comparison for validation period ... 67
Figure 5. 5: Daily Observed vs Simulated Flow Comparison for 2001... 68
Figure 5. 6: Daily Observed vs Simulated Flow Comparison for 2002... 69
Figure 5. 7: Daily Observed vs Simulated Flow Comparison for 2003... 69
Figure 5. 8: Daily Observed vs Simulated Flow Comparison for 2004... 69
Figure 5. 9: Daily Observed vs Simulated Flow Comparison for 2005... 70
Figure 5. 10: Daily Observed vs Simulated Flow Comparison for 2006 ... 70
Figure 5. 11: Daily Observed vs Simulated Flow Comparison for 2009 ... 70
Figure 5. 12: Daily Observed vs Simulated Flow Comparison for 2010 ... 71
Figure 5. 13: Daily Observed vs Simulated Flow Comparison for 2011 ... 71
Figure 5. 14: Daily Observed vs Simulated Flow Comparison for 2012 ... 71
Figure 5. 15: Average Annual Water Balance ... 73
Figure 5. 16: Average Monthly Water Budget Analysis ... 74
Figure 5. 17: Seasonal Water Budget ... 75
Figure 5. 18: Precipitation Distribution in Canard River Watershed... 77
Figure 5. 19: Evapotranspiration Distribution in Canard River Watershed... 78
Figure 5. 20: Water Yield Distribution in Canard River Watershed ... 79
Figure 5. 21: Surface Runoff Distribution in Canard River Watershed ... 80
Figure 5. 22: Observed sediment concentration range during storm event ... 82
xi
Figure 5. 24: Simulated sediment concentration range during storm event ... 83
Figure 5. 25: Simulated sediment concentration range during baseflow ... 84
Figure 5. 26: Comparision of Observed and Simulated Sediment Concentration Range during Winter ... 85
Figure 5. 27: Average Sediment Loading during Winter ... 85
Figure 5. 28: Comparision of Observed and Simulated Sediment Concentration Range during Winter ... 87
Figure 5. 29: Average Sediment Loading during Spring ... 87
Figure 5. 30: Comparision of Observed and Simulated Concentration Sediment Range during Summer... 88
Figure 5. 31: Average Sediment Loading during Summer ... 89
Figure 5. 32: Comparision of Observed and Simulated Concentration Sediment Range during Fall ... 90
Figure 5. 33: Average Sediment Loading during Fall ... 90
Figure 5. 34: Average Annual Sediment Load (ton/day) ... 91
Figure 5. 35: Average Seasonal Sediment Load (ton/day) ... 92
Figure 5. 36: Flow vs Sediment Loading ... 93
Figure 5. 37: Flow vs Sediment Concentration ... 93
Figure 5. 38: Average Monthly Sediment Loading ... 94
Figure 5. 39: Sediment Yield in Canard River Watershed ... 95
Figure 5. 40: Daily E. coli concentraion ... 96
Figure 5. 41: Average Annual E. coli Loading ... 97
Figure 5. 42: Average E. coli concentration during Winter ... 97
Figure 5. 43: Average E. coli concentration during Spring ... 98
Figure 5. 44: Average E. coli concentration during Summer ... 98
Figure 5. 45: Average E. coli concentration during Fall... 99
Figure 5. 46: E. coli concentration levels per sub-watershed ... 101
xii
TABLE OF APPENDIX
Table A 1: Annual Observed vs Simulated flow comparison... 127
Table A 2: Average Monthly and Seasonal Flow Comparison ... 128
Table A 3: Average Monthly Water Budget ... 129
Table A 4: Winter Water Budget Analysis from 2001-2012 ... 130
Table A 5: Spring Water Budget Analysis from 2001 - 2012 ... 132
Table A 6: Summer Water Budget Analysis from 2001 - 2012 ... 133
Table A 7: Fall Water Budget Analysis from 2001 - 2012 ... 135
Table A 8: Sub-watershed wise Water Budget Analysis ... 136
Table A 9: Sub-watershed wise Sediment Yield ... 137
Table A 10: Seasonal E. coli Average Concentration (CFU/100ml) ... 138
xiii
LIST OF ABBREVIATIONS/SYMBOLS
AGNPS Agricultural Non-Point Source
ANSWERS Areal Non-point Source Watershed Environment Response Simulation
AOC Area of Concern
BMPs Best Management Practices BWQM Bacterial Water Quality Model CANSIS Canadian Soil Information System CFOs Confined Feeding Operations
CFU Coliform Forming Units
COA Canada-Ontario Agreement
CREAMS Chemicals, Runoff, and Erosion from Agricultural Management Systems
DEM Digital Elevation Model
DFO Federal Department of Fisheries and Oceans
E. coli Escherichia coli
EPIC Erosion Productivity Impact Calculator ERCA Essex Region Conservation Authority
FEFLOW Finite element sub-surface flow and transport simulation system FORTRAN Formula Translating System
GAWSER Guelph All Weather Storm Event Runoff Model GIS Geographic Information System
GLEAMS Groundwater Loading Effects on Agricultural Management Systems
GLUE Generalized Likelihood Uncertainty Estimation GLWQA Great Lakes Water Quality Agreement
GRASS Geographic Resources Analysis Support System GSFLOW Coupled ground-water and surface-water flow model
HEC-HMS Hydrologic Engineering Center – Hydrologic Modeling System
HRU Hydrologic Response Unit
HSPF Hydrologic Simulation Program Fortran HydroGeo
Sphere
3-D Physical Finite Element Model
IJC International Joint Commission ILOs Intensive Livestock Operations InHM 3-D Physical Finite Element Model
LIO Land Information Ontario
LSPC Loading Simulation Program in C++
Masl Meters Above Sea Level
MCMC Markov Chain Monte Carlo
Mike SHE The European Hydrological System Model MNR Ontario Ministry of Natural Resources
MODFLOW Modular finite difference ground-water flow model MOE Ontario Ministry of the Environment
xiv
NSE Nash-Sutcliffe Efficiency
OGDE Ontario Geospatial Data Exchange
OMAFRA Ontario Ministry of Agriculture, Food and Rural Affairs ParaSol Parameter Solution
PRMS Precipitation Runoff Modeling System PSO Particle Swarm Optimization
QUAL2E Enhanced Stream Water Quality Model QUALHYMO Surface Water Model
SCS Soil Conservation Service SSQR Sum of squares of the difference SUFI Sequential Uncertainty Fitting SWAT Soil Water Assessment Tool
SWMM Storm Water Management Model
SWRRB Simulator for Water Resources in Rural Basins USDA United States Department of Agriculture
US EPA United States Environmental Protection Agency
UV Ultra Violet
WAM Watershed Assessment Model
WARMF Watershed Analysis Risk Management Framework
1
CHAPTER 1
INTRODUCTION
1.1 Background
In the recent years, human activities have significantly deteriorated environment. Over
exploitation and unsustainable practices resulted in degradation of natural environment
and resource depletion. Rapid industrialization, urbanization and intensive farming not
only resulted in soil, air and water pollution; but also created global problems like ozone
depletion, climate change, and global warming. Degradation of water resources has
emerged as one of the most daunting challenges faced by most nations of the world. In
this era, water is considered as most valuable resource. It finds its application in almost
all spheres of human life. Impairment of water bodies across the globe rendered surface
water unfit for drinking, domestic, agriculture, fishing, and industrial purposes.
Moreover, it hampered the survival of aquatic flora and fauna along with deteriorating the
aesthetic aspects of environment.
The Great Lakes constitute the largest fresh water system in North America comprised of
five main lakes interconnected by series of rivers, waterfall and small lakes. They are
spread across the US-Canada border and contain 84% of North America’s fresh surface
water, which is about 21% of world’s fresh water supply (Schulte, 2013 and US EPA
Great Lakes, 2012). Europeans arrived in this region in 1700s and settled along the coast
of lakes and rivers. Since then these water bodies were used extensively for shipping,
trading, drinking, industrialization, recreation and US-Canada border (Green et. al.,
2010). International Joint Commission (IJC) was created by US and Canada in 1909 for
2
shipping, hydroelectricity, agriculture, industry, fishing, recreation and shoreline property
(IJC, 2013). Great Lakes Water Quality Agreement (GLWQA) was signed in 1972
between these two nations, binding them to control pollution and cleaning up industrial
and communities’ waste water being released into water bodies. Canadian federal
government signed Canada-Ontario Agreement (COA) with Ontario provincial
government to restore, protect and conserve the Great Lakes Basin Ecosystem. Detroit
River was designated as Great Lakes Area of Concern (AOC) in 1987 due to
contaminated sediments, fish consumption advisories, combined sewer outflows, and loss
of wildlife and fish habitat (Green et. al., 2010).
Essex County has 23 sub-watersheds that drain water into Lake Erie, Lake St. Clair and
Detroit River. This region is regulated by Essex Region Conservation Authority (ERCA)
which was established in 1973 to restore and conserve county’s original character. ERCA
manages this region on watershed basis (ERCA, n.d.). The major challenges confronted
by ERCA include drinking water quality, bacterial beach contamination, algal blooms
and eutrophication, in-stream and lake low dissolved oxygen, loss of fish and wildlife
habitat, recreation and tourism, fishing, etc. To understand the water quality conditions
better, ERCA initiated several regional surface water monitoring programs including 36
in-stream and 28 near shore monitoring stations, flow monitoring at certain locations and
wet/regular weather sampling. It also started four pilot watershed monitoring studies in
Belle River, Little River, Canard River and Big Creek watersheds (Bejankiwar, 2010).
Watershed is a geographical area that drains its precipitation into single river or lake. As
a single watershed may be spread across different municipal boundaries, thus regulatory
3
administrative authorities. Watershed may have different landuse patterns, different soil
types, and different management operations and practices which affect the hydrological
processes. In order to manage the watershed properly better understanding of these local
conditions and processes is utmost important.
The hydrological cycle starts with precipitation chiefly in the form of rain or snow. After
precipitation, water infiltrates into soil enriching water table and also percolate deeper to
enrich deep aquifers. The water in vadose zone is withdrawn by roots and released back
to atmosphere by evapotranspiration from the stomata openings in leaves. When soil is
saturated, the excess water gets stored in depressions. After filling the depressions, the
water start flowing on the surface of earth along the slope in the form of sheet and known
as sheet flow or surface runoff. It keeps on flowing on the surface until it reaches nearby
reach or stream and starts flowing in stream known as streamflow. As the friction in
stream is less as compared to surface, the velocity of water in stream is higher. This
streamflow reaches rivers and lakes. But during its flow on land surface, sediments and
various chemicals like petrol, fertilizers, paints, metal particles, pesticides, insecticides,
nutrients like phosphorus and nitrogen, and microbial contaminants get washed away and
reach water bodies making water unfit for aquatic life as well as for human use.
Water balance analysis provides knowledge about the amount of water available in form
of surface water or ground water for a watershed; as well as its inflows and out flows. It
categorizes total water entering the watershed in the form of precipitation or artificial
inflow and its egression in the form of surface runoff, evapotranspiration, baseflow or
removal for human consumption. This analysis helps in better estimation of available
4
appropriate land use management practices and techniques for enhancing the water
quality. The impact of change in land use pattern on water budget should also be
considered before implementation.
Water quality is impacted by sediments, nutrients, chemicals and pathogens washed off
by water flowing on land surface. These loadings can be estimated based upon the
particular characteristics of watershed. Loadings can be categorized in two types i.e.
point and non-point source loadings. Point source loading arises from single identifiable
source that enter the stream at one point like sewage and industrial discharges; while
non-point source loadings are those which originate from many diffuse sources spread over
the space like runoff containing pesticides from agricultural area entering river. Point
source loadings are almost constant throughout the year and mostly treated before
discharging into streams. The discharge quality standards are set by regulatory authorities
and they are monitored regularly to ensure safe water quality. The non-point sources lead
to sudden surge in the pollution levels during precipitation and surface runoff events.
Therefore estimating the effect of non-point sources on loading becomes significant for
estimating the water quality and ensuring safety standards. It also becomes important to
identifying the major contributing factors to develop strategies for reducing loading rates.
Maintaining and preserving water source quality has become top priority in the wake of
recent disasters. As evident from Walkerton, Ontario accident in 2002, the contamination
of drinking water with E.coli and Campylobacter jejeuni caused bloody diarrhea and
gastrointestinal infections in more than 2300 people and death of seven persons (Dennis
2002). Detection of pathogens in water source alarmed the regulatory authorities to
5
the health and safety of residents. Pathogens namely fecal coliform, protozoa and viruses
are excreted by animals and humans. They can contaminate water by point or non-point
sources. Point source contamination includes discharge of untreated sewage or combined
sewer. Non-point sources of pathogens include spatially dispersed human, wild animals,
pets, livestock and manure application on fields. Better source characterization is utmost
important for identifying the significant contributor and for designing the control
strategies. Best management practices for handling livestock and manure application
need to be developed for prevention of potential surface and groundwater contamination.
Modeling complex processes governing the hydrology, sediment erosion, nutrients and
pathogen pollution by using software model tools enabled the scientific community to
understand, verify and implement the best management practices. These tools provide the
opportunity to estimate loadings from contributing sources, forecasting and determining
the impact of climate change on each parameter. Various models have been developed
and find wide application based on their area of expertise. Soil Water Assessment Tool
(SWAT) is one such tool which simulates the hydrological, sediment, nutrient, pesticide
and bacterial processes on a continuous, daily basis. SWAT was developed by USDA
Agricultural Research Service. It is suitable for simulating watersheds with predominant
agricultural areas. It has been used extensively for performing water balance, nutrients
and sediment analysis all across the globe. Recently incorporated bacterial fate and
transport module has been explored by few researchers to analyze the pathogen loadings.
Large spatial and temporal variability of microbial contamination and limited data
6
This research is based on Canard River watershed located in Essex County. It is the
largest watershed in this region that drains water in Detroit River. This study is focused
on simulating the water balance based on observed meteorological and flow data. It also
tried to determining the important parameters related to sediment loadings and correlate
the simulated trends with limited observed data. Based on limited available data related to
microbial sources, this study also performed the sensitivity analysis for detecting key
factors influencing the microbial fate and transport which can be monitored and verified
in future.
1.2 Problem Definition
The water budgeting process provides quantitative and qualitative analyses of water in a
watershed. In Canard River Watershed water budget analysis could assist in addressing
the potential issues related to impact of development, pumping rates from different
sources and assessing the effect of different water use activities. The streams are fed by
snow melt and runoff, but during summer they generally become dry posing significant
stress. Significant area of watershed is under tile drainage, but its impact on local
hydrology is not clearly understood. The quantitative analysis can put some light on these
problems and help in better management of water. Essex Region Conservation Authority
has found high concentration of E. coli in several grab samples collected over different
regions indicating poor to worse water quality in this region. Higher E. coli concentration
in near shore areas has led to closure of several beaches on Lake Shoreline. More over
algal blooms in Lake Erie has also been attributed to higher nutrient loadings from
draining areas. Sediments settled at river bed pose serious threats to ships passing through
7
quality analysis can assist in understanding the key processes involved for abating these
challenges. To counter these problems following objectives were defined:
1.3 Objectives
The major objectives of the study are
To perform Water Balance
To estimate Sediment Load
To advance the current knowledge on microbial fate and transport processes in
tile drained watershed by using GIS based ARC SWAT Model.
To determine the major contributing sources for sediment and microbial loadings
1.4 Structure of Thesis
This thesis is composed of six chapters. First chapter provides introductory knowledge
about this study followed by defining the problem statement and objectives to be
achieved. Chapter two provides elaborated discussion on literature reviewed for
understanding the processes involved in water quality modeling and different approaches
for solving the problem. Chapter three provides insight on methodology and hydrological
model setup for Canard River Watershed. Sensitivity analysis, calibration and validation
of model are discussed in chapter four. Various findings about water budget, sediment
and microbial processes are discussed in chapter five. Conclusion and recommendations
8
CHAPTER 2
LITERATURE REVIEW
The literature was reviewed for understanding the mechanisms regulating the hydrology
and contaminant fate and transport within the watershed. This section discusses the
underlying conceptual framework which guided this study. A comprehensive review has
been provided on different processes governing hydrology, sediment, nutrients, and
microbial sources, persistence and transport on surface, in soil and in stream. It is
followed by different modeling approaches used to simulate these processes.
2.1 Water Budget
Water budget is a process of quantifying various components of hydrological cycle
within a watershed. It involves analysis of quantities of water inflows, outflows, uses and
storage within a particular geographic area due to natural and anthropogenic activities.
Effective water management and formulation of land use development strategies are
based on sound water budget. In Ontario, water budgeting is considered an essential step
to support decision making in water management activities namely, source protection
planning, water permitting, low water response, sub-watershed and watershed planning,
environmental impact assessment and dam/reservoir management.
There are several Ontario legislations related to water budget which are combined under
The Living Water Policy Project, 2010, E-Laws Ontario, 2010 (AquaResource, 2013).
9
Table 2. 1: Ontario legislations related to water budget (AquaResource 2013)
Regulatory Authority
Legislation Water Budget Application
Ontario Ministry of the
Environment (MOE)
Clean Water Act, 2006, S.O. 2006, c. 22
Identify potentially hydrologically stresses sub-watersheds
Identify municipal water supplies that may not be able to meet current or planned future water demands
Environmental
Assessment Act, 1976, 1997
To determine the hydrologic, hydrogeologic and ecologic impact of a proposed project
Environmental Bill of Rights, 1993, S.O. 1993, c. 28
To identify applications for permits to take water and other items that may be relevant to water budgets
Ontario Water
Resources Act, R.S.O. 1990, c. O.40
To develop strategies for managing water takings
Required in other areas like wastewater assimilation
Safeguarding and Sustaining Ontario’s Water Act, 2007
To report water use information for regulatory commitments on the local, watershed, and Great Lakes scale
Water Opportunities Act, 2010
For assessment of sustainable development and conservation planning Ontario Ministry of Natural Resources (MNR) Aggregate Resources Act, R.S.O., 1990, c. A.8
To estimate possible impacts of pits or quarries on groundwater and surface water resources, and mitigation
To analyze pre and post development
hydrologic and hydrogeologic conditions for the rehabilitation of the aggregate extraction site Conservation
Authorities Act, R.S.O. 1990, c. C.27
For flood control, reservoir management and sub-watershed planning
Lakes and Rivers Improvement Act, R.S.O. 1990, c. L.3
To estimate hydrologic parameters like
streamflow, reservoir storage, outflow required for designing and analysis of dams
Federal Department of Fisheries and Oceans (DFO)
Fisheries Act, R.S., 1985, c. F-14
To estimate in-stream flows and other
hydrological impacts that may influence aquatic health
Ontario Ministry of
Agriculture, Food and Rural Affairs
(OMAFRA)
Nutrient Management Act, 2002, 2009
10
2.2 Hydrological Cycle
The accurate estimation and understanding the dynamics of hydrological cycle
components are mandatory in order to address the above legislations. The hydrological
cycle can be studied on different spatial (Watershed, Sub-watershed, Catchment) and/or
temporal scales (Seasonal, Annual, Long term). The most important components include
precipitation, interception storage, depression storage, infiltration, surface runoff,
evapotranspiration, unsaturated flow, shallow and deep aquifer recharge, snow melt,
baseflow, and streamflow as shown in Figure 2.1.
Figure 2. 1: Components of a Water Budget (Conservation Ontario 2009)
All components of water balance can be expressed by equation 2.1:
11
where;
P = Precipitation
RO = Surface runoff
AET = Actual evapotranspiration
I = Interflow
D = Groundwater discharge
A = Anthropogenic inputs (septic systems) and/or supplies/abstractions
Δl = Change in land surface storage
Δs = Change in soil moisture storage
Δg = Change in groundwater storage
2.3 Water Pollution
Water carries various pollutants while flowing on the land surface, passing through
soil-pores and migrating through tiles. Pollutant particles gets dissolved in water or carried as
suspended particulate matter. It can be of organic or inorganic nature. It can also be
classified as natural or artificial. Weathering of rocks, soil erosion, dissolution of various
minerals etc. are natural processes but it’s the human introduced artificial chemicals,
different land use and management practices, that led to change in natural settings and
disturbed the pristine natural healing ability of nature. The main pollutants that are under
the radar of conservation authorities include sediments, plant nutrients, toxic chemicals,
pesticides, fertilizers, and pathogenic strains of bacteria, protozoa and viruses. They are
posing severe environmental and health challenges thus demand keen attention and quick
12
2.3.1 Sediments
Sediments are the soil particles that are formed from weathering of rocks by wind, rain,
snow, plants, animals, or human activities. These particles vary greatly in size from few
microns to millimeters in diameter. They are generally divided into three categories based
on size and properties, sand (largest particles that settle quickly), silt (intermediate sized
particles) and clay (smallest, negatively charged particles that don’t settle quickly in fresh
water). Sediments are eroded on land surface by sheet, rill or gully erosion while in river
they are eroded from stream bed or banks. Erosion depends upon intensity of rainfall,
vegetation cover, season, land use and management, soil type, and slope. Agricultural
activities like tillage, ploughing, and fallow land as well as deforestation hastens soil
erosion. In streams, the sediments get eroded from bank and bed during high streamflow
intensity.
Sediment loss from agriculture areas reduces soils fertility. They deposit in rivers and
reservoirs clogging beds and reduce percolation. Moreover deposition reduces carrying
capacity of river by reducing channel depth, which hinders navigation as well. River and
lake dredging incurs additional costs. Enhanced turbidity reduces sunlight penetration in
river water that promotes pathogen growth and limit available energy for aquatic
autotrophs. This hinders aquatic life survival and habitat. Sediments also act as carrier for
other pollutants. Different chemicals and pathogens stick to sediments and are
transported, buried and resuspended along with them in rivers and lakes. They also
harbor and thrives pathogens in rivers beds, which gets suspended by vigorous churning
13
2.3.2 Nutrients
Nutrients are essential elements that are required for plant growth. They enter water
bodies along with sediments or as dissolved solids during agricultural runoff or baseflow.
Limited amount of nutrients in streams is required for healthy aquatic life, but excess of
these nutrients result in algal blooms. Algal blooms consume most nutrients and
dissolved oxygen and limit their supply for other aquatic life forms. The decaying algae
also excavate more oxygen leaving the water bodies unfit for aquatic flora and fauna.
Among all nutrients phosphorus has been found to be rate limiting due to it less
availability. Thus more focus is concentrated on its control.
The nutrient loads generally occur from agricultural runoff similar to sediment loadings.
But tile flow also contributes significantly to this loading in heavily tile drained
watersheds. These loadings can be minimized by adapting Best Management Practices
(BMPs). These practices provide practical, affordable solutions to reduce loading without
affecting farm productivity. Commonly implemented BMP’s include, soil, water,
irrigation, manure and integrated pest management also others like no till, buffer strip,
stream side grazing, cropland drainage, etc. (OMAFRA – Best management Practices,
2014). Service Ontario provides guidelines, manuals and assists farmers to implement
BMPs.
2.3.3 Pathogens
Microbes are present everywhere on earth; in water, soil, air and even within animal
bodies. Some microbes are beneficial for humans, but some are extremely dangerous for
human health. These harmful microbes are called pathogens, which if enter human body
14
by pathogens and impairment of water bodies raised critical water quality issues across
the globe. Pathogens are the leading cause of impairments in rivers and streams in USA,
contaminating 29% of impaired streams (USEPA, 2009). It prompted to determine the
sources, understand the survival, and transport processes of pathogens in different
environmental conditions.
2.3.3.1 Source
Various microbial species (bacteria, protozoa, fungi, virus, and algae) are considered as
pathogens. Among all pathogens the most frequently water polluting agents (Fecal
coliforms and E. coli) originate from fecal matter of human, animals and birds. It is
difficult and expensive to determine the concentration of all pathogens in diverse
environmental settings. Fecal coliform reside in warm blooded mammalian intestine and
do not survive in nature for long duration under normal circumstances, thus their
presence in surface or ground water is clear indication of fecal contamination. E. coli is
subset of fecal coliform whereas fecal coliforms belong to total coliform bacteria (Smith,
2000). Among all fecal coliforms, E. coli was selected and designated as indicator
bacteria (USEPA, 1999).
Most common sources include untreated sewage disposal, leakage from faulty septic
tanks, pets, livestock (cattle, horse, and pigs), wildlife (Deer, raccoon, opossum, striped
skunk, coyote, badger, bobcat, red fox, gray fox, swift fox, beaver, mink, muskrat, river
otter, spotted skunk, weasel, armadillo, woodchuck, and porcupine) and birds (turkey,
15
Municipal waste is point source of pathogens while septic tanks, manure application on
fields, wildlife, livestock grazing, and migratory birds constitute non-point sources.
Municipal waste water treatment plants generally treat sewage and disinfect it before
discharging to meet regulatory standards. According to MOE regulations, the E. coli
monthly geometric mean density in treated sewage waste water should not exceed 200
cfu/100 ml (Pileggi, 2008). Waste water from faulty septic tanks leaks to underground
water or to nearby drainage network infecting them with pathogens and resulting in
concentrations higher than regulatory standards. The microbes present in pets’ and other
animals’ feces in urban areas directly enters stream during runoff event, as most of the
water enters storm sewer in urban settings that discharge directly into stream or lake.
Livestock (beef cattle, swine, horses, sheep, turkey, chicken, ducks, goat, rabbit and
lamas) are reared in feedlots or on open pastures. Microbial contamination form grazing
operations are spread across the pasture. Stream also receives direct microbial loadings
from animals, when they come in direct contact with stream for drinking or wallowing.
Feces generated from intensive livestock operations (ILOs) or confined feeding
operations (CFOs) are generally stored at site and later spread on fields in the form of
manure. The microbial concentration in manure increases or decreases based on moisture
condition, temperature and exposure to solar radiation.
Wild animals and birds dwell in forest, urban and agricultural areas. They also constitute
non-point source microbial loadings. Some animals like beavers, muskrats, waterfowls,
Canada geese, ducks, etc., that inhabit near streams contribute towards microbial loading
more than other animals living on land areas. Migratory birds also have significant
16
naturalized E. coli species which exist in soil. They also enter stream during baseflow and
runoff events. It is difficult to determine the percentage of animal released and
naturalized E. coli in water by normal tests.
2.3.3.2 Growth, Survival and Decay
Fecal coliform and E. coli proliferate inside the intestines of warm blooded animals but
their ability to survive in manure, soil, groundwater, river and sediments is limited. Their
survival depends on moisture, temperature, competition, natural predation, solar
radiation, soil, pH, nutrient, and organic matter. But nutrient availability, temperature,
competition, and predation seem to be the most influential factors governing pathogen
survival in nature (Bition and Harvey, 1992 and Jamieson et. al., 2002). The growth
follows zero order growth kinetics, while death follows first order decay kinetics.
Manure:
Kudva et. al. (1998) discovered that E. coli in ovine manure can survive under natural
conditions for 21 months and its concentration ranged from 102 to 106 CFU/g prolonged
periods in incubated manure without aeration but it was still lower than natural
conditions. Van Kessel et. al. (2007) compared microbial concentration in cowpats under
laboratory and field conditions and observed higher decay rate under shaded field
conditions. Concentration of E. coli and fecal coliforms first increased and then declined
afterwards.
Jiang et. al. (2002) tested the fate of E. coli O157:H7 in manure amended soil and
survival ranged between 77 to 231 days. E. coli in non-autoclaved manure amended soil
17
competition from indigenous microbes were discovered to be contributing factors. Franz
et. al. (2011) also checked E. coli O157 survival in manure amended soil from animal,
food and human isolates. They found out the survival range varied from 47 to 266 days
and isolates from human showed significantly prolonged survival (median 211 days) than
animal isolates (median 70 days).
Himathongkham et. al. (1999) conducted a study to determine the time required under
different temperatures to hold the manure before applying to field. The inactivation rate
corresponded to first order reaction with decimal reduction times. Pathogens survived
longest at 4°C and survival time kept on decreasing at elevated temperature ranges. It was
suggested to store the manure for 105 days at 4°C while 45 days at 37°C for achieving
105 fold reduction. Temperature, solid content, microbial content, pH,
oxidation-reduction potential and time were found to influence the survival.
Soil:
After manure application, E. coli attach to soil particles and foliage preferentially. E. coli
showed 3.9 times attachment preference to soil particles between diameter 16 – 30 µm.
They also leach to lower soil layers, groundwater and tiles during rainfall event (Oliver et
al., 2007 and Fenlon et. al., 2000). E. coli growth depends on moisture conditions of soil.
At 57% moisture level, slight growth was observed, while at 25% microbes only
persisted whereas at 4% they died (Gallagher et. al., 2012).
Brennan et. al. (2010) performed lysimeter tests and determined the persistence of E. coli
18
autochthonous E. coli can become naturalized under low temperature conditions.
Preferential flow was observed to be significant transport factor in soil.
E. coli growth and survival is directly correlated with organic content and temperature.
Growth was observed at low temperatures while elevated temperatures prompted cell
death. Lower organic concentrations resulted in decay, where higher organic content
promoted survival even at elevated temperature (Melek, 2012). Sjogren (1994) concluded
that E. coli can survive for extended period of 23.3 months under pH 6.8 – 8.3, 5°C
temperature and saturated moisture conditions. Jamieson et. al. (2002) also confirmed
that most suitable pH value lies between 6 and 7.
E. coli concentration values higher than regulatory standards in groundwater and tile
drained water were observed in several studies (VanderZaag et. al., 2010, Jamieson et.
al., 2002 and Moreno, 2003). Common manure application on fields results in significant
transfer of pathogens to sub-surface water during irrigation and precipitation event. It
also provides suitable moisture conditions for microbial growth.
Protozoan grazing especially by amoeba significantly reduces E. coli in soil after manure
application. Peak concentration reached 2 - 4 days after manure application, but abrupt
decrease was observed following that period with simultaneous increase in amoeba
concentration, reaching its peak after 7 days. It was attributed to the flexible shape of
amoeba allowing it to enter into soil pores and feed on hidden bacteria (Enzingeri and
19
Water:
Pathogens readily perish upon exposure to aquatic environment. Physiochemical factors
(temperature, exposure to UV light, pH, heavy metals, and ion concentration),
competition, bacteriophage, and flagellate predation in freshwater wreak havoc on their
population (Sanders and Porter, 1986and McCambridge and McMeekin, 1981).
Size selective preferential grazing behavior of micro flagellate towards E. coli was
apparently the major factor in bactericidal activity. Bacteriophage effect was not that
significant whereas indigenous micro flora and nutritional availability enhanced the
survival rate of pathogens (Wcisło and Chróst, 2000). Salinity has deterrent effect on
microbial survival (Anderson et. al., 2005). Temperature plays an important role in
controlling microbial concentration but at lower temperature of 4°C at the bottom of
water body promote bacterial survival. Microbes can survive long winter in bed
sediments (An et. al., 2002).
Pathogens tend to attach to sediments and settle down on bed along with sediments. As
compared to water column, sediments provide safe harbour to pathogens. They survive
for longer duration in sediments than in water (Craig et. al., 2004). Their concentrations
vary broadly in sediments from different sources as well as at different locations within
same water body (Pachepsky and Shelton, 2011). Under controlled conditions, replicated
sediment samples showed higher variability as compared to water samples (Anderson et
al., 2005). No correlation between concentration in sediment and water exist during
baseflow. During storm event major contribution is from land loading (Pachepsky and
Shelton, 2011). Coarse sediments do not provide enough protection from protozoan
20
Clay particles provide more protection and enhance their survival (Roper and Marshall,
1974). Significant direct relation was confirmed between microbial concentration and silt
and clay particles percentage in sediments (Atwill et. al., 2007). Proximity to source has
also significant impact on pathogen concentration in sediment (Bergstein-Ben Dan and
Keppel, 1992).
2.3.3.3 Transport
Pathogens from soil are carried to stream along with surface runoff during precipitation
event. They also get transported to lower layers of soil, groundwater and tile drainage by
migration along with percolating water. In stream they are carried further to longer
distances. Temperature, soil type, sediment size and type, macropores in soil, manure,
and solar radiation have been found to impact transport of pathogens in surface, ground
water, tiles, and stream (Jamieson et. al., 2002).
Surface Transport:
Advective flow on overland surface is responsible for transporting pathogens to streams.
They are transported as free suspended particles and attached to soil particles or manures.
More fecal coliforms attach to clay and silt particles than sand. But with the application
of manure microbial fraction attaching to clay and silt reduce significantly but fraction
attaching to sand decreases only slightly (Guber et. al., 2007). Field scale study showed
application of manure to different land uses (pasture, cultivated and mixed land use) did
not affect E. coli loading to runoff significantly. But grazed sites were observed to have
21
Sub-surface Transport:
Significant microbial transport in intact soil occurs through macropores instead of soil
capacity (Smith et. al., 1985). Negligible amount of microbes are present as free cells but
mostly get attached to soil particles or agglomerate to form clumps (Reddy et al., 1981,
Abu-Ashour et. al., 1998 and McDowell-Boyer et. al., 1986). They clog the soil pores
while passing through them and form biofilms. Filtration is dominant in E. coli removal
process when soil particle diameter is below 0.02 mm (Foppen and Schijven, 2006). But
in freeze-fractured clay after several freeze thaw cycles, this filtration capability is
reduced to some extent (Rosa et. al., 2010). During passage of E. coli through soil, they
get adsorbed to soil. Soils having higher clay content have higher microbial adsorption
capacity as compared to soils with lower clay content (Ling et. al., 2002).
Tile Drainage:
Pathogen transport to tile drainage system has been observed under all manure types and
different application methods. Soil water content during manure application and
precipitation within two to three weeks after application are most significant factors that
contribute towards migration of pathogens into tiles. Manure application should be
restricted when tiles are flowing (Jamieson et. al., 2002). Sub-surface manure application
reduces the bacterial loss in surface runoff, but increase the contamination of tile flow
and ground water (Crane et. al., 1983 and Warnemuende and Kanwar, 2000). Macropores
developed by earthworm, insects, burrowing and cracking of clay soils during summer
are responsible of majority of E. coli transfer (Jamieson et. al., 2002). Within the tile
majority of microbes migrate as sediment attached particles instead of freely suspended
22
Tile drainage has been observed to significantly contribute pathogen loadings to stream.
Moreno (2002) observed 1.2 X 10⁶ CFU/100ml peak concentration in tile drained water
resulting from precipitation and irrigation. Fall (2011) also observed higher E. coli levels
in streamflow when tile drainage was active indicating significant contribution of tile
flow towards pathogen loading.
In-Stream Transport:
Stream receives microbial loadings from direct depositions, surface runoff, ground water
and tile flow. Bacterial Water Quality Model (BWQM) developed for Salmon River
watershed in British Columbia, Canada, predicted 70 – 80 % of fecal coliform loadings
originated from snow melt surface runoff; while 20 – 30 % came from lateral flow (Zhu
et. al., 2011). Within stream microbes are transported by advection, dispersion and
sediment adsorbed suspension – resuspension processes (Jamieson et. al., 2004).
Bed stream sediments act as safe microbial reservoir, where they hide from predators,
survive during harsh climate conditions, proliferate and re-enter in water column during
sediment resuspension. Artificial flood experiments conducted in New Zealand revealed
the occurrence of E. coli peak during rising limb of hydrograph. It was attributed to bed
and bank sediment associated E. coli resuspension during turbulent rising limb as E. coli
peak coincided with total suspended solids turbidity peak (Nagels et. al., 2002 and
Muirhead et. al., 2004). This observation was further confirmed by Davis-Colley (2007),
that early peak of E. coli during storm is due to sediment resuspension instead of
contribution from surface runoff. Further (Cinotto, 2005) found that point sources do not
23
supply of microbes as E. coli peak receded during the rising limb of storm hydrograph
(Henson et. al., 2007 and Jamieson et. al., 2005b).
Higher E. coli concentrations were observed during two storm events after long drought,
but not after third storm event in Southern California by Evanson and Ambrose (2006). It
was concluded that E. coli was washed away during first two storm events and microbes
didn’t get enough time to regenerate during third event. Fecal coliform concentration
increases in estuary during fresh water flow because microbes desorb from benthic
sediments at reduced salinity (Erkenbrecher, 1981 and Roper et. al., 1974).
Free cell settling rate is very low 1.6 m/day (Cizek et. al., 2008), whereas sediment
associated microbial settling is fast due to higher density of sediment particles (Gannon et
al., 1983). For determining sediment associated microbial settling; estimate of microbes
attached to sediments is required. Researchers have contrasting view about these
attachment fractions (Pachepsky and Shelton, 2011). Schillinger and Gannon (1985),
Atwill et al. (2007), Jamieson et al. (2005b), and Jeng et al. (2005) estimated 16%, 10%,
20 – 44%, and 20 – 30% of microbes attached to sediments respectively while Auer and
Niehaus (1993) estimated 90% bacterial association with sediments. These contrasting
results might have resulted from different enumeration techniques applied. Commonly
used enumeration techniques include filtration, fractional filtration, and centrifugation
also various other physical and chemical dispersion techniques have been applied to
disassociate sediment attached microbes (Soupir et. al., 2008).
The effect of suspended solids concentration on microbial attachment percentage is not
24
with their concentration as represented by equation 2.2. Various researchers observed
strong and weak relationships between E. coli concentration and turbidity also with total
suspended solids concentration. Linear dependence is most common assumption;
S = Kd C Equation 2.2
Where: S is Amount of microorganisms associated with solid particles, CFU/g, C is
Concentration in runoff, CFU/g, and Kd is Partitioning coefficient
Kd is related to Clay content of sediments by equation 2.3 (Ling et. al., 2003 and
Pachepsky et. al., 2006)
Kd = A * CLAYB Equation 2.3
Where: CLAY is Percentage of clay particles < .002 mm in soil, A and B are Slope and
the intercept of the regression in log-log coordinates
It’s extremely difficult to divide resuspended sediment attached bacteria into free floating
and sediment attached. Most of the resuspended particles exist in form of few large flocks
(Pettibone et. al., 1996).
2.4 Model Description
Hydrological system is governed by a large number of processes within a watershed. It is
impossible to consider and simulate every single process. The main focus of water budget
analysis is to ascertain the amount of water entering the system should be equal the
amount of water leaving the system in order to make sure that all processes are accounted
25
components of the hydrologic system at the watershed and sub-watershed scale can be
quantified for making water management decisions.
2.4.1 Types of models
Empirical, numerical and analytical modeling approaches are commonly applied to
simulate natural processes. Empirical models estimate output from observed input and
output relationships instead of evaluating individual processes that regulate the overall
system. A numerical model estimates approximate physical processes of complex system
by solving governing equations. Analytical models calculate governing equations for
simple homogeneous systems. In hydrology, where parameters vary spatially and
temporally, the numerical modeling approaches are more suitable.
Lumped models and physically based models are frequently employed in performing
water budget analysis. A lumped parameter model assumes that for large systems
parameters average values could be used to represent processes. Lumped parameter
models do not give priority to spatial position for estimating values for different
processes. On the other hand, a physically based model considers spatial position and is
based on fundamental physical principles. They require extensive observed data to
determine the cause and effect relationship of system processes and behavior.
Due to complexity of hydrological processes at watershed level, three basic numerical
modeling techniques are implemented.
Groundwater models: They are used to determine groundwater levels, recharge
discharge pathways and groundwater-surface water interactions resulting from changes in
26
interactions. Groundwater numerical models are generally used to evaluate changes in the
steady-state water budget.
Surface water models: Surface water models are used to estimate runoff, peak flows,
evaporation, transpiration, and infiltration due to changes in climate, land use, surface
water storage and removal, wetland modifications, storm water management and flow
diversions. They are also used to predict flood lines, sediment loss due to erosion, and
water quality based on assessed flows.
Integrated continuum models: In Integrated models, surface water and groundwater
equation are assumed to be integral part of larger system and they are solved
simultaneously but climate processes are simplified. The conjunctive models are mostly
physically based models.
2.4.1 Model Selection
Model selection is based on type of water budget analysis requirement and dominant flow
processes i.e. surface water or groundwater in study area. If groundwater discharge
significantly impacts the streamflow, then the complex groundwater processes should be
considered while modeling. On the other hand if surface runoff dominates the water flow
in watershed then modeling should be focused on simulating complex surface water
processes.
2.4.2 Current available models
Various researchers explored and compared different aspects of hydrological modeling.
Main software tools include Object-Oriented Guelph All Weather Storm Event Runoff
27
(Bicknell, et. al. 2000), Storm Water Management Model - SWMM, (Donigian and
Huber, 1991), Soil and Water Assessment Tool - SWAT (Arnold et. al., 1998, Arnold et.
al., 2005, and Neitsch et. al., 2004), QUALHYMO (UserManual, 2009), Agricultural
Non-Point Source - AGNPS (Finn et. al., 2003), Hydrologic Engineering Center –
Hydrologic Modeling System - HEC-HMS (Scharffenberg and Fleming, 2010),
Precipitation Runoff Modeling System - PRMS (Leavesley et. al., 1983), Watershed
Modeling System - WMS (Dellman et. al., 2002), Areal Non-point Source Watershed
Environment Response Simulation - ANSWERS (Dabral and Cohen, 2001), Modular
finite difference ground-water flow model – MODFLOW (USEPA, 1993), Finite element
sub-surface flow and transport simulation system – FEFLOW (DHI WASY, 2013), Mike
SHE (DHI Software, 2007), InHM (Ebel et. al., 2007), HydroGeo Sphere (Brunner and
Simmons, 2012), Coupled ground-water and surface-water flow model - GSFLOW
(Markstrom et. al., 2008), Loading Simulation Program in C++ - LSPC, (Tetra Tech Inc.
and USEPA, 2002), Watershed Assessment Model - WAM, (SWET, 2006), Watershed
Analysis Risk Management Framework - WARMF (Chen et. al., 1999), MWASTE
(Moore et. al., 1989), Coli (Walker et. al., 1990), a model developed by Dorner et. al.
(2004a). Important modeling characteristics and capabilities of these models are
28
Table 2. 2: Hydrological Model Comparison
Model Type
Lumped parameter vs Physically Distributed Sediment Routing Pollutant Routing Tile Drainage Bacteria Routing GAWSER Surface Water Lumped Physical Distributed
No No No No
HSPF Lumped Yes Yes No Yes
SWMM Lumped Yes Yes No Yes
SWAT Lumped
Physical Yes Yes Yes Yes
QUALHYMO Lumped Yes Yes No No
AGNPS Physical
Distributed Yes Yes No No
HEC-HMS Physical No No No No
PRMS Distributed No No No No
WMS Process
based Yes Yes No Yes ANSWERS Distributed Yes Yes No No
MODFLOW Ground water 3-D Physical Finite Difference
No No Yes No
FEFLOW
3-D Physical
Finite Difference
Yes Yes Yes No
MIKE SHE Conjunctive 3-D Physical Finite Difference
Yes Yes Yes Yes
InHM
3-D Physical
Finite Difference
Yes Yes Yes No
HydroGeo-Sphere 3-D Physical Finite Difference
Yes Yes Yes Yes
GSFLOW
3-D Physical
Finite Difference
29
Hydrological Simulation Program FORTRAN - HSPF was developed in the early 1960's
as the Stanford Watershed Model and later in 1970's, water-quality processes were added.
FORTRAN was incorporated in the late 1970's. Pre-processing and post-processing
software, algorithm enhancements and use of the USGS WDM system were developed
jointly by the USGS and EPA in 1980’s.
HSPF simulates the water quality on pervious and impervious land surfaces and in rivers
and well-mixed water bodies. It uses continuous precipitation and other meteorological
records to estimate streamflow hydrographs and model the contaminant concentrations. It
simulates interception soil moisture, evapotraspiration, surface runoff, baseflow,
interflow, snowmelt, depth of snowpack and its water content, ground-water recharge,
temperature, pH, organic phosphorus, orthophosphate, ammonia, organic nitrogen,
nitrite-nitrate, sediment transport & detachment also its routing based on size of particle,
pesticides, conservatives, dissolved oxygen, biochemical oxygen demand, phytoplankton,
zooplankton, fecal coliform, channel routing, reservoir routing and constituent routing.
HSPF can simulate one or many unit areas discharges into one or more streams or
reservoirs. Any time interval ranging from one minute to one day which divides equally
into one day can be used and any period from a few minutes to hundreds of years can be
modeled. It is mostly used to assess the effects of change in land use, point and nonpoint
source treatment alternatives, flow diversions, reservoir operations (Bicknell et. al.,
2001).
Loading Simulation Program in C++ (LSPC) is a process based model that can simulate
hydrological, sediment, nutrient, pollutant, and bacteria transport processes on land, in
30
is not incorporated in LSPC. It also demands extensive data for calibration, and expertise
knowledge and significant time for modeling (Shoemaker et. al., 2005).
SWMM model is widely applied in urban sewer networks for analyzing surface runoff
and flow routing by simulating surface and groundwater, stream routing, pollutant and
bacteria transport. Individual storm or long duration simulations can be performed
(Donigian and Huber, 1991). WMS is a process based model which includes surface and
groundwater, and nutrient and bacteria transport components. But it doesn’t include tile
drainage module (Dellman et. al., 2002).
SWAT is a process based model which predicts the impact of climate and land
management practices on hydrology, sediment, nutrients and microbial transport in
surface runoff, groundwater, tile flow and streamflow (Gassmann et. al., 2007 and Du et.
al., 2005). It can simulate results on daily, monthly and annually basis but cannot be used
for single storm event. SWAT has been used extensively to model water budget and
non-point source pollution (Shoemaker et. al., 2005 and Parajuli et. al., 2007).
Agricultural Nonpoint Source (AGNPS) pollution model of watershed hydrology was
developed by U.S. Department of Agriculture (USDA) for solving complex problem
related to managing nonpoint sources of pollution primarily from agricultural areas.
AGNPS simulates the behavior of runoff, sediment, and nutrient transport from
watersheds but doesn’t include equations for bacterial transport and tile drainage flow
(Finn et. al., 2003).
HEC-HMS can be used independently or in conjugation with other models to determine