ABSTRACT
EWING, KATHERINE ANNE. Estimating the Effectiveness of Special Education Using Large-Scale Assessment Data. (Under the direction of Ann C. Schulte, Ph.D.).
The inclusion of students with disabilities in large scale assessment and
by
Katherine Anne Ewing
A dissertation submitted to the Graduate Faculty of North Carolina State University
In partial fulfillment of the Requirements for the degree of
Doctor of Philosophy
Psychology
Raleigh, North Carolina 2009
APPROVED BY:
_______________________________ ______________________________
Dr. Ann Schulte Dr. Jeffery Braden
Committee Chair
________________________________ ______________________________
BIOGRAPHY
Katie was born in Indianapolis, Indiana on June 21, 1980 to Mark and Janet Raker. After graduation from Brebeuf Jesuit Preparatory School in 1998, she attended Miami University in Oxford, Ohio. In December 2001, she graduated Magna Cum Laude with a Bachelor of Arts and Departmental Honors in Psychology. Her Honors thesis, “Personality traits and social anxiety: Understanding comorbidity within a non-clinical, college population,” was written under the direction of Dr. Mia Biran.
She began her graduate study in Psychology at Wake Forest University in Winston-Salem, North Carolina, from which she graduated Magna Cum Laude with a Masters of Arts in May 2004. She completed her Master’s thesis, “Do parents matter? An examination of parental attitudes and involvement as predictors of children’s social success within integrated and general education preschools,” under the direction of Dr. Deborah Best. Katie then enrolled in the doctoral School Psychology program at North Carolina State University in Raleigh, North Carolina. She will complete her degree requirements in August 2009 and graduate Summa Cum Laude in December 2009.
ACKNOWLEDGMENTS
I want to thank my advisor, Dr. Ann Schulte, for the time and energy she has dedicated to my research project, as well as my professional development, over the past 5 years. Her guidance and support have helped me grow as a researcher, a writer, and a school psychologist. I would also like to thank Drs. Jeffery Braden, Atsushi Inoue, and Adam Meade for their input regarding my statistical procedures. Thank you to Drs. Jeffery Braden, William Erchul, and Susan Osborne for their feedback regarding my research and their participation in my preliminary examinations and my dissertation proposal and defense meetings.
I would like to thank Dr. Steven Rivkin for providing additional information about his 1998 and 2002 research with Drs. Hanushek and Kain, in order to help me replicate their procedures to the best of my abilities. I would like to thank the researchers at the North Carolina Education Research Data Center at the Center for Child and Family Policy at Duke University who made it possible for me to pursue this project by
TABLE OF CONTENTS
LIST OF TABLES ... vii
LIST OF FIGURES ... ix
CHAPTER ONE ... 1
Introduction ... 1
CHAPTER TWO ... 5
A Review of the Literature ... 5
Access and Outcomes: An Historical Perspective on Special Education ...5
Moving From Exclusion From Schools to Inclusion Within the Classroom ... 5
Classic Special Education Outcomes Research ... 9
The “Special” in Special Education ... 15
Preparing for Change ... 16
Standards-Based Reform and its Implications for Special Education ...22
The Standards-Based Reform Movement ... 23
Moving From Inclusion in the Classroom to Inclusion in Large-Scale Assessments ... 24
The Use of Large-Scale Assessments for Students With and Without Disabilities ... 27
Intended and unintended outcomes of high-stakes assessments ... 27
State-level accountability for students with disabilities ... 30
The use of accommodations on large-scale assessments. ... 31
Attitudes regarding the use of large-scale assessments for students with disabilities ... 36
Old Question, New Methodology ...38
Hanushek et al.’s Use of Large-Scale Assessments to Evaluate Special Education ...42
Research Participants ... 42
Research Analyses and Results ... 42
Normalized TAAS scores ... 42
Value-added analyses... 43
Eliminating fixed effects. ... 44
Differenced scores. ... 44
Estimating special education effectiveness. ... 45
Results of the differenced regression analyses. ... 46
Examining potential biases. ... 49
Why This Research Was Influential ... 49
The Need to Replicate and Extend This Research ... 52
CHAPTER THREE ... 55
Research Aims ... 55
Statement of the Problem ...55
Hypotheses ...57
Hypothesis 2... 57
Hypothesis 3... 58
CHAPTER FOUR ... 60
Method ... 60
Study Overview ... 60
Participants ... 60
Measures ... 62
EOG Test of Reading Comprehension. ... 63
EOG Test of Mathematics ... 65
Procedure ... 66
Test administration... 66
Determination of special education status. ... 69
School characteristics... 70
CHAPTER FIVE ... 71
Results ... 71
Descriptive and Preliminary Analyses ...71
Merging Data Across Cohorts ... 72
Normalizing Raw Test Scores and Calculating Gain Scores ... 73
Creating Residualized Gain Scores ... 73
Creating Differenced Scores ... 83
Gain scores. ... 83
Residual gain scores. ... 83
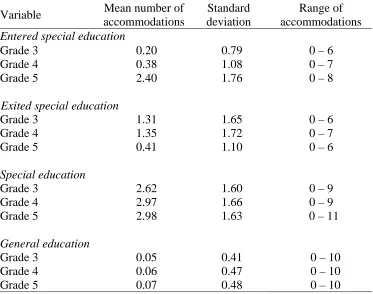
Accommodation changes ... 83
Special education status changes. ... 84
Adding School-Level Demographic Data ... 85
Regression Analyses to Test the Hypotheses...86
Hypothesis 1... 86
Hypothesis 2... 94
Hypothesis 3... 99
Controlling for accommodation use. ... 99
Excluding students who received accommodations. ... 104
Summary of Hypothesis Testing ... 108
CHAPTER SIX ... 111
Discussion ... 111
Special Education Entry as a Significant Predictor of Achievement Growth ...113
Hypothesis 1... 114
Hypothesis 2... 116
Hypothesis 3... 119
Controlling for accommodation use. ... 120
Excluding students who received accommodations. ... 121
General Discussion ...122
Improving reading and math achievement ... 123
Improving achievement for students with different disabilities ... 125
Improving achievement beyond the effects of accommodation use ... 130
Limitations ...132
Research Design ... 132
Use of Normalized Scores ... 133
Not Controlling for School Changes... 133
Sample Representativeness ... 134
Missing Data ... 135
Test Changes ... 138
Directions for Future Research ...139
Research Design ... 139
Further Examination of Data ... 141
Implications for Practice ...142
Closing the Achievement Gap ... 142
Funding Special Education Programming ... 144
Utilizing Evidence-Based Interventions ... 145
LIST OF TABLES
Table 1. Placement of Students by Group and Year ... 47 Table 2. Demographic Characteristics of the Study Sample ... 62 Table 3. The Percent of Students Who Used the Five Most Commonly Provided
Accommodations, by Group and Year... 68 Table 4. Students’ Use of Accommodations by Group ... 69 Table 5. Correlations Used to Compute Residual Gain Scores ... 74 Table 6. z-Score Means and Standard Deviations for Students Entering Into
Special Education by Cohort and Across All Cohorts ... 76 Table 7. z-Score Means and Standard Deviations for Students Exiting Out of
Special Education by Cohort and Across All Cohorts ... 77 Table 8. z-Score Means and Standard Deviations for Students Consistently in
Special Education Programs by Cohort and Across All Cohorts ... 78 Table 9. z-Score Means and Standard Deviations for Students Consistently in
General Education Programs by Cohort and Across All Cohorts ... 79 Table 10. z-Score Means and Standard Deviations for Students Entering Into
Special Education by Disability (Across All Cohorts) ... 80 Table 11. z-Score Means and Standard Deviations for Students Exiting Out of
Special Education by Disability (Across All Cohorts) ... 81 Table 12. EOG Test Participation Rates by Cohort and Across All Cohorts ... 82 Table 13. Mean Differenced Gain Scores, Differenced Residual Gain Scores,
and Differenced Accommodations Use by Group ... 84 Table 14. Regression Analyses Predicting Differenced Gain Scores for All
Transitioning Students ... 89 Table 15. Regression Analyses Predicting Differenced Gain Scores for Students
Entering or Exiting Special Education Programs ... 90 Table 16. Regression Analysis Predicting Differenced Gain Scores for Students
With SLD, SLI, BED, or OHI in the Area of Reading Comprehension ... 92 Table 17. Regression Analysis Predicting Differenced Gain Scores for Students
With SLD, SLI, BED, or OHI in the Area of Mathematics ... 93 Table 18. Regression Analyses Predicting Differenced Residual Gain Scores for
Students Entering or Exiting Special Education Programs ... 96 Table 19. Regression Analysis Predicting Differenced Residual Gain Scores for
Students With SLD, SLI, BED, or OHI in the Area of Reading ... 97 Table 20. Regression Analysis Predicting Differenced Residual Gain Scores for
Students With SLD, SLI, BED, or OHI in the area of Mathematics ... 98 Table 21. Regression Analyses Predicting Differenced Residual Gain Scores
After Controlling for Accommodation Use ... 101 Table 22. Regression Analysis Predicting Differenced Residual Gain Scores for
Students With SLD, SLI, BED, or OHI in the Area of Reading After
Table 23. Regression Analysis Predicting Differenced Residual Gain Scores for Students With SLD, SLI, BED, or OHI in the Area of Mathematics After Controlling for Accommodation Use ... 104 Table 24. Regression Analyses Predicting Differenced Residual Gain Scores for
Students Who Did Not Receive Accommodations ... 106 Table 25. Regression Analysis Predicting Differenced Residual Gain Scores for
Students With SLD, SLI, BED, or OHI Without Accommodations in
the Area of Reading ... 107 Table 26. Regression Analysis Predicting Differenced Residual Gain Scores for
Students With SLD, SLI, BED, or OHI Without Accommodations in
LIST OF FIGURES
Figure 1. The number (in millions) of students receiving special education services in the U.S. ... 19 Figure 2. The proportion of students receiving special education services in
the U.S... 20 Figure 3. The number (in millions) of students receiving special education services
Concern over the quality of education provided for children with disabilities has been present for centuries. However, a lack of sufficient evidence exists to determine whether current special education programs result in academic achievement gains for students with disabilities. The current paper will provide a review of previous research and legislation regarding the education of students with disabilities followed by the results of a study that utilized a new methodology for examining outcomes for such students.
Throughout the 1980s and 1990s, researchers have examined the outcomes for students with disabilities and tried to pinpoint what makes special education “special” (e.g., Fuchs & Fuchs, 1995). Some of this research examined the effectiveness of special education as a program, and other research specifically examined the effectiveness of different placement options (e.g., segregated classrooms, resource programs, full inclusion). Thus, the emphasis in special education research has changed from access to outcomes for students with disabilities.
Next, an examination of the participation of students with and without disabilities in large-scale assessments is provided. Specifically, the consequences of large-scale assessments for students with and without disabilities, the inclusion of students with disabilities in accountability reports, the use of accommodations for students with disabilities, and the attitudes of teachers and parents regarding the inclusion of students with disabilities in large-scale assessments is summarized in this section. Additionally, the few research studies that have begun to use large-scale assessment data as outcome variables in special education research are briefly reviewed (e.g., Schulte & Villwock, 2004; Ysseldyke & Bielinski, 2002). Chapter Two concludes with a more detailed summary and critique of a study by Hanushek, Kain, and Rivkin (1998), which evaluated the effectiveness of special education programs in Texas by longitudinally analyzing students’ gain scores on a large-scale assessment of student achievement.
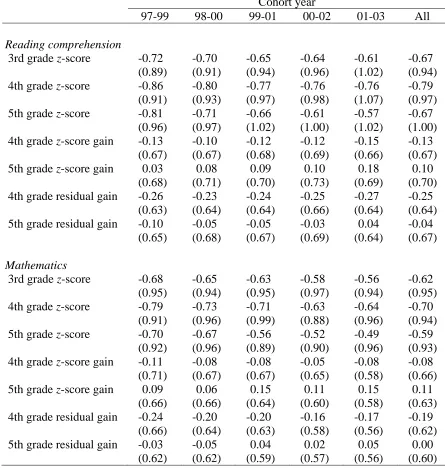
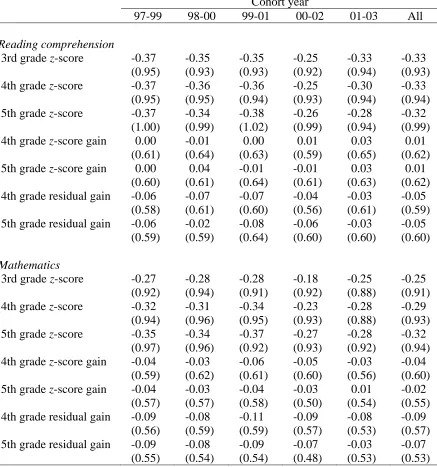
As is demonstrated in Chapters Three and Four, the current study aimed to replicate and extend Hanushek et al.’s (1998) research using large-scale assessment data for students with disabilities in North Carolina. Three years of End-of-Grade (EOG) Reading Comprehension and Mathematics Tests scores from 396,828 students from five cohorts were analyzed in order to estimate the effectiveness of special education
programs in the state of North Carolina. The current study intended to increase the external validity of Hanushek and colleagues’ results by replicating their findings within another state. It was also intended to extend their research by considering two additional factors that may have affected their results: (a) regression to the mean, and (b) the use of accommodations by students with disabilities during their participation in large-scale assessments.
The results of this study are presented in Chapter Five. Multiple regression analyses provided additional support for Hanushek and colleagues’ (1998) findings that entering into special education programs improves the achievement scores of students with disabilities. Gains upon entrance into special education programs were found even after controlling for regression to the mean and the use of test accommodations. Chapter Six provides a discussion of these results within the context of previous research,
CHAPTER TWO A Review of the Literature
Access and Outcomes: An Historical Perspective on Special Education
One of the most longstanding, controversial issues in education involves how to educate students with disabilities appropriately. Initially, these children were completely excluded from the formal education system. Over time, however, students with
disabilities have moved from being educated within separate schools to being educated within separate classrooms to being educated within a general education classroom as much as possible. Throughout this progression, questions regarding the education of students with disabilities have shifted from ones of access to ones of effectiveness. The following section will (a) describe this progression for the education of students with disabilities, and (b) summarize classic research regarding the effectiveness of special education programs.
Moving From Exclusion From Schools to Inclusion Within the Classroom In the early 19th century, most children with severe mental and physical
compulsory education laws for children; however, children with disabilities determined to be “uneducable” were still excluded from school (McDonnell et al.). Even when students with disabilities were granted access to a formal education, they continued to be segregated from students without disabilities and educated within self-contained, special schools. Students with disabilities have only routinely been provided with a formal education in separate, special classrooms since the mid-1900s (Dunn, 1968). Thus, from the early 1800s through the mid-1900s, the initial exclusion of students with disabilities from the formal education system was gradually replaced with access to education, first within segregated schools and later within segregated classrooms.
be educated. This cascade system resembles the currently-used continuum of placement alternatives for students with disabilities that stemmed from legislative mandates in the 1970s.
Beginning in the early 1970s, a variety of legislative mandates changed the way in which students with disabilities were educated. First, two important federal court cases ruled against school districts for continuing to exclude students with disabilities. In 1971, in Pennsylvania Association of Retarded Children (PARC) v. Commonwealth, the court ruled that schools had the responsibility to enroll children with mental retardation. In 1972, in Mills v. Board of Education, the court ruled that a school could not exclude students with disabilities due to a lack of funding (Gartner & Lipsky, 1987; Huefner, 2000). Then, the Rehabilitation Act of 1973 prohibited public and private organizations receiving federal funding from discriminating against individuals with disabilities. This act stemmed from the Civil Rights movement and had implications for all persons with disabilities; however, it specifically prohibited schools from discriminating against students with disabilities (Schulte, Osborne, & Erchul, 1998). These initial mandates aimed to include higher numbers of students with disabilities in the formal education system; however, in 1972, only 40% of students with disabilities were being provided educational services (McDonnell et al., 1997).
disabilities be given a free appropriate public education (FAPE) based on an
Individualized Education Plan (IEP). It also supported the earlier notion proposed by Dunn (1968) and Deno (1970) that students with and without disabilities should be educated together. Specifically, students with disabilities were required to be educated within the least restrictive environment (LRE) possible among a continuum of placement alternatives (Huefner, 2000; Kavale & Forness, 2000; Schulte et al., 1998). The LRE mandate led to the mainstreaming of many students with disabilities in general education classrooms with their non-disabled peers. According to Osborne and Dimattia (1994), relevant court decisions following the original IDEA mandate “clearly indicate that an inclusionary placement must be the placement of choice and that a student with
disabilities may be excluded from a general education setting only in the face of strong evidence that the student cannot be satisfactorily educated in that setting” (p. 12).
(e.g., self-contained classrooms, resource rooms) became increasingly important. Indeed, much of the focus in special education policy discussions shifted from ensuring that students with severe disabilities had access to a formal education to examining the outcomes for students with a wide range of disabilities within special education programs.
Classic Special Education Outcomes Research
disabilities in an absolute sense, these programs could not sufficiently close the achievement gap between students with and without disabilities (Shinn, 1986).
Carlberg and Kavale’s (1980) meta-analysis was one of the first studies to provide a comprehensive examination of the outcomes for students with disabilities in a variety of education settings. Their meta-analysis revealed that placement in a special class had an overall effect size of -0.12. This finding resulted in special class placement being listed as one of five “interventions that don’t work,” (along with social skills training, modality instruction, the Feingold Diet, and perceptual training) in a later publication (Forness, Kavale, Blum, & Lloyd, 1997). In more specific analyses regarding the placement of students with different types of disabilities, Carlberg and Kavale found that the effect size of special class placement for students with more severe disabilities was larger than the effect size of special class placement for all students with disabilities combined. For example, the effect size for special class placement for students with mild mental retardation (i.e., they had a standardized IQ score between 50 and 75) was -0.14 and for students considered to be slow learners (i.e., they had a standardized IQ score between 75 and 90), -0.34. However, for students with less severe cognitive disabilities (i.e., learning disabilities or behavioral/emotional disorders), special education placement was more beneficial (effect size = 0.29) than placement within the general education classroom. Overall, this complex meta-analysis demonstrated that, on average, groups of students with a variety of disabilities do not benefit from special education placement. However, students with mild disabilities were more likely to benefit from special education
McLeskey (2004) identified the 50 most frequently cited articles in special education between 1960 and 1996 and labeled them “classic” articles that have shaped the field. At the time of McLeskey’s publication, Carlberg and Kavale’s meta-analysis had already been cited over 100 times, making it one of the most influential, classic studies
examining outcomes for students with disabilities.
Similarly, Maddin and Slavin (1983) reviewed previous studies examining both academic and social outcomes for students with mild handicaps. They concluded that much of the early research conducted during the 1950s and 1960s regarding the
effectiveness of special education in terms of academic outcomes (which demonstrated no difference between placements) was not methodologically valid. However, even the later, methodologically sound studies generated mixed results regarding academic outcomes. Some revealed that general education was more beneficial than special education; others showed no differences between programs. These authors drew the following tentative conclusions regarding academic achievement outcomes for students with mild disabilities: (a) when individualized instruction is utilized within the general education classroom, the achievement of students with disabilities is higher than when they are educated within special education classes; (b) the effectiveness of general education class placement depends on the alterations to the program in that classroom; and (c) the evidence regarding the effectiveness of part-time resource room placement is unclear.
general education was not reduced over this same time period. In fact, for students in many of the upper grades, the discrepancy grew larger. Thus, special education classes may improve the achievement of students with disabilities, but not at a rate that allows them to close the gap between themselves and their non-disabled peers. When
considered together, the classic special education studies reveal mixed results regarding the effectiveness of special education programs. Shinn considered these findings to indicate a need for policy change: “Without intervention effectiveness data or with data that are indicative of marginally effective or ineffective programs, concern about the entire classification process is justified” (p. 50).
(p. 375). Additionally, full inclusion was believed to be advantageous because: (a) the use of classwide accommodations would improve the achievement of students with and without disabilities, (b) a decrease in the stigma associated with disabilities would occur, and (c) students with disabilities would not miss out on general education instruction or social interactions that occur when they are pulled out for resource room instruction (Zigmond & Baker, 1996). Despite these potential advantages, the REI had limited empirical support (Kavale & Forness, 2000). Zigmond and Baker also reported that the main disadvantage to full inclusion is that students with disabilities do not receive direct and intense intervention when they are solely educated within the general education classroom.
Hocutt’s (1996) more recent review of the literature led her to conclude her article with a statement that echoed the earlier findings of Maddin and Slavin (1983): “Research supports the continuation of efforts to improve academic and social outcomes for students with disabilities in both special and general education settings and indicates that
education reveals mixed results and questions regarding outcomes for students with disabilities remain.
The “Special” in Special Education
As an alternative way of assessing the effectiveness of special and general education programs for students with disabilities, some researchers have attempted to identify the variables that make special education “special.” Fuchs and Fuchs (1995) argued that special education programs have unique resources that general education programs cannot provide. For example, special education involves the use of IEPs (which allow teachers to create and attain specific short- and long-term goals for each student), smaller class sizes (which allow for more individualized instruction), and more highly trained teachers (who tend to have more advanced degrees than general education teachers). These authors highlighted the previous research findings that special education is more effective than general education for students with certain types of disabilities (i.e., those with milder disabilities).
engagement); and (d) systematically monitoring students’ progress. They claimed that the five full inclusion case studies described by Zigmond and Baker (1995) in the same journal issue did not fulfill the PASS criteria. Thus, although Scruggs and Mastropieri stated that they support the education of students with disabilities in the least restrictive environment, they did not believe that these particular full inclusion programs were sufficiently “special” to meet the needs of students with learning disabilities. Preparing for Change
with learning disabilities that have demonstrated track records of producing high levels of literacy, numeracy, and content knowledge” (p. 204). Despite their varied methodologies and discouraging results, classic special education studies did provide a starting point for examining the effectiveness of special education programs, and their results underscore the need for more research about the impact of special education programming and the factors consistent with effective programs.
As the interest in outcomes for students with disabilities has increased, so has the interest in examining the cost of special education programs. According to a
retrospective study by Chaikind, Danielson, and Brauen (1993), the cost of educating a student in a special education program is approximately 2.3 times as much as the cost of educating a student in a general education program. This ratio has remained relatively stable over time: from the 1970s through the 1990s, the total expenditure for students receiving special education services has remained approximately twice the cost for students in the general education program. A more recent examination of special education expenditure by Chambers, Parrish, and Harr (2002) revealed that the total amount spent providing both special and general education services to students with disabilities was $77.3 billion in the United States during the 1999-2000 academic year. This figure represents an average of $12,474 spent to educate each student with a
special education programs have come under increased scrutiny as the number of students receiving such services continues to grow.
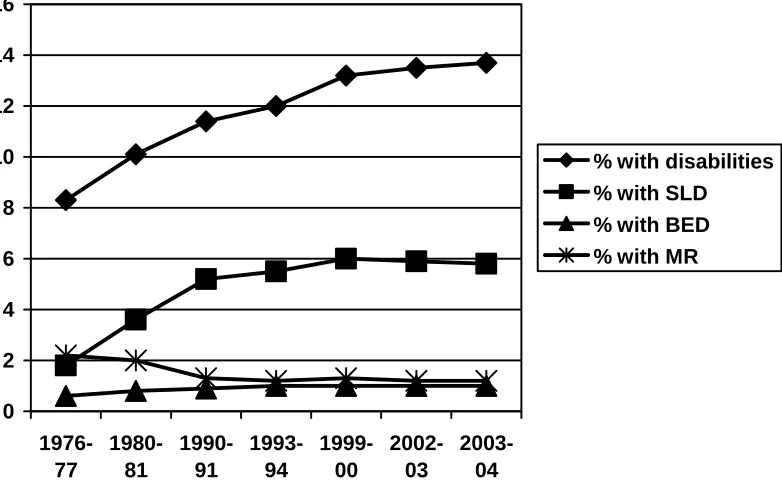
According to the National Center for Education Statistics (2006), the number of students receiving special education services in the United States has increased from almost 3.7 million in the 1976-1977 school year to over 6.6 million students in the 2003-2004 school year (see Figure 1). These numbers reflect an increase from 8.3% to 13.7% of the total student population (see Figure 2). Additionally, the composition of students with disabilities has changed over the course of the past 30 years. Although the number and proportion of students with more severe disabilities [e.g., mental retardation (MR)] has decreased, the number and proportion of students with less severe disabilities [e.g., specific learning disabilities (SLD), behavioral-emotional disabilities (BED)] has
increased (see Figure 3). Because of the added expense associated with providing special education services, as well as the growing number of students receiving these services, it is important to assess the outcomes for students with disabilities. Additionally, as
0 1 2 3 4 5 6 7
1976-77 1980-81 1990-91 1993-94 1999-00 2002-03 2003-04
0 2 4 6 8 10 12 14 16
1976-77
1980-81
1990-91
1993-94
1999-00
2002-03
2003-04
% with disabilities % with SLD % with BED % with MR
0 0.5 1 1.5 2 2.5 3
1976-77 1980-81 1993-94 2003-04
SLD
BED
MR
Figure 3. The number (in millions) of students receiving special education services in the U.S., by disability type (National Center for Educational Statistics, 2006).
curriculum. Now, educators have the opportunity to change the way special education effectiveness research is conducted. Specifically, the standards-based reform movement allows for the examination of outcomes for students with disabilities through their scores on large-scale assessments. Because scores on large-scale assessments are examined in the current study, the next section of this paper will describe how the standards-based reform movement led to the wide-spread use of large-scale assessments for both students with and without disabilities.
researchers with a new outcome measure that can be used to examine the effectiveness of special education programs.
The Standards-Based Reform Movement
In 1994, the Goals 2000: Educate America Act was passed to encourage individual states to adopt content and performance standards for all students. Content standards were defined as broad descriptions of the knowledge and skills students ought to acquire in each content area (e.g., reading, mathematics) and performance standards were defined as specific examples of what students must be able to do as a demonstration of proficiency in these areas. This federal legislation provided momentum for the
standards-based reform movement, which posited that all students can meet high academic standards when those standards are clearly defined and taught by teachers. In other words, having common standards serves as a means for improving student
outcomes. Although there is a lack of research to demonstrate that focusing on standards will directly improve student outcomes, research has revealed a relationship between the type and difficulty of courses taken and achievement outcomes for students. Thus, standards-based reform policies focused on increasing the content and performance standards students must attain at each grade level in order to improve their achievement (McDonnell et al., 1997).
content validity of outcome measures), (d) individual schools and classrooms can include instruction that is consistent with the standards, and (e) standards-based reform is only one component of a strategy for improving schools (McDonnell et al., 1997).
McLaughlin and Warren (1992) argued that students’ outcomes ultimately ought to be used to improve instruction and, thus, improve the educational process. For this reason, outcomes for all students (including those with disabilities) must be measurable in such a way that allows for comparisons to be made among schools, school districts, and states. Recently, student outcomes have begun to be measured through scores on large-scale assessments, which are designed to measure students’ performance as the extent to which they have mastered content standards at a particular grade level (McDonnell et al.). Moving From Inclusion in the Classroom to Inclusion in Large-Scale Assessments
achievement scores of the students in general education classrooms (Elliott, Erickson, Thurlow, & Shriner, 2000; Zlatos, 1994).
As the standards-based reform movement gained speed, it became clear that students with disabilities ought to be included in accountability practices. Thus,
More recently, the No Child Left Behind Act (NCLB; 2001) increased accountability for students in federally funded elementary and secondary schools by requiring all children in the third through eighth grades to be tested annually in both reading and math. This legislation mandated that each state implement an accountability system to ensure schools make adequate yearly progress (AYP) in improving the
achievement of all students, with the goal that all groups of students reach proficiency by the year 2014. States must not only demonstrate improvement in overall achievement, but must also exhibit improved achievement for students in various disaggregated groups (including students with disabilities) to ensure that no group or individual child is left behind.
These large-scale assessments are often referred to as “high-stakes tests” because of the consequences states associate with students’ scores at both the school- and student-level. School-level rewards can include additional funding or recognition; school-level sanctions can include decreased autonomy, probation, loss of accreditation, and funding loss. At the student-level, the results of large-scale assessments may be used to make grade promotion or graduation decisions (Jones, 1997; McDonnell et al., 1997). For example, within the state of North Carolina, teachers can receive bonuses if students’ average growth meets or surpasses the standards set for their grade level. Likewise, schools that meet or exceed AYP goals may be recipients of State Academic
Achievement Awards. On the other hand, a school may be taken over by a state
Additionally, test scores may be reported in the local newspaper by school, grade level, or classroom (Mehrens, 1988; Schulte, Villwock, Whichard, & Stallings, 2001).
The Use of Large-Scale Assessments for Students With and Without Disabilities
To date, relatively little research has examined the use of large-scale assessments for students without disabilities; even less research has examined the use of large-scale assessments for students with disabilities. However, the research that has been conducted has covered a wide variety of topics. This section will summarize previous research regarding the intended and unintended outcomes of high-stakes assessments for students with and without disabilities, state-level accountability for students with disabilities, the use of accommodations on large-scale assessments for students with disabilities, and teacher and parent attitudes regarding testing and accommodating students with disabilities.
Intended and unintended outcomes of high-stakes assessments. The NCLB Act called for the use of these high-stakes tests with the expectation that increasing
Many positive outcomes of large-scale assessments have been hypothesized. The positive, intended outcomes for students, teachers, and schools include the following: increased passing rates, increased number of students receiving a diploma, increased academic expectations, increased focus on achievement in IEPs, improved instruction, increased use of accommodations for students with disabilities, and improved ability of parents to communicate with educators regarding achievement (Ysseldyke et al., 2004). Braden (2002) noted that other intended outcomes include improved curricular alignment and increased motivation in both teachers and students. Research by Christenson,
Decker, Triezenberg, Ysseldyke, and Reschly (2007) reveals that special education teachers, general education teachers, and school psychologists believe that high-stakes assessments have led to increased monitoring of student progress and increased efforts to improve the performance of struggling students in the classroom.
Although studies have not specifically assessed anxiety as an outcome for students with and without disabilities, concern exists that such anxiety might lead to other negative consequences (e.g., increased cheating).
A review of the research regarding the impact of high-stakes testing on students, parents, teachers, and schools is beyond the scope of this literature review. However, Mehrens’ (1988) comprehensive review revealed that high-stakes assessments can have negative consequences for teachers (e.g., increased stress and burnout, decreased morale, increased probability of unethical behavior) and students (e.g., increased feelings of inadequacy, decreased motivation, decreased morale). A more recent review by Jones (2007) found that the consequences of high-stakes assessments affect teachers’ and students’ motivation, as well as teachers’ instructional methods, in negative ways. Thus, the use of large-scale assessments can potentially result in both positive and negative outcomes for students, teachers, and schools.
Together, the reauthorization of the IDEA in 1997 and the passage of the NCLB Act in 2001 require that (a) students with disabilities be included in large-scale academic assessments and (b) schools be responsible for demonstrating that students in both general and special education programs are making annual progress on these high-stakes, large-scale assessments. Although more current research is needed to identify the
State-level accountability for students with disabilities. Large-scale assessments of academic achievement are not only used to assess the performance of individual students, but also to assess the overall performance across schools, school districts, and states. As mandates from the 1997 reauthorization of the IDEA and the NCLB Act have been put into practice, changes in state-level accountability practices have occurred. Elliott et al. (2000) examined these changes over a 5-year period. Their findings revealed that during the mid-1990s, states demonstrated that they were increasingly including students with disabilities in their accountability practices. For example, the number of states that included school participation (e.g., attendance, placement, suspension, or expulsion information), exit information (e.g., dropout/graduation rate, dropout reason, diploma type), and achievement data on students with disabilities in state-level
The use of accommodations on large-scale assessments. When students with disabilities participate in large-scale assessments, they are permitted to use
accommodations, as is deemed appropriate by an IEP team. Accommodations involve changes to the way a test is administered or to the way a student responds to a test; they should not interfere with the assessment of target skills (the skills the test is purporting to measure). Rather, accommodations are implemented to improve students’ access skills, allowing them to appropriately demonstrate their target skills (e.g., being able to read the test, being able to complete the test within the allotted time frame). Accommodations differ from modifications, which alter target skills and, thus, change the content of the test (American Educational Research Association, American Psychological Association, & National Council on Measurement in Education, 1999; Niebling & Elliott, 2005). Providing test accommodations to students with disabilities is thought to improve the validity of their scores by removing the irrelevant interference of their disabilities and allowing them to display their knowledge more accurately (Koretz & Barton, 2003; Niebling & Elliott, 2005).
made to the timing of the test, such as providing extended time or additional breaks during the testing session (Braden, 2002; Thurlow et al., 2000).
The National Center on Educational Outcomes studied the use of
accommodations across the United States in 1993, 1995, and 2000. In the most recent study, Thurlow et al. (2000) examined the written policies regarding the use of
accommodations from all 40 of the 50 states with active policies. Eighty percent of these active policies allowed some accommodations of nearly every type. The eight most commonly provided accommodations across the country included the use of large print, Braille, a proctor/scribe, sign language, small group administration, extended time, individual administration, and having the test read aloud. Thus, state policies most frequently allowed for accommodations to the presentation format of a test. However, acceptable accommodations varied by state, making comparisons across states more difficult.
One of the most controversial accommodations is reading a math test to students with reading disabilities. Johnson (2000) provided this accommodation to students with and without disabilities on a large-scale mathematics achievement test to assess its validity. Results suggested that the accommodation of reading math items to students may have a differential effect for students with and without disabilities. For students with reading disabilities, the mean score on the Washington Assessment of Student Learning (WASL) increased by nearly 20 points when the test was read to them; for students without disabilities, the mean score on the WASL decreased by less than 2 points when the test was read to them. However, because this study was conducted with a small sample size (38 students per group), this effect approached, but did not quite reach significance (p < .076). Despite the limitations of this study (e.g., the small sample size, the removal of the “high stakes” associated with the assessment by telling students the examination was “didn’t count” or was “for research purposes”), it provides some initial support for the validity of a specific accommodation for students with reading disabilities.
A study by Elliott, Kratochwill, and McKevitt (2001) examined the effects of accommodations on achievement test scores for students with and without disabilities. Math and science achievement tests were taken by both groups of students with and without the use of accommodations as a way to simulate large-scale assessments. They found that students with disabilities performed almost one standard deviation lower when they took the test without accommodations than when they took the test with
very similar when students with disabilities were given testing accommodations and students without disabilities were not given such accommodations. Finally, students without disabilities benefited somewhat from the use of accommodations. Although over 75% of students with disabilities demonstrated a medium to large effect size when using accommodations, the same was true for approximately half of the students without disabilities. Additionally, the use of accommodations led to negative effects for 17% of the students with disabilities and 7% of the students without disabilities. Thus, the authors concluded that accommodations tend to have a positive impact on the test scores of students with disabilities; however, accommodations affect the achievement scores of individual students differently.
More recently, Fletcher, Francis, Boudousquie, Copeland, Young, Kalinowski et al. (2006), examined the effects of accommodations on a high-stakes reading assessment, the Texas Assessment of Knowledge and Skills (TAKS), for students with and without disabilities. Students identified as having a reading disability (and below average decoding skills) and students with average decoding skills were either given no
accommodations or a package of three accommodations specifically designed to reduce the impact of students’ decoding difficulties on their TAKS scores. The accommodations included: (a) having proper nouns read aloud to them, (b) having the stems and possible responses of test items read aloud to them (after the students independently read the reading passage), and (c) taking the test in two sessions instead of one. Students with a reading disability performed better on the TAKS when they received these
the accommodations were approximately seven times more likely to pass the TAKS than were students with disabilities who did not receive accommodations. In addition, the scores of students without reading disabilities were not significantly different for the students who were given accommodations and the students who were not. Again, accommodations were shown to improve the scores of students with disabilities, but to have no significant change on the scores of students without disabilities.
Lang et al. (2005) examined the reactions of students, teachers, and parents to the use of testing accommodations. The majority of students with and without disabilities reported that they felt more comfortable when the teacher provided testing
accommodations (46% and 43.4%, respectively) than when the teacher did not (9.5% and 17.5%, respectively). However, a large proportion of students with (44.4%) and without (39.2%) disabilities reported no preference between conditions in terms of their comfort level. Additionally, the majority of students with (62.2%) and without (50%) disabilities reported that the test seemed easier when the teacher provided them with
accommodations; a much smaller proportion reported that the test actually seemed easier without accommodations (9.4% of students with disabilities and 16.9% of students without disabilities). Finally, students with disabilities were more likely than their non-disabled peers to report that when using accommodations, they were better able to show their knowledge in both math and reading. In open-ended questions, students stated that they appreciated the use of accommodations, but did not always find them to be
fair way to assess students with disabilities, as it makes their scores more comparable to the scores of non-disabled peers who do not use accommodations.
Although students, parents, and teachers recognize that accommodations can improve the test scores for students with disabilities, federal guidelines do not yet specify which accommodations are acceptable for use and which accommodations provide an unfair advantage for students with disabilities (Koretz & Barton, 2003). Until more specific direction is provided, IEP teams can use tools such as the Assessment
Accommodations Checklist or The Dynamic Assessment of Test Accommodations to help determine if a test accommodation is appropriate (Niebling & Elliott, 2005).
Additionally, Braden (2002) provided the following “best practice” guidelines regarding the inclusion of students with disabilities in large-scale assessments and the use of testing accommodations during these assessments: (a) students who do not participate in the general education curriculum probably should not participate in large-scale assessments; (b) when in doubt, allow students to participate in large-scale assessments because there is no evidence yet that they are harmed by their inclusion; (c) accommodations should already be provided in the student’s classroom for at least 4 to 6 weeks before they are used during a large-scale assessment; (d) accommodations should only address students’ access skills and should not alter target skills; (e) prior testing should be used as a guide when considering the use of accommodations; and (f) accommodations used and
students’ responses to them should be documented for future reference.
pessimistic” about the inclusion of students with disabilities in large-scale assessments for accountability purposes, as well as their use of accommodations on such assessments. Oregon teachers participating in focus groups stated concerns regarding the use of large-scale assessment data for accountability purposes of any kind. However, they were particularly concerned about the inclusion of students with disabilities in such
assessments because of (a) the amount of testing students with disabilities must already endure, (b) the distress students with disabilities may feel in response to these tests, and (c) the pressure they, as teachers, feel because of the high stakes associated with the use of the results in making accountability decisions (Crawford, Almond, Tindal, &
Koretz and Barton’s (2003) review of the literature regarding the inclusion of students with disabilities in large-scale assessments found that very few studies have examined how participation in these assessments has directly affected students with disabilities. They noted concerns that research in this area will be very difficult to conduct due to the inconsistent identification and classification of students with
disabilities across states. For example, the proportion of students identified as having a learning disability ranges from 9.1% to almost 16% across states and “such dramatic inconsistencies in identification and classification rates make it difficult to determine how to best assess students with disabilities” (p. 4). Additionally, more research needs to be conducted regarding potential item bias for students with disabilities, as well as the appropriate use of accommodations by students with disabilities. Indeed, research regarding the inclusion of students with disabilities in large-scale assessments is still in its infancy.
Old Question, New Methodology
The results of high-stakes tests for students with disabilities have been used in a variety of studies. For example, students’ scores on high-stakes tests have been
Because students with disabilities have only recently been required to participate in large-scale assessments, little research has been conducted regarding their performance on these examinations. A study by Schulte et al. (2001) found that in one North Carolina school district, there was an increase in the proportion of students with learning
disabilities (from 39% to 53%) who scored at or above the proficiency level on a large-scale assessment when a value-added model was used to assess growth longitudinally. Despite this growth, a large proportion of these students continued to score below the proficiency cut-off. This study revealed that large-scale assessments can be used to monitor students’ growth and proficiency levels over time.
In the same school district, Schulte and Villwock (2004) later used scores on large-scale assessments to determine the percent of students with and without disabilities achieving grade level proficiency each year and the percent of students with and without disabilities who exceeded expected growth each year. These authors concluded that regression-based, value-added analyses can be used effectively to examine the progress of students with disabilities on large-scale assessments. Additionally, state standards for students in general education programs can be applied as goals for students in special education programs. However, they also stated that the entry and exit patterns of special education students, as well as school-level effects for all children create biases that need to be addressed during analyses.
achievement growth (e.g., cross-sectional, longitudinal) on a large-scale assessment in the state of Texas. They found that cross-sectional analyses revealed the largest achievement gap between students in special and general education over time. Similar trends were also found when a cohort-dynamic longitudinal method was used (i.e., special or general education status was defined by a student’s status in a given grade, such that each
student’s status could change each year). However, the achievement gap was lessened when a cohort-static longitudinal method was used (i.e., special or general education status was defined by a student’s status in the first year of the study and did not change, regardless of whether a student entered into or exited out of special education programs). Because higher achieving students with disabilities were more likely to exit special education programs, over time, the group of special education students demonstrated lower achievement when transitions between programs were taken into account (as was done when both the cross-sectional and cohort-dynamic longitudinal methodologies were used). Thus, the transitioning of students between programs affected group gains over time.
special education programs has been influential in providing new data to address longstanding concerns about educational outcomes for students with disabilities.
Hanushek and colleagues’ (1998) working paper with the National Bureau of Economic Research was one of the first studies to examine the effectiveness of special education using large-scale assessment data. Based on a desire to understand whether the costs of special education services are justifiable, Hanushek et al. analyzed the reading and math scores of students with disabilities on state-wide assessments in Texas. Their analyses were conducted much differently than traditional special education effectiveness research and their results have played a central role in discussions regarding the
Hanushek et al.’s Use of Large-Scale Assessments to Evaluate Special Education Research Participants
Hanushek et al. (1998) examined data from the Harvard and University of Texas Dallas (UTD) Texas Schools Project, which included five cohorts of Texas public elementary school students (their data pool included over 200,000 students in more than 3,000 schools in each of the five cohorts). They reported that their sample size varied for each regression analysis done, with fluctuations from 254,294 to 601,526 students
participating in any data analysis. Research Analyses and Results
Normalized TAAS scores. To assess the effectiveness of special education programs, Hanushek et al. (1998) used students’ scores on the Texas Assessment of Academic Skills (TAAS). Between 1993 and 2002, Texas students in the third through eighth grades participated in the TAAS to assess their mastery of grade-level concepts in reading and math (Texas Education Agency, 2003). The availability of state-wide TAAS scores provided an opportunity to assess the effectiveness of special education by
predicting students’ relative standing on the TAAS from one grade to the next based on their special education status. Because of their emphasis on students with disabilities’ gains relative to general education students (rather than on students’ ability to achieve proficiency standards), Hanushek et al. began their analyses by first normalizing
programs by examining gains students have made on large-scale assessments (Schulte et al., 2001; Schulte & Villwock, 2004).
Value-added analyses. After transforming test scores to z-scores, Hanushek et al. (1998) rejected doing a simple between-groups analysis (general education versus special education students) for many of the reasons discussed earlier in this document, such as non-random assignment to groups. Instead, they began their series of analyses with between-groups comparisons of gain scores for general versus special education students by grade and subject, with additional analyses looking at gains separately for the three most prevalent disability classifications (learning disabled, speech-language impaired, and emotionally disturbed). They termed these value-added analyses because the dependent measure, gain scores, only reflected gain in the current year, thus controlling for any unchanging variables (such as gender) and previous effects (such as prior achievement) when looking at between-group differences. Specifically, in this initial set of analyses, they used ordinary least squares regression (OLS) to examine the difference in students’ annual test score gains as a function of their special education status (i.e., special education versus general education) while controlling for (a) student and family characteristics, (b) school demographic characteristics, and (c) community
characteristics.
individual and school influences linked with selection into the special education program” (p. 16).
Eliminating fixed effects. As a result of these confounds, Hanushek et al. (1998) rejected their initial results. They concluded that to isolate the true effect of special
education, an alternate strategy was needed that compared special education students only to themselves, not to the general education population. To do so, Hanushek et al. focused their primary analyses on a sub-group of students in their dataset who had entered into or exited out of special education programs while in the fourth or fifth grade. Although this new strategy involved focusing on a small subset of all students with disabilities, it allowed for a comparison of the gains for students with disabilities while enrolled in special education programs and while enrolled in general education programs. Although they targeted their analyses toward students who entered or exited special education programs during the 3 years of the study, general education students and students with disabilities who did not transition in or out of special education also were included in the analyses to provide better estimates of the control variables and expected gains in
achievement. This approach is termed “differencing” and is common in econometrics (Woolridge, 2000).
by subtracting the z-score for Year 2 from the z-score for Year 3 (with positive scores indicating gain from one year to the next and negative scores indicating a decrease in scores over time). Then they created differenced scores by subtracting the first year of growth from the second year of growth.
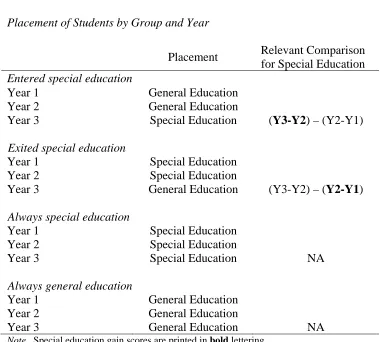
Estimating special education effectiveness. With this strategy, Hanushek and colleagues (1998) did not predict gains on TAAS scores based on students’ status as a general versus a special education student in their second set of analyses. Instead, they predicted differences in students’ TAAS score gains with a transition between special and general education placement. Although students who remained in general or special education programs across the 3 years were included in the analyses for comparison, the groups of most interest were students with disabilities transitioning into (entering) special education from general education programs or transitioning out of (exiting) special education to general education programs. By examining gains made in the special education versus general education environment for students with disabilities who entered or exited special education programs, these authors eliminated the biases associated with comparing special to general education students’ scores.
random error. Because each student served as his or her own control, the comparison groups’ demographic characteristics were stable, and it was not necessary for the authors to continue to include family or community characteristics in the regression equation.
Results of the differenced regression analyses. The new regression analyses were run in two different ways. First, students who entered or exited special education
programs were considered together as a group and their differenced scores were
Table 1
Placement of Students by Group and Year
Placement Relevant Comparison
for Special Education Entered special education
Year 1 General Education
Year 2 General Education
Year 3 Special Education (Y3-Y2) – (Y2-Y1) Exited special education
Year 1 Special Education
Year 2 Special Education
Year 3 General Education (Y3-Y2) – (Y2-Y1) Always special education
Year 1 Special Education
Year 2 Special Education
Year 3 Special Education NA
Always general education
Year 1 General Education
Year 2 General Education
Year 3 General Education NA
Note. Special education gain scores are printed in bold lettering.
After completing these three analyses (both transitions combined, special
education entry only, special education exit only) for all disability categories combined, the same analyses were run separately for students in each of the three largest disability categories. Hanushek et al. (1998) predicted “special education to have its largest
Overall, the results revealed that special education increased students’ TAAS scores in both math and reading. When achievement gains while in special education were considered separately for students who had entered versus exited special education, all regression coefficients for entrants into special education were statistically significant, and all regression coefficients for exiters from special education were not. This pattern was true for both reading and math scores. Thus, based on the results for students entering special education programs, Hanushek et al. (1998) concluded that special education programs are associated with increases in students’ academic achievement. Interestingly, the effects for math for entrants were found to be almost twice as large as the effects for reading. In fact, when Hanushek and colleagues published the findings of their second, related study in The Review of Economics and Statistics in 2002, they only reported the analyses conducted with math scores.
In addition to the overall finding supporting the hypothesis that special education programs demonstrate effectiveness for students with disabilities, the authors revealed a few other interesting results. First, when limiting the sample to include students who did not change schools, the regression coefficient remained similar, suggesting that
with speech impairments. Hanushek and colleagues (1998) believe this finding provided additional support for the effectiveness of special education for students with learning disabilities.
Examining potential biases. Due to concerns about interpretation of scores when students transition in and out of special education programs, Hanushek et al. (1998) then conducted a series of follow-up analyses to rule out potential sources of bias in their analyses. Through the use of both logical arguments and additional multiple regression analyses, these authors showed that biases in terms of (a) students entering special education programs based on only a single year of temporarily low achievement scores (i.e., students who had a bad testing day would likely experience greater gains the following year than would students who consistently scored lower over the course of multiple years); (b) schools manipulating which students take the test; or (c) differences in school quality across grades were unlikely to have affected the results. In sum, these analyses demonstrated that special education placement is associated with improvements in the math and reading achievement scores of students with disabilities.
Why This Research Was Influential
First, Hanushek and colleagues (1998) considered it important to use students’ scores on a statewide, high-stakes assessment of achievement as their outcome measure. Legislative mandates such as the 1997 reauthorization of the IDEA and the NCLB Act require that schools demonstrate adequate progress in improving the achievement for children in both general and special education programs by documenting their scores on large-scale academic assessments. Thus, Hanushek et al.’s use of differenced scores on the TAAS (and the current study’s use of first-level differenced scores on the large-scale assessment used in North Carolina) as an outcome variable is logical because of the emphasis current legislation places on students’ scores on large-scale assessments.
Next, Hanushek and colleagues (1998) recognized that the inherent differences between students enrolled in special and general education programs create unavoidable biases when special education effectiveness studies utilize control groups involving general education students. Therefore, their “control group” consisted of the special education students during a year in which they were not classified as needing special education. Their primary multiple regression formula involved examining students’ test score gain as a function of their special education status, school characteristics, and random error. The coefficient for special education status did not indicate whether students were placed within a general or special education program; rather, it represented whether a student entered or exited a special education program during the study.
programs, they reduced (but did not eliminate) the effects of non-random assignment of students to treatment and comparison groups.
Additionally, Hanushek and colleagues’ (1998) research was influential because of the large sample of participants used. Their use of data from five cohorts of Texas elementary school students allowed them to maintain a large sample size.
Finally, Hanushek and colleagues (1998) conducted a variety of follow-up analyses to provide additional support for their finding that special education placement was associated with increased TAAS scores for students with disabilities. These follow-up analyses revealed no evidence of bias in terms of students being temporarily shocked by a single year of low achievement scores, teachers manipulating who takes the TAAS tests, or the school quality changing across grades and years. Although they admitted that other sources of bias may be possible, these analyses provided additional support for their results.
The Need to Replicate and Extend This Research
Despite its impact on the field of special education, Hanushek and colleagues’ (1998) research has yet to be replicated. Although these findings are quite powerful, a replication of the analyses with data from another state would greatly increase the external validity of the findings. At the time of their study, only 30% of students with disabilities took the TAAS. Thus, in 2002, the authors themselves wondered about the generalizability of their data to the special education programs in other states by arguing that, “some question arises whether the results obtained from the tested population are generalizable to all students who receive special education” (p. 588). The current study re-examines the effectiveness of special education programs in a state in which a much larger proportion of students with disabilities participate in large-scale assessments. Furthermore, in 2003, Princeton Review ranked North Carolina’s testing and
accountability program fourth in the nation (just behind the state of Texas), making its data ideal for use in a replication of this kind.
special education; Leary, 2004). In their 1998 working paper, Hanushek et al. excluded the top and bottom 1% of their participants’ gain scores from their analyses because of “concerns about measurement error.” Using the same reasoning, they excluded the bottom 1% of participants’ scores because these students scored lower than one would when randomly guessing. However, regression to the mean can be accounted for within the regression analysis itself, rather than by simply excluding participants with extreme scores. In fact, North Carolina adjusts for regression to the mean in their state-wide formula for calculating students’ growth on large-scale assessments [Public Schools of North Carolina (PSNC), 2004c]. Because the participants include students with disabilities who are more likely to receive extreme scores, the current study compared analyses conducted in the same manner as was done by Hanushek et al. to analyses that also account for potential regression to the mean.
Hanushek et al. (1998) also did not address the fact that students receiving special education services are frequently given accommodations when taking large-scale
assessments. It is possible that these students scored higher on the TAAS when they were enrolled in a special education program because their special education status permitted them to receive accommodations during the test that they did not receive in the year in which they were not classified as a special education student. Therefore, in the current study, accommodation effects are examined as well.
learning disabilities experience difficulties in reading as their primary academic
difficulty. Additionally, a significant amount of educational research has revealed more information about the process of reading than about any other academic domain in which a student can be identified as having a learning disability. Because the majority of students with specific learning disabilities are receiving services for reading difficulties, the less strong results found by Hanushek et al. in the area of reading should not be ignored (or excluded completely, as was done in their 2002 publication).
CHAPTER THREE Research Aims Statement of the Problem
As is evident from the literature review in the previous chapter, questions regarding the education of students with disabilities have changed from questions of access to questions of outcomes. Over time, federal mandates such as the original IDEA, the Goals 2000: Educate America Act, the 1997 reauthorization of IDEA, and the NCLB Act have increasingly provided students with disabilities access to the general education curriculum and increased the accountability of schools and states to provide these students with an appropriate education. As federal legislation changed, these students’ access to an education was deemphasized and the need to examine academic outcomes for these students became a more pressing concern.
The effectiveness of special education programs has been an ongoing question in the educational community. Over time, this question has been addressed by examining outcomes for students in special education programs, frequently in comparison to outcomes for students in general education programs. Literature reviews and meta-analyses have revealed mixed results regarding the effectiveness of special education programs for students with varying severity of disabilities. Overall, however, outcomes for students in special education programs have historically not been encouraging.