ABSTRACT
ZUBILLAGA, JOSE ANTONIO. Erection and Strength Aspects of the Roof Trusses for RDU Airport Terminal C. (Under the direction of Dr. David W. Johnston).
The Raleigh-Durham Airport has undertaken redevelopment of Terminal C. The
redevelopment includes a roof truss system that combines steel members and glue laminated
timber arches. The splice between wood and steel was accomplished by a German engineered
connection system called Bertsche Connectors. Tests were needed to confirm the needed strength
and behavior of the connection system. The tests were performed at the North Carolina State
University Constructed Facility Laboratory. The objective of the test was to load the specimens
to 3.0 times the specified service load or to failure, whichever was reached first. Nine tests were
performed on six specimens. Three specimens have a nominal depth of 2’6’’ with a Bertsche
System type 3 connector (BS-3) loaded in tension, and three specimens have a nominal depth of
4’6’’ with a Bertsche System type 6 connector (BS-6) in tension. The tension capacity of the BS
connectors was determined based on the test results.
The theoretical allowable capacity of the BS-3 and BS-6 connectors was also calculated
using the 2005 edition of the National Design Specifications for Wood Construction (NDS). The
objective of this study is to compare the theoretical capacity to the tension capacity determined
from the tests.
This study also documents the construction process for the roof trusses of the Terminal C
project as a complement to the laboratory testing. It describes the assembly erection procedures,
In general, the connection system behaved as expected. The capacities determined in the
test of the tension in the top BS connectors is greater than the tension analytically calculated,
Erection and Strength Aspects of the Roof Trusses for RDU Airport Terminal C
by
Jose A. Zubillaga
A thesis submitted to the Graduate Faculty of North Carolina State University
in partial fulfillment of the requirements for the Degree of
Master of Science
Civil Engineering
Raleigh, North Carolina
2007
APPROVED BY:
Dr. Emmet A. Sumner Dr. Michael L. Leming
ii
BIOGRAPHY
Jose Zubillaga was born in Caracas, Venezuela on Mach 19th 1982. In 1988 he moved to Barquisimeto, Venezuela where he grew up. He obtained his high school diploma from Rioclaro School in 1999. After high school, he enrolled in a cultural exchange student program that led him to Chattanooga, Tennessee where he stayed with an American family for a year as part of the cultural experience. He went to Chattanooga School for the Arts and Science for the 1999-2000 school year. Once the exchange program was finished, he moved back to Caracas to pursue a college degree. In July 2005, he obtained his BS in Civil Engineering from the Universidad Catolica Andres Bello.
In 2006 he enrolled in the Construction Engineering and Management graduate program at North Carolina State University, to pursue his Master in Science degree. He formed part of the testing team at the Constructed Facility Laboratory (CFL), to perform tests to measure the capacity of the Bertsche Connection System. The tests became the bases for his research project.
iii
ACKNOWLEDGEMENTS
I would like to thank Dr. David Johnston for his advice throughout my graduate studies. Without his guidance and help, the completion of this work could not have been possible. I greatly appreciate his patience and dedication. I would also like to thank the members of my committee, Dr. Michael Leming and Dr. Emmett Sumner. I specially thank Roberto Nuñez for his friendship and support all through my graduate studies.
I would like to thank Lee Nelson, Jerry Adkins, and all Constructed Facilities Laboratory personnel involved in test. I specially thank Greg Lucier for his efforts in designing and performing the tests and providing me with the data needed for this study.
I greatly appreciate all the help given by Archer Western’s team at the RDU Terminal C project. Specially Joe Thompson, Andy Palahnuk, and Jason Mroz, for taking time of their work to help me with all my requests for information regarding the project. Thank you very much.
I would like to thank my friends Luis, Adriana, Michel, Cesar, Bart, Juan Jose, Isabella, Natalia, Ingrid, and Jimmy for their support during my career, specially this last period. I want to thank Vanessa Caro for her love and for been there for me.
I want to thank my sister Laura and my brother Alfredo for helping me become the person that I am today. And above all, I would like to thank my parents for their unconditional love, for their constant support throughout my life. There are no words that can express my gratitude; you have given me more than I can ever repay. I love you very much.
iv
TABLE OF CONTENTS
LIST OF FIGURES... vi
LIST OF TABLES... ix
CHAPTER 1. INTRODUCTION... 1
1.1 Background... 1
1.2 Problem Statement ... 2
1.3 Objectives ... 3
CHAPTER 2. REVIEW OF LITERATURE ... 4
2.1 Glue Laminated Timber ... 4
2.2 Bertsche System... 7
2.3 Calculation Methods ... 14
2.3.1 National Design Specifications ... 14
2.3.2 Manufacturer’s tables ... 16
CHAPTER 3. TEST PROGRAM... 22
3.1 Introduction... 22
3.2 Testing Program and Setup... 22
3.2.1 Loading Sequence ... 28
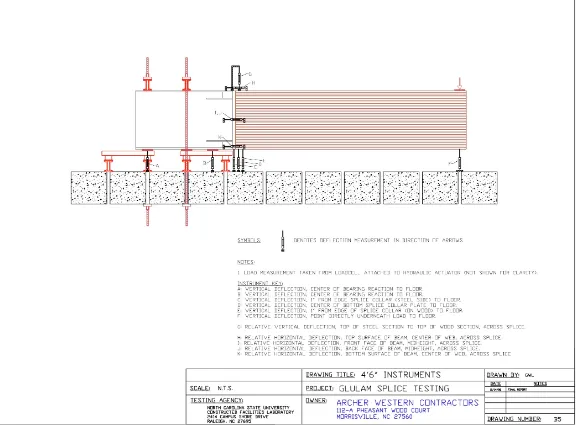
3.2.2 Instrumentation... 29
3.3 Test Results... 32
3.3.1 Results for the 2’6’’ Deep Specimens with BS-3 Connectors ... 33
3.3.1.1 Service Level Tests... 33
3.3.1.2 Tests to Failure ... 40
3.3.2 Results of the 4’6’’ Deep Specimens ... 45
3.3.2.1 Spherical Washer Failure ... 45
3.3.2.2 Tests to Failure ... 46
3.4 Tension on the top BS-connector... 54
CHAPTER 4. ANALYSIS OF CONNECTOR STRENGTH... 57
4.1 Introduction... 57
4.2 Analysis Parameters ... 60
4.2.1 Wood Cross Section and Length of Dowels ... 62
4.2.2 Material Properties ... 63
4.3 Calculation of BS-connector Type 3 (BS-3) Capacity by the ASD Method... 64
4.3.1 Horizontal Dowels... 64
v
4.3.1.2 Group Action Factor Cg... 68
4.3.1.3 Lateral Design Value Z... 69
4.3.2 Vertical Dowels... 72
4.4 Calculation of BS-connector Type 6 (BS-6) Capacity by the ASD Method... 74
4.4.1 Geometry Factor C!... 77
4.4.2 Group Action Factor Cg... 79
4.4.3 Lateral Design Value Z... 79
4.4.4 Load Duration Factor... 81
4.5 Calculation of BS-connector Type 3 (BS-3) and Type 6 (BS-6) Capacities by the LRFD Method... 81
4.5.1 Conversion Factor KF... 82
4.5.2 Resistance Factor "z... 82
4.5.3 Time effect Factor #... 82
4.6 Capacity of the BS-Connector Based on the Manufacturers Tables... 84
4.7 Comparison Between Calculated and Test Tension Capacities... 86
CHAPTER 5. CONSTRUCTION PROCEDURES ... 88
5.1 Introduction... 88
5.2 General Description of the RDU Terminal C Project ... 88
5.3 Construction and Erection Process... 97
5.4 Problems Encountered During Construction... 100
5.4.1 Alignment of the Members ... 100
5.4.2 Truss Erection Failure... 102
5.5 Baseline Schedule of the Project... 108
5.6 Comparison Between Predicted and Actual Schedules... 112
5.7 Lessons Learned From Construction Procedures ... 117
5.7.1 Tolerances ... 117
5.7.2 Assembly Board ... 118
5.7.3 Backup Lanyard ... 119
5.7.4 Transfer Truss Write Off Procedure... 120
CHAPTER 6. SUMMARY AND CONCLUSION ... 124
6.1 Summary... 124
6.2 Conclusions... 125
vi
LIST OF FIGURES
Figure 1.1 – Typical view of a roof truss [RDUAA 2006] ... 2
Figure 2.1 – Hetzer beam [Steurer 2006]... 5
Figure 2.2 – Manufacture of glue-laminated timber [CWC] ... 7
Figure 2.3 – Typical plate-pin connection [APA] ... 8
Figure 2.4 – Typical plate-pin connection [CWC] ... 8
Figure 2.5 – BS-connector type 2 [BS]... 9
Figure 2.6 – BS-connector type 3 [BS]... 10
Figure 2.7 – Six different types of BS-connectors [BS] ... 10
Figure 2.8 – Typical bolt [BS]... 11
Figure 2.9 – Typical washer [BS]... 11
Figure 2.10 – Locate holes [BS]... 12
Figure 2.11 – Drill dowel holes [BS]... 12
Figure 2.12 – Drill the connector hole [BS]... 12
Figure 2.13 – Remove chips using comppresed air [BS]... 12
Figure 2.14 – Insert connector [BS] ... 12
Figure 2.15 – Insert dowels [BS]... 12
Figure 2.16 – Seal end to impede grout [BS]... 13
Figure 2.17 – Place grout [BS]... 13
Figure 2.18 – Cure grout 24 hours [BS] ... 13
Figure 2.19 – Typical stress-strain curve... 15
Figure 2.20 – Pins with threaded washers... 20
Figure 3.1 – Test setup for the 2’6’’ deep specimen with BS-3 connector... 23
Figure 3.2 – Splice details of the 2’6’’ deep specimen with BS-3 connector [ECI] ... 24
Figure 3.3 – Setup of the 4’6’’ deep specimen with BS-6 connector... 24
Figure 3.4 – Splice details of the 4’6’’ deep specimen with BS-6 connector [ECI 2006]... 25
Figure 3.5 – Small specimen with BS-3 connector ... 26
Figure 3.6 – Large specimen with BS-6 connector ... 27
Figure 3.7 – Instrumentation setup for a 4’6’’ deep specimen... 31
Figure 3.8 – Load vs. deflection of cantilever end, Test #1... 34
Figure 3.9 – Load vs. deflection of cantilever end, Test #1a ... 34
Figure 3.10 – Load vs. deflection of cantilever end, Test #2... 35
Figure 3.11 – Load vs. deflection of cantilever end, Test #3... 35
Figure 3.12 – Moment vs. rotation at splice, Test #1 ... 37
Figure 3.13 – Moment vs. rotation at splice, Test #1a... 38
Figure 3.14 – Moment vs. rotation at splice, Test #2 ... 38
Figure 3.15 – Moment vs. rotation at splice, Test #3 ... 39
Figure 3.16 – Split visible in specimen after failure, Test #3a... 40
Figure 3.17 – Splits visible on the top of specimen after failure, Test #3a... 41
Figure 3.18 – Load vs. deflection of cantilever end, Test #3a ... 42
Figure 3.19 – Moment vs. rotation at splice, Test #3a... 42
Figure 3.20 – Relative vertical displacement at top of splice, Test #3a ... 43
vii
Figure 3.22 – Dowel bearing areas after BS-3 connector removed... 44
Figure 3.23 – Top BS-6 connector after washer fracture, Test #4 ... 45
Figure 3.24– Spherical Washer ... 46
Figure 3.25 – Installation of the spherical washer... 46
Figure 3.26 – Fractured washer of Test #5 ... 48
Figure 3.27 – Load vs. deflection of cantilever end, Test #4a ... 49
Figure 3.28 – Load vs. deflection of cantilever end, Test #5... 49
Figure 3.29 – Load vs. deflection of cantilever end, Test #6... 50
Figure 3.30 – Moment vs. rotation at splice, Test #4a... 52
Figure 3.31 – Moment vs. rotation at splice, Test #5 ... 52
Figure 3.32 – Moment vs. rotation at splice, Test #6 ... 53
Figure 3.33 – 4’6’’ deep specimen after test to failure, Test #6... 54
Figure 3.34 – Specimen test setup ... 55
Figure 3.35 – Free body diagram... 55
Figure 4.1 – Bearing reactions [Bertsche 1993]... 58
Figure 4.2 – Bearing reaction of the horizontal dowels (top view)... 58
Figure 4.3 – Dowel connection yield modes [AWC 2005]... 59
Figure 4.4 – Top view of the BS-3 connector. ... 61
Figure 4.5 – Lateral view of the BS-3 connector. ... 61
Figure 4.6 – Cross section A-A of the BS-3. ... 62
Figure 4.7 - Top view of the BS-6 connector... 75
Figure 4.8 – Lateral view of the BS-6 connector ... 75
Figure 4.9 – Cross section A-A of the BS-6 ... 76
Figure 5.1 – Rendering of proposed Terminal C [Fentress] ... 89
Figure 5.2 – Plan view of the lower level of the terminal... 91
Figure 5.3 – Glulams in the main terminal Areas 13,14,16 and 17 [Structurlam] ... 91
Figure 5.4 – Glulams in the concourse Area 11 [Structurlam] ... 91
Figure 5.5 – Lateral view of a main terminal truss [RDUAA 2006]... 93
Figure 5.6 – Glulam arches of a typical concourse truss [Structurelam]... 94
Figure 5.7 – Connection system of a typical concourse truss (side view) [Structurelam]... 95
Figure 5.8 – Connection system of a typical concourse truss (top view) [Structurelam]... 95
Figure 5.9 – Kingpost [RDUAA 2006]... 96
Figure 5.10 – Head of the kingpost in place ... 96
Figure 5.11 – Typical steel tail [ADF]... 96
Figure 5.12 – Pin to hang the truss ... 98
Figure 5.13 – Truss assembled on the table ready to be lifted... 98
Figure 5.14 – Progress pictures of the first truss erection... 99
Figure 5.15 – Side view of a steel tail [ADF 2006]... 101
Figure 5.16 – Misaligned holes ... 102
Figure 5.17 – Damaged bolt... 102
Figure 5.18 – Epoxy injection ... 102
Figure 5.19 – Side view of the middle section of the truss dropped [RDUAA 2006]... 104
Figure 5.20 – End of a 3.5’’ diameter coil cable ... 105
Figure 5.21 – Half of the truss hanging from the rigging system... 106
viii
Figure 5.23 – Roof truss damaged due to the impact ... 106
Figure 5.24 – Rigging system after the incident... 107
Figure 5.25 – Division made by AWC [Structurelam]... 110
Figure 5.26 – September 2006 Schedule ... 112
Figure 5.27 – October 2006 Schedule ... 113
Figure 5.28 – November 2006 Schedule... 113
Figure 5.29 – December 2006 Schedule ... 114
Figure 5.30 – January 2007 Schedule... 114
Figure 5.31 – February 2007 Schedule... 115
Figure 5.32 – March 2007 Schedule... 115
Figure 5.33 – Assembly board... 118
ix
LIST OF TABLES
Table 2.1– Dimensional specifications [BS]... 10
Table 2.2 – Allowable tension capacity for BS connectors ... 17
Table 3.1 – Description of test program ... 28
Table 3.2 – Loading levels for the tests ... 29
Table 3.3 – Summary of Results ... 32
Table 3.4 – Summary of deflections of cantilever for BS-3 tests ... 36
Table 3.5 – Summary of deflections of cantilever end for BS-6 tests... 51
Table 3.6 – Summary of glulam parameters ... 55
Table 3.7 – Summary of tension at the top BS-connector ... 56
Table 4.1 – Adjustment factors for horizontal dowels of BS-3... 65
Table 4.2 – Geometry of the horizontal dowels of BS-3 ... 66
Table 4.3 – Parameters for the calculation of Cg... 69
Table 4.4 – Parameters for the calculation of Z ... 70
Table 4.5 – Summary of the Z values obtained... 71
Table 4.6 – Summary table for the horizontal dowels... 71
Table 4.7 – Parameters for the calculation of Cg for the vertical case... 73
Table 4.8– Summary for the vertical dowel cases... 74
Table 4.9 – Geometry for BS-6 connector dowels ... 77
Table 4.10 – BS-6 edge distance requirements ... 77
Table 4.11 – BS-6 end distance requirements... 78
Table 4.12 – BS-6 requirements for spacing of dowels in a row ... 78
Table 4.13 – BS-6 requirements for spacing between rows... 79
Table 4.14 – BS-6 summary of group action factor Cg... 79
Table 4.15 – BS-6 parameters for reference lateral design value Z ... 80
Table 4.16 – Summary of capacities of the BS-6 connector... 80
Table 4.17 – Calculated capacity for different load durations. ... 81
Table 4.18 – Calculation of the BS-3 and BS-6 capacity, Loading Case #1 ... 83
Table 4.19 – Calculation of the BS-3 and BS-6 capacity, Loading Case #2 ... 84
Table 4.20 – Dowel Penetrations... 85
Table 4.21 – Allowable Tension ... 86
Table 4.22 – Summary of tensions for both BS-connectors ... 86
Table 5.1 – Sequence description... 109
1
CHAPTER 1. INTRODUCTION
1.1 Background
In 2006, the Raleigh-Durham (RDU) Airport Authority started a major construction
redevelopment with the expansion of the Terminal C. Part of the plan is to demolish the old
terminal and create a newer, more sophisticated, and larger capacity terminal. The project is
schedule to be completed in 2010. The new Terminal C will almost triple in size and it will
feature a larger airline check-in, security checkpoint and baggage claim areas. The terminal
will also have a larger variety of new restaurants and shops for travelers.
The structure is combination of wood and steel elements. The roof system is
supported by a series of arched trusses that span from one end of the terminal to the other.
Figure 1.1 shows the lateral view of a typical concourse truss. The project has many types of
trusses with different details; it is not the intent of this study to review all of them, only the
ones in the concourse area. Later, in Chapter 5, a detailed description of Terminal C project
construction will be given. Every truss is a combination of glue laminated wood arches, one
king post in the middle, two steel tails to connect to the columns, and one steel cable for the
tension chord. The connection between the glue laminated arches and the steel members, is
accomplished by a “Bertsche System” connector. In some European countries, this system is
very popular and the behavior of the connection is well known. However, this project is the
2
Figure 1.1 – Typical view of a roof truss [RDUAA 2006]
In February of 2006, the RDU Airport Authority awarded a $358 million contract to
Archer Western Contractors Ltd. as general contractor for the redevelopment of the Terminal
C. The contract required the general contractor to pay for the testing of six specimens to
verify the load capacity of the of the Bertsche connection. This way, design engineers could
ensure that the Bertsche connection would resist the required design loads. North Carolina
State University was chosen by the general contractor to perform the testing at the
Constructed Facility Laboratory (CFL).
1.2 Problem Statement
Bertsche connections have never previously been used in the US. The structural
3
adequate performance. The erection process for the trusses was also a concern for the
contractor. Issues include stability of the arch during handling and erection, assembly with
the cable to form the truss, and maintaining the proposed schedule. The investigation of the
behavior of the connection and the erection process used during construction are the bases of
this study.
1.3 Objectives
In order to respond to the above problem, the following are the objectives for this
study:
• Test the proposed truss connection between the glulam wood arch and the steel arch
tails to determine behavior under require loading.
• Compare the results obtained from tests using the Bertsche connectors and analytical
methods based on the National Design Specification for Wood Construction (NDS)
[AWC 2005].
• Document the construction and erection process of the roof trusses at the RDU
Terminal C expansion project.
• Compare the baseline schedule for the roof truss erection with the actual schedule and
4
CHAPTER 2. REVIEW OF LITERATURE
Chapter 2 will discuss briefly the component of glue-laminated wooden members and
the configuration of the Bertsche system. Some of the history of Glulams and Bertsche
connections, and their relationship, will be addressed on this chapter in order to give an
overview of the system. This Chapter will help to understand the principles of the Bertsche
system.
2.1 Glue Laminated Timber
Glue Laminated Timber commonly known as glulam, have been around for more
than 150 years. But it was not until in 1906, when Otto Hetzer made a breakthrough in the
gluing technique, which made possible to utilize glued timber to create elements with larger
dimensions and spans. A glulam is formed by bonding individual boards together, this
makes possible to overcome the cross-sectional limitation of wood. In 1903 Otto Herzer
patented the “Hetzer beam” which marked the birth of laminated timber construction. The
“Hetzer beam” consisted of a spruce cross section that was sawn open lengthwise in a
parabolic shape. A middle board of beech was placed in the joint and finally this sandwich
was glued together to create the composite cross section [Steurer 2006]. Figure 2.1 shows
how the Hetzer beam was assembled. On June 22 of 1906 the German Government issued
the patent to Otto Hetzer, this date could be known as the birth of the laminated timber
5
Figure 2.1 – Hetzer beam [Steurer 2006]
However, the Hetzer configuration was soon abandoned in favor of glulams produced
with the grain of the laminations parallel to the axis of the member in straight or curved
shapes. This laminating technique allows to manufactures larger and custom made sizes that
were not able to create due to the limitation in size of the regular lumber. Furthermore,
higher strength lumber can be located in part of the beam with higher stress, thus optimizing
6
Architecturally, the biggest advantage of glulam members is that they can be
produced to almost any desired shape and size, from long straights beams to complex curved
configurations. Glulams also offers to architects many opportunities to express their
creativity and artistic concept while satisfying the strength requirements. It is very common
to see the glulam members exposed as an architectural feature due to their warm and pleasing
appearance [APA 2006].
In the US, glued laminated timber is manufactured in accordance with to the
requirements of the American Institute of Timber Construction [AITC A190.1 2002].
Associations such as APA The Engineered Wood Association issue trademarks that help to
ensure the quality of the products that manufacturers produce [APA].
Glulams can be manufactured with any available specie of wood. The most common
species include Douglas fir, larch, spruce, pine, southern pine, yellow poplar, radiant pine
and Norway spruce.
The laminates are arranged in layers in accordance with the product requirements.
Adhesive is applied to each one of the laminates and then clamped together to create either a
straight beam or members with complicated curvatures [Lam & Prion 2003]. The curing
process depends on the glue utilized. Different glues require different conditions. The
curing time, the temperature and relative humidity in the curing location, the pressure applied
to the lams, and the temperature of glue-line varies with different types of glues. After the
curing process is complete, members are cut to the desire shape and then receive a coat of
7
Figure 2.2 – Manufacture of glue-laminated timber [CWC]
2.2 Bertsche System
Glulams are used in the US construction industry very often, what is not commonly
used in North America is the combination of glulam and the Bertsche System. Connections
are the most critical elements of a structure; connections provide structural integrity and
maintain the continuity of the load path. Many times failures can occur because proper
connection detailing has been overlooked. “…a chain is only as strong as its weakest link,
and connections are the critical link between elements of a structure” [Yen 2002].
Proper connections are critical for any timber-framed structure. The bigger these
structures are, the more critical the connections become. Because glulam members can be
shaped to any size, allowing architects and designers to reach longer spans, connections for
glulam members may be even more critical than for regular sawn members. Structural joints
can cost from 5% up to 50% of the glulam member. Connections can dictate the final
8
The most common connection for glulam is the metal plate-pin connection. The
connection consists of a metal plate on each side of the member and bolts or pins through the
plates and the member, creating a connection where the bolts will be subject to shear and
bearing. Figure 2.3 and Figure 2.4 show examples of metal plate-pin connections. However,
architectural considerations sometimes dictate that the joints should be visually attractive
[APA 2007].
Figure 2.3 – Typical plate-pin connection [APA] Figure 2.4 – Typical plate-pin connection [CWC]
Peter Bertsche is the creator of the Bertsche System. The new connection system is
based on the principles of pin-wood or bolt-wood connections. It is similar to a hidden metal
plate-pin connection, which is standard for engineered wood construction. According to
Bertsche in a paper published to present the new connecting system [Bertsche 1993], the
installation and assembly of the Bertsche System is easier to install than metal plate-pin
9
therefore, the assembly at the job site is easier, taking less time. Compared with the metal
plate connection, the load carrying capacity of the Bertsche System is higher and the
displacements are lower, resulting in higher slip modulus [Bertsche 1993].
Figure 2.5 shows a three dimensional view of the BS-2 type connector including the
main components of the system: the dowels, the connector, the bolt, and the
BS-welding block. In the RDU terminal and the test specimens for this project, the BS-welding
block was not used.
Figure 2.5 – BS-connector type 2 [BS]
The BS-connector is the basic component of the system. The BS-connector is made
of forged steel and comes in six different sizes. It is installed in the end grain of the wood
member as shown in Figure 2.5. The BS-connector transfers the tension and compression
forces from the wood member to another member [BS].
Dowels
BS-welding block
BS-bolt BS-connector
10
The BS-connector has a cylindrical shape with pockets on the side to hold the dowels.
Vertical and horizontal dowels transfer the force from the BS-connector to the wood
member. Figure 2.6 and Figure 2.7 show additional views of the BS-connector.
Figure 2.6 – BS-connector type 3 [BS] Figure 2.7 – Six different types of BS-connectors [BS]
The smallest BS-connector (BS-1) is shown in the lower right of Figure 2.7. The
hanger contains a total of four pins one horizontal pair and one vertical pair. The dowels are
installed in pairs. The BS-connector type 6 (BS-6), the largest hanger, contains six pairs of
horizontal and six pairs of vertical dowels, for a total of 24. Table 2.1 summarizes some
geometry specifications depending on the size of the connector.
Table 2.1– Dimensional specifications [BS]
BS-connector Units BS-1 BS-2 BS-3 BS-4 BS-5 BS-6
Depth of bolt penetration (mm) 20±5 30±5 30±5 36±5 42±5 42±5
Length (mm) 185 311 411 511 606 706
Outside diameter (mm) 49 58 63 63 68 68
Depth of the cut hole (mm) 215 340 445 545 645 745
Diameter of the cut hole (mm) 51 61 66 66 71 71
Number of pins Pieces 4 8 12 16 20 24
11
Steel dowels pass through the wood and the BS-connector holding the connector
inside the wood member. For all BS-connector sizes, the pins have 16 mm (0.6299 in)
diameter. The dowel length varies depending on the cross section of the member.
The Bertsche System uses special bolts following the German Standard DIN 912. In
all cases, the bolts used are round head cap bolts (Figure 2.8). The size of the bolt varies
with the size of the BS-connector. The bolt uses spherical washers (Figure 2.9) to avoid
bending on the bolt head. The washers also increase the angle tolerance to four degrees with
respect to the axial direction [BS].
Figure 2.8 – Typical bolt [BS] Figure 2.9 – Typical washer [BS]
Table 2.1 shows that the drilled hole in the wood member is larger in diameter than
the BS-connector. In order to fill the gap between the hanger and the wood, the hole is filled
with BS-grout. Once the connector and dowels are in place, the BS-grout is poured through
two holes in the wood located at each end of the system as shown in Figure 2.5. The ratio of
swelling and shrinking of the BS-grout is neutralized to a large degree. It has a high
compressive strength, impermeable to water, and resistant to frost and deicing salt. Because
the pockets in the BS-connector are larger than the diameter of the dowels, the BS-grout
12
Figure 2.10 through Figure 2.18 illustrate the installation process of the Bertsche
System. The pictures are taken from the manufacturers website.
Figure 2.10 – Locate holes [BS] Figure 2.11 – Drill dowel holes [BS]
Figure 2.12 – Drill the connector hole [BS] Figure 2.13 – Remove chips using comppresed air [BS]
13
Figure 2.16 – Seal end to impede grout [BS]
Figure 2.17 – Place grout [BS]
14
2.3 Calculation Methods
The Bertsche System was developed in Europe. No American standard directly
addresses the calculation of the capacity of the connector. The manufacturer provides the
only source of documentation to calculate the capacity of the connector. One purpose of this
study is to determine if the capacity of the BS-3 and BS-6 connectors can be calculated based
on the methods for dowel type connections in the National Design Specifications for Wood
Construction, which is used in the U.S. [AWC 2005]. The capacity values calculated using
the NDS manual would be compared with the values given by the manufacturer’s tables and
the test results. This section will briefly describe each calculation method used to obtain the
theoretical capacity of the two types of connectors.
2.3.1 National Design Specifications
The National Design Specification for Wood Construction (2005) is the US standard
used to design wood elements and connections. The NDS manual offers two design
methods: the Allowable Stress Design (ASD) method and the Load and Resistance Factor
Design (LRFD) method.
The ASD and the LRFD methods are very similar. The capacity values obtained with
the ASD method are smaller than the values obtained using the LRFD. The ASD method
compares the allowable capacity values with the actual load applied and LRFD method
compares the resistant capacity values with factored loads, therefore, both methods give
15
In a stress-strain curve the allowable values are located in the curve and the resistant
values are close to the maximum capacity. Figure 2.19 shows a typical stress-strain curve.
Figure 2.19 – Typical stress-strain curve
The ASD method uses actual service load magnitudes added to reflect combinations
that may occur. LRFD uses combinations of factored loads as prescribed by ASCE-07
standard [ASCE-07 2005]. The following are examples of basic load combinations when
using the LRFD method from ASCE-07 section 2.3.
1. 1.4(D + F)
2. 1.2(D + F +T) + 1.6(L + H) + 0.5(Lr or S or R)
3. 1.2D + 1.6(Lr or S or R) + (L or 0.8W)
4. 1.2D + 1.6W + L + 0.5(Lr or S or R)
16 6. 0.9D + 1.6W + 1.6H
7. 0.9D + 1.0E + 1.6H
where:
D = dead load E = earthquake load
F = load due to fluids with well-defined pressures and maximum heights H = load due to lateral earth pressure, ground pressure of bulk material
L = live load Lr = roof live load
R = rain load S = snow load
T = self-straining force W = wind load
The ASD and the LRFD methods of the NDS manual will be used to calculate the
theoretical capacity of the BS connector.
2.3.2 Manufacturer’s tables
The manufacturer offers on its website a method to determine the allowable tension
capacity of the of the BS connector depending on the horizontal and vertical penetration of
the dowels. The method uses a table provided by the manufacturer that can be found on the
website.
Table 2.2 is taken from the manufacturer’s website. The table lists the allowable
17
Table 2.2 – Allowable tension capacity for BS connectors
BS connector type [ / ] Horizontal dowel penetration [in] Vertical dowel penetration [in] Allowabl e Tension Capacity [lbf] Slip modulus [lbf/ft] Timber net cross-section without threaded washers [in!]
Timber net cross-section
with threaded
washers [in!]
1 4 4 5536 4.05E+06 8.47 6.77
2 4 4 9078 6.64E+06 7.9 6.19
3 4 4 13366 9.78E+06 7.29 4.64
4 4 4
5 4 4
6 4 4
1 4 1/2 4 1/2 6541 4.79E+06 11.86 10.15
2 4 1/2 4 1/2 11088 8.11E+06 11.28 9.58 3 4 1/2 4 1/2 16381 1.20E+07 10.68 8.03 4 4 1/2 4 1/2
5 4 1/2 4 1/2 6 4 1/2 4 1/2
1 5 5 7546 5.52E+06 15.74 14.04
2 5 5 13098 9.58E+06 15.17 13.46
3 5 5 19396 1.42E+07 14.56 11.91
4 5 5 23706 1.73E+07 14.56 11.91
5 5 5
6 5 5
1 5 1/2 5 1/2 8551 6.26E+06 20.12 18.42
2 5 1/2 5 1/2 15108 1.11E+07 19.55 17.85 3 5 1/2 5 1/2 22411 1.64E+07 18.95 16.3 4 5 1/2 5 1/2 27391 2.00E+07 18.95 16.3 5 5 1/2 5 1/2 30619 2.24E+07 18.42 15.77 6 5 1/2 5 1/2
1 6 6 9556 6.99E+06 25.01 23.3
2 6 6 17118 1.25E+07 24.43 22.73
3 6 6 25426 1.86E+07 23.83 21.18
4 6 6 31076 2.27E+07 23.83 21.18
5 6 6 34974 2.56E+07 23.2 20.65
18
Table 2.2 – Continued
BS connector type [ / ] Horizontal dowel penetration [in] Vertical dowel penetration [in] Allowable Tension Capacity [lbf] Slip modulus [lbf/ft] Timber net cross-section without threaded washers [in!]
Timber net cross-section
with threaded
washers [in!]
1 7 7 11566 8.46E+06 36.28 34.57
2 7 7 21138 1.55E+07 35.7 34
3 7 7 31456 2.30E+07 35.1 32.45
4 7 7 38446 2.81E+07 35.1 32.45
5 7 7 43684 3.20E+07 34.57 31.92
6 7 7 50404 3.69E+07 34.57 31.92
1 7 1/2 7 1/2 12571 9.20E+06 42.66 40.95 2 7 1/2 7 1/2 23148 1.69E+07 42.09 40.38 3 7 1/2 7 1/2 34470 2.52E+07 41.48 38.83 4 7 1/2 7 1/2 42131 3.08E+07 41.48 38.83
5 7 1/2 7 1/2 48039 3.51E+07 40.95 38.3
6 7 1/2 7 1/2 55429 4.05E+07 40.95 38.3
1 8 8 13576 9.93E+06 49.54 47.84
2 8 8 25158 1.84E+07 48.97 47.26
3 8 8 37485 2.74E+07 48.37 45.71
4 8 8 45816 3.35E+07 48.37 45.71
5 8 8 52394 3.83E+07 47.84 45.19
6 8 8 60454 4.42E+07 47.84 45.19
1 8 1/2 8 1/2 14581 1.07E+07 56.93 55.22 2 8 1/2 8 1/2 27168 1.99E+07 56.35 54.65
3 8 1/2 8 1/2 40500 2.96E+07 55.75 53.1
4 8 1/2 8 1/2 49500 3.62E+07 55.75 53.1
5 8 1/2 8 1/2 56749 4.15E+07 55.22 52.57 6 8 1/2 8 1/2 65479 4.79E+07 55.22 52.57
1 8 3/4 8 3/4 15084 1.10E+07 60.81 59.1
2 8 3/4 8 3/4 28173 2.06E+07 60.23 58.53 3 8 3/4 8 3/4 42008 3.07E+07 59.63 56.98 4 8 3/4 8 3/4 51343 3.76E+07 59.63 56.98
5 8 3/4 8 3/4 58926 4.31E+07 59.1 56.45
6 8 3/4 8 3/4 67992 4.97E+07 59.1 56.45
1 9 9 15193 1.11E+07 64.81 63.11
2 9 9 29178 2.13E+07 64.24 62.53
3 9 9 43515 3.18E+07 63.63 60.98
4 9 9 53185 3.89E+07 63.63 60.98
5 9 9 61103 4.47E+07 63.11 60.46
19
Table 2.2 – Continued
BS connector type [ / ] Horizontal dowel penetration [in] Vertical dowel penetration [in] Allowable Tension Capacity [lbf] Slip modulus [lbf/ft] Timber net cross-section without threaded washers [in!]
Timber net cross-section
with threaded
washers [in!]
1 9 1/4 9 1/4 15193 1.11E+07 68.94 67.24
2 9 1/4 9 1/4 30183 2.21E+07 68.37 66.66
3 9 1/4 9 1/4 45023 3.29E+07 67.76 65.11
4 9 1/4 9 1/4 55028 4.03E+07 67.76 65.11
5 9 1/4 9 1/4 63281 4.63E+07 67.24 64.59
6 9 1/4 9 1/4 73016 5.34E+07 67.24 64.59
1 9 1/2 9 1/2 15193 1.11E+07 73.2 71.49
2 9 1/2 9 1/2 30387 2.22E+07 72.62 70.92
3 9 1/2 9 1/2 45580 3.33E+07 72.02 69.37
4 9 1/2 9 1/2 55709 4.08E+07 72.02 69.37
5 9 1/2 9 1/2 65458 4.79E+07 71.49 68.84
6 9 1/2 9 1/2 75529 5.53E+07 71.49 68.84
1 9 3/4 9 3/4 15193 1.11E+07 77.57 75.87
2 9 3/4 9 3/4 30387 2.22E+07 77 75.3
3 9 3/4 9 3/4 45580 3.33E+07 76.4 73.75
4 9 3/4 9 3/4 55709 4.08E+07 76.4 73.75
5 9 3/4 9 3/4 65838 4.82E+07 75.87 73.22
6 9 3/4 9 3/4 75967 5.56E+07 75.87 73.22
1 10 10 15193 1.11E+07 82.08 80.37
2 10 10 30387 2.20E+07 81.51 79.8
3 10 10 45580 3.33E+07 80.9 78.25
4 10 10 55709 4.08E+07 80.9 78.25
5 10 10 65838 4.82E+07 80.37 77.72
6 10 10 75967 5.56E+07 80.37 77.72
Footnotes to Table 2.2
1. Field of application of the BS connectors: Structures of glulam or solid wood (coniferous wood), each according to DIN 1052-1 (April 1988), solid wood at least sorting class S 10 / MS 10.
2. The table values Talw (allowable tension capacity) are valid without any reduction, if:
2.1. solid wood sorting class S 13 and/or glulam BS 14 in the connection are of the BS connectors, or
2.2. solid wood sorting class S 10 and/or glulam BS 11 in the connection area, pins d = 16 mm, max_pin-length < 160 mm without BS-threaded washers, or
2.3. solid wood sorting class S 10 and/or glulam BS 11 in the connection area; pins d = 16 mm, max_pin-length > 160 mm, with BS-threaded washers in the first two pin-lines (BS-threaded washers type KL 35/8 for connector types BS 1 to BS 3 and BS-threaded washers type KL 45/8 for connector types BS 4 to BS 6).
Allowable tension capacity Talw = Talw according to Table 2.2
3. The table values Talw have to be reduced by 15 %, if the assumptions regarding the wood sorting class / pin-length / BS-threaded washers in according to 2.1, 2.2 or 2.3 are not filled.
Allowable tension capacity T’alw = 0.85 x Talw Table 2.2 4. Allowable compression capacity (Tcalw)
20 Table 2.2 – Continued
6. For transportation and erection-states the allowable forces (Talw, T’alw and Tcalw) may be increased by 25 %.
7. In the case of horizontal impacts according to DIN 1055/Part 3 and earthquake loads according to DIN 4149/Part 1 the allowable forces (Talw, T’alw and Tcalw) may be increased by 100 %.
8. In the case of regard of extreme uplift according to DIN 1055/Part 4 the allowable forces (Talw, T’alw and Tcalw) in loading case H may be multiplied with 1.8.
9. Pins without BS-threaded washers can be applied. The according net wood sections distinguish through a weakening at the sectional view DAn (see Table 2.2 column 6 and 7).
10. The proof of the net wood cross-section An can possibly be relevant (with $zalw= allowable tensile stress of the wood parallel to fiber).
Allowable tension capacity Talw= $zalw x An An according to Table 2.2
11. The circumstance of the pin-lengths L1 : L2 applied as supporting must not exceed the value 1 : 1.5 Higher pin-lengths must not be applied in calculation.
The manufacturer requires Grade No.2 for the laminates of the glulam member when
the width of the member is greater than 6 1/3 in. If the grade of the wood member is not met,
the manufacturer requires the use of pins with threaded washers as shown in Figure 2.20. If
the grade of thee wood is not met and the threaded washers are not used, the allowable
capacity must be multiplied by 0.85.
21
Table 2.2 lists the allowable tension for members with the same horizontal and
vertical pin penetrations. When the member does not have a square section, the capacity is
22
CHAPTER 3. TEST PROGRAM
3.1 Introduction
The contract documents for the expansion of Terminal C at RDU Airport specified
that the Contractor had to carry out a full size prototype joint testing program to demonstrate
adequacy of the splice and connector. The main purpose of the testing is to investigate the
behavior of the connection system between wood and steel. The testing program contains
three 2’6’’ deep specimens with BS-3 connectors and three specimens 4’6’’ deep with BS-6
connectors. All the specimens were supplied by AWC.
The test specimens were intended to structurally represent the members used for the
roof structure for expansion of Terminal C at RDU Airport. Equilibrium Consulting, Inc.
(ECI) designed the test specimens and prescribed the load levels. Archer Western
Contractors Ltd. (AWC) contractor for the terminal arranged with the Department of Civil,
Construction, and Environmental Engineering and its Constructed Facility Laboratory (CFL)
to perform the testing. After completing the test, the CFL prepared a report for AWC
presenting the results [Nunez et al 2006].
3.2 Testing Program and Setup
The testing program consisted of three small specimens and three large specimens.
Therefore, a total of six specimens were tested in two configurations. All specimens were
23
The six specimens were tested after being spliced to a steel beam. Two steel beams
were used during testing, one to accommodate the 2’6” nominal depth specimens and one to
accommodate the 4’6” depth specimens. After finishing testing the first specimen of a given
size, the steel beam of the corresponding size was reused for the remaining two specimens in
that group. Once spliced to their corresponding steel portion, the specimens measured 17’5”
and 25’5” from end to end, for the 2’6’’ and 4’6’’ specimens respectively.
Figure 3.1 shows the setup of the small specimen. A BS-3 connector is located in the
top of the splice and a BS-2 connector in the bottom. This setup was design to test the top
connector of the splice.
Figure 3.1 – Test setup for the 2’6’’ deep specimen with BS-3 connector
The steel and wood were joined with BS connectors. Each specimen has a
configuration of two connections, one in the top and one in the bottom. The connector in the
top for the smaller specimen is a BS-3 connector and a BS-2 in the bottom. The large
specimen is spliced with BS-6 connector in both top and bottom. Figure 3.2, taken from the
24
Figure 3.2 – Splice details of the 2’6’’ deep specimen with BS-3 connector [ECI]
Figure 3.2 shows the splice detail of the BS-3 connector setup in a vertical position.
The actual test was oriented horizontally. Figure 3.1 and Figure 3.3 show the actual setup for
the testing of both sizes of specimens. Figure 3.2 abbreviates the Bertsche connector Type 3
as BVD-3. For this study, the connectors will be abbreviated with the letter B and S
followed by the number than correspond to the type of connector, BS-2, BS-3 and BS-6.
25
The splice detail for the specimen with the BS-6 connector is shown in Figure 3.4.
The detail is shown vertically, however, the actual orientation during the test was horizontal.
Figure 3.4 – Splice details of the 4’6’’ deep specimen with BS-6 connector [ECI 2006]
All of the glulam specimens are the same wood species, Douglas fir, with 1"’’ thick
laminations. The cross section for the smaller specimen is 8’’ by 2’6’’ and for the larger is
10"’’ by 4’6’’.
The steel portion of the assembled specimens was strongly post-tensioned to supports,
which were also post-tensioned to the laboratory strong slab. The steel portion was coated a
mixture of lime and water to show any yielding in the steel. No yielding or cracks were
found in the steel sections.
The test configuration allowed the glulam to overhang the front support as a
cantilever and remain tied to the steel portion by the BS connectors in the top and bottom of
the glulam. The load, P, was applied at the end of this cantilever with an electronically
26
resisted by the connection system. The applied load was transferred from the actuator to the
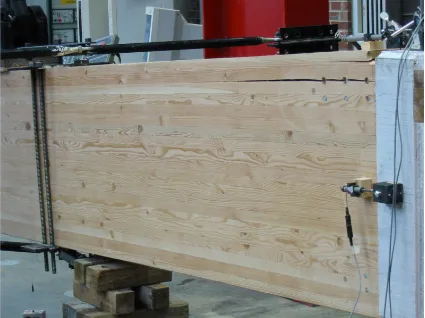
glulam beam through a 10’’ x 10’’ x 2’’ steel plate. Figure 3.5 and Figure 3.6 show pictures
of the test for both specimen sizes. Shear at the splice was transferred by bearing of the
wood in the steel section collar.
Figure 3.5 – Small specimen with BS-3 connector
To avoid lateral buckling and provide lateral stability, the members were provided
with lateral a restrain system. For the small specimen the member was restrained with a
custom built spider leg type of bracing system. The system impeded lateral moment of the
27
restrained laterally with the spider leg system as well, and with the addition of A-frame
braces at both sides of the beam. Teflon pads were installed between the A-frame and the
wood to minimize friction that could cause resistance to the vertical movement.
Figure 3.6 – Large specimen with BS-6 connector
The original testing program established in the proposal was slightly different from
the actual program. In the original program each specimen was to be loaded to three times
the service load or until failure whichever was reached first, for a total of six tests. The
actual testing program consisted of nine tests due to an AWC request to test some specimens
28
Table 3.1 shows a list of the tests performed with a short description of each test and
the date performed.
Table 3.1 – Description of test program
Test
# Specimen Size Connector Top Description of Test of Test Date
1 2’ 6” BS-3 Test of First Small Specimen 10/12/06
1a 2’ 6” BS-3 Retest First Small Specimen with New Washer 10/12/06
2 2’ 6” BS-3 Test of Second Small Specimen 10/13/06
3 2’ 6” BS-3 Test of Third Small Specimen 10/13/06
3a 2’ 6” BS-3 Retest of Third Small Specimen to Failure 10/17/06
4 4’ 6” BS-6 Test of First Large Specimen 10/27/06
4a 4’ 6” BS-6 Retest First Large Specimen to Failure 10/27/06 5 4’ 6” BS-6 Test of Second Large Specimen to Failure 10/31/06 6 4’ 6” BS-6 Test of Third Large Specimen to Failure 11/04/06
3.2.1 Loading Sequence
All specimens were originally to be tested with the same loading sequence. The
loading sequence was based on the service load specified by ECI. The specimens were
cycled to seven levels of loading ranging from 0.2 times to 3.0 times the service load or to
failure whichever occurred first. Table 3.2 shows the seven levels of loading, P, used in most
of the tests. In all the cases, the load was progressively increased to each level. Once a level
was reached, the load was kept at that level for one minute and then the beam was unloaded
29
Table 3.2 – Loading levels for the tests
Cycle # 1 2 3 4 5 6 7
Service Load Ratio 0.2 0.4 0.6 0.8 1.0 1.5 3.0
2' 6" 1.3 kips 2.6 kips 3.9 kips 5.2 kips 6.5 kips 9.75 kips 19.5 kips
Beam Depth
4' 6" 3.1 kips 6.2 kips 9.3 kips 12.4 kips 15.5 kips 23.25 kips 46.5 kips
Two specimens were tested to failure after being tested to 3.0 times service load.
Test #3a, which is the retesting of Test #3, was loaded to the service load, three times service
load, and then to failure. Test #4a, which it was also a retest of Test #4, was loaded to the
service load and then to failure before reaching three times service load.
3.2.2 Instrumentation
Each specimen was instrumented to record displacements in specific places. The
measuring devices used include string and linear potentiometers to record deflections and
displacements, and a load cell to measure the applied load. A data acquisition system was
utilized to electronically record the data.
The instrumentation layout is shown in Figure 3.7. Potentiometers (“pots”) A
through G measured vertical displacement and pots H through K measured relative horizontal
displacement. The purpose of pots A, B and C was to measure any vertical displacement of
the steel portion of the beam. The first two pots should not register any movement. Pot D
measured deflection at the mid-length of the bottom BS connector and pot E measured
deflection one inch from the BS connector end in the wood. Pot F was located directly
30
applied. Pot G measured the relative vertical displacement between the steel portion of the
beam and the wood portion. Four instruments measured relative horizontal displacement
between the steel and the wood at the splice. Pot H is located at the top, pots J and I at mid
height on both sides of the beam, and pot K at the bottom.
Measurements by Pots H through K were used to determine the relative rotation of
the glulam with respect to section across the splice. Both sizes of specimens were tested with
Figure 3.7 – Instrumentation setup for a 4’6’’ deep specimen.
32
3.3 Test Results
The objective of the test was to load the specimens to three times their service load or
to failure whichever was reached first. The results for all nine tests are given in this section.
For the small specimens the results of the tests were very consistent; all behaved similarly.
In contrast, the large specimens behaved somewhat differently in tests but the load capacity
was consistent. Table 3.3 contains a summary of results for all tests.
Table 3.3 – Summary of Results Test
# Specimen Comments Max. Load Summary
1 (First) 2’6” Service 3.0 x No significant visible distress, only minor and infrequent cracking sounds at 3.0 service. 1a 2’6”
(First-Reload)
Reload with new washer
3.0 x Service
No significant visible distress, only minor and infrequent cracking sounds at 3.0 service. 2 2’6”
(Second)
3.0 x Service
No significant visible distress, only minor and infrequent cracking sounds at 3.0 service. 3 (Third) 2’6” Service 3.0 x No significant visible distress, only minor and infrequent cracking sounds at 3.0 service. 3a (Third–Reload) 2’6” Reload to failure Service 3.91 x Splitting failure of Glulam at ultimate with pullout of top BS-3 connector.
4 4’6” (First)
1.85 x
Service Failure of Cup-Shaped Washer at Top Connection 4a 4’6”
(First - Reload)
Reload with new washer
2.98 x Service
Splitting Failure of Glulam with pullout of top BS-6 connector.
5 4’6” (Second)
2.77 x Service
Failure of Cup-Shaped washer and subsequent splitting failure of Glulam with pullout of top BS-6 connector.
6 4’6” (Third)
2.82 x Service
Splitting Failure of Glulam with pullout of top BS-6 connector.
For all data collected, positive deflections are considered downward, longitudinal
displacements are considered positive if it causes the splice to separate, the rotation of the
33
relative vertical motion of the splice is considered positive if the glulam moves down with
respect to the steel portion.
3.3.1 Results for the 2’6’’ Deep Specimens with BS-3 Connectors
A total of five tests were performed on the three small specimens. The first four tests
were loaded to three times the service load. The only specimen taken to failure was the retest
of the third specimen (Test #3a).
3.3.1.1 Service Level Tests
No significant distress was observed during any of the tests performed. The
specimens did not emit any audible sound at service load and no cracks or splits were
observed. At three times the service load, minor cracking and sounds were noted from the
wood in the vicinity of the splice, but visible splits were not found. A small anomaly
occurred in Tests #2 and #3; a slip was observed during the second loading cycle (0.4
service). When the slip occurred the bottom of the splice closed slightly.
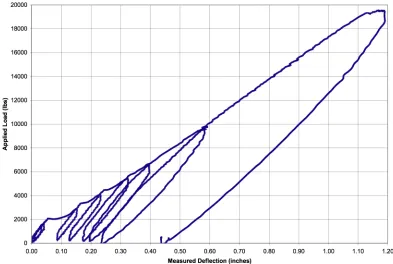
Figure 3.8 through Figure 3.11 illustrate the load-deflection curves for Tests #1, #1a,
#2, and #3. Each curve plots the applied test load versus the measured vertical deflection at
the cantilever end (Figure 3.7, Instrument F), which is located directly underneath the applied
load. The graphs shown in the figures are very similar. All specimens had similar amounts
34
Figure 3.8 – Load vs. deflection of cantilever end, Test #1
35
Figure 3.10 – Load vs. deflection of cantilever end, Test #2
36
All seven loading cycles can be seen in the figures. Figure 3.11 shows that in Test #3
three times the service load (19.6 kips) the deflection at cantilever was 1.25 inches. Test #3
deflected and rotated the most; this may be due to the slip occurred in the second cycle.
In Test #1a, the amount of deflection was lower than in the rest of the tests. As
Figure 3.9 shows, the behavior in Test #1a was more linear than the others. This should be
expected since the first test would cause the wood to be better seated in the steel beam and
the dowels to be better seated in the wood. Table 3.4 contains a summary of deflections at
the seven points of loading cycle. The data for Test #3a extends further since the load was
taken beyond three times service.
Table 3.4 – Summary of deflections of cantilever for BS-3 tests
Deflection at Cantilever (in)
Stage (kips) Load Test #1 Test #1a Test #2 Test #3 Test #3a
Initial Zero 0.00 0.000 0.000 0.000 0.000 0.000
0.2 Service 1.30 0.018 0.033 0.028 0.015 0.014
0.4 Service 2.60 0.057 0.078 0.131 0.218 0.053
0.6 Service 3.90 0.108 0.123 0.208 0.304 0.091
0.8 Service 5.20 0.185 0.187 0.302 0.379 0.143
1.0 Service 6.50 0.264 0.240 0.370 0.450 0.204
1.5 Service 9.75 0.462 0.387 0.575 0.629 0.437
3.0 Service 19.50 1.091 0.844 1.127 1.192 0.836
3.08 Service 20.02 - - - - 0.887
3.38 Service 21.97 - - - - 1.025
3.69 Service 23.99 - - - - 1.259
3.85 Service 25.03 - - - - 2.831
3.91 Service 25.42 - - - - 3.754
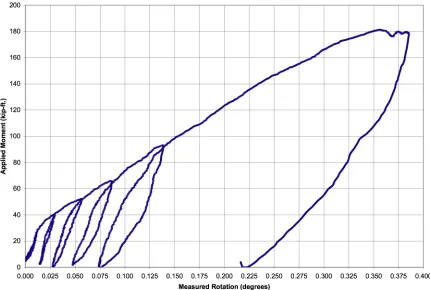
Figure 3.12 through Figure 3.15 show the moment-rotation behavior that occurred in
37
multiplied by the lever arm) versus the rotation at the splice. Rotation was determined from
measurements of longitudinal separation at the top and bottom edge of each splice (motion of
the wood with respect to steel). The longitudinal motion at mid-height of the splice was also
recorded, verifying that the plane splice section remained straight throughout the testing.
38
Figure 3.13 – Moment vs. rotation at splice, Test #1a
39
Figure 3.15 – Moment vs. rotation at splice, Test #3
The Moment-Rotation graphs are similar to the Load-Deflection graphs. The
behavior in all tests is non-linear, and they all have a similar shape with a hysteresis loop.
Each loading and unloading cycle can be clearly identified. At larger load levels, differences
between the loading path and the unloading path were. The loaded beam, due to seating of
the connection deflects, and part of this deflection is not recovered after unloading. Tests #2
and #3 have a very large deflection in the first cycle, which can be due to the slips mentioned
40 3.3.1.2 Tests to Failure
The last test performed on a 2’6’’ deep specimen was a failure test. Since the goal of
three times the service load was reached for specimens 1, 2 and 3, AWC notified NCSU that
they wanted to know the load that would cause failure. Thus, the third specimen was retested
(Test #3a) to determine the failure load. The specimen was loaded until failure occurred by
pull out of the BS-3 connector.
The retest followed similar behavior to that observed in Test #3 up to a level of three
times the service load. Above three times service, longitudinal splitting cracks developed at
the level of the top BS connector on the sides of the member as shown in Figure 3.16.
41
Longitudinal splitting cracks also developed along the top of the glulam as shown in
Figure 3.17. At load levels beyond three times service, significant cracking and splitting
sounds were audible. Failure occurred with extensive deflection of the glulam, rotation of
the joint (Figure 3.18 and Figure 3.19), and loss of load capacity. The maximum load
reached in Test #3a was 3.91 times the specified service load.
42
Figure 3.18 – Load vs. deflection of cantilever end, Test #3a
43
The relative displacement of the glulam with respect to the steel portion was expected
to be positive for all tests. Positive relative displacement indicated that the wood is moving
downward in relation to the steel. However, because longitudinal splitting occured, the top
lamination of the glulam tended to rise recording negative relative displacements (negative is
upward relative motion). Figure 3.20 shows a graph of the relative vertical displacement
versus the load applied for Test #3a.
44
After removing the glulam from the associated beam, it was observed that the BS
connector was pulled out of the face of the wood and the dowels that hold the connector had
been yielded (Figure 3.21).
After removing the BS-connector it was observed that the horizontal dowels
underneath the connector were only partially bent. Apparently, the BS-connector slipped
over the dowels after splitting causing less bending of the three lower dowels (Figure 3.22),
this can be due to longitudinal splitting in the wood.
Figure 3.21 – BS-3 connector after failure
with top of beam cut away Figure 3.22 – Dowel bearing areas after BS-3 connector removed
The small specimen behaved as expected. All tests performed reached three times the
service load without any visible damage. Previous concerns regarding the capacity of the
connector were unfounded, testing shows that the BS-3 connector is able to sustain the
45 3.3.2 Results of the 4’6’’ Deep Specimens
A total of four tests were performed on the three large specimens. Test #4 had to be
retested due to an early failure of the spherical washer. The last three tests failed in the last
cycle, close to reaching the planned termination load.
3.3.2.1 Spherical Washer Failure
Test #4 was the first test performed on a 4’6’’ deep with the BS-6 connector. The test
went according to plan with no visible distress was observed. The loading continued until
1.83 times the service load when a sudden fracture occurred in the spherical washer of the
top BS-connector. Due to the sudden movement of the bolt, there was a significant increase
in the deflection at the loaded end of the cantilever resulting in automatic shutdown of the
loading system. This situation required the termination of the test. Figure 3.23 shows two
pieces of the broken washer after the failure.
46
The remaining piece could not be found. It was determined that the washer used in
Test #4 was installed incorrectly. The washer consists of two pieces, one spherical-shaped
piece that fits into the cup-shaped piece as shown in Figure 3.24. Figure 3.25 shows the
correct and incorrect way of installing the washer. In Test #4 the washer had been installed
incorrectly. The results of Test #4 are not significant and, therefore, are not shown in this
section.
Figure 3.24– Spherical Washer Figure 3.25 – Installation of the spherical washer
3.3.2.2 Tests to Failure
After Test #4 was aborted, AWC determined that the washer had been installed the
47
specimen as Test #4a. The test was the only one that did not follow the normal number of
cycles. Test #4a was tested in two cycles. The first cycle reached 1.0 times the service load,
and the second cycle reached a load of 2.89 time the service load and failed at that level.
Tests #5 and 6 were tested as planned, following the loading sequence shown in Table 3.2.
Tests #4a, 5, and 6, were taken to failure, which occurred somewhat below the
planned test termination load of 3.0 times service. Failure resulted from pull-out of the BS
connector in the top of the beam with cracking and splitting of the glulam in the top
connector area.
The three failure tests of the 4’6’’ specimens behaved similarly. Up to and including
1.0 times service load level, no cracks or splitting was visible, and the specimens were
making only minor popping noises at the top BS connector. At two times the service load,
the cracking and popping noises were louder and heard more frequently. Also this point,
very small splitting became visible on both sides of the glulam member around the top BS
connector. Beyond 2.0 service load the longitudinal cracks grew until all specimens failed
prior to reaching 3.0 times service load.
Tests #4a and #6 failed similarly. Their failure was marked by a rapidly increasing
deflection and gradual loss of load capacity. The BS-connector was pulled out of the glulam
member splitting the wood on both sides and the top.
Test #5 was marked by a sudden fracture of the cup-shaped piece of the spherical
washer at the top BS connector (Figure 3.26). This sudden rupture caused the glulam
member to deflect, resulting in a subsequent drop of load. At this point the glulam was
substantially cracked, and when the washer failed, the shock made the splitting of the wood
48
rupture, and the high level of load applied to the member. After the test, it was verified that
AWC had installed the washer in the correct position.
Figure 3.26 – Fractured washer of Test #5
Figures 3.27 to 3.29 illustrate the load-deflection behavior for Tests #4a, #5, and #6.
Each graph plots the applied test load versus the measured vertical deflection at the cantilever
(Figure 3.7, Instrument F), which is located directly underneath the applied load.
In Test #5 and 6, at 2.0 times service load, the loading was paused momentarily to
observations. A small horizontal segment that can be appreciated on Figures 3.28 and 3.29
49
Figure 3.27 – Load vs. deflection of cantilever end, Test #4a
50
Figure 3.29 – Load vs. deflection of cantilever end, Test #6
Table 3.5 contains a summary of deflection at the cantilever for the first six cycles
and at the point of failure of each test. Test #4a sustained the highest load level by reaching
2.98 service load with a deflection of 3.51 in. No test reached the 3.0 times the service load.
51
Table 3.5 – Summary of deflections of cantilever end for BS-6 tests
Deflection at Cantilever
Stage Load (kips) Test #4 Test #4a Test #5 Test #6
Initial Zero 0.00 0.000 0.000 0.000 0.000
0.2 Service 3.10 0.206 0.180 0.190 0.153
0.4 Service 6.20 0.371 0.348 0.342 0.303
0.6 Service 9.30 0.528 0.490 0.485 0.453
0.8 Service 12.40 0.677 0.632 0.622 0.603
1.0 Service 15.50 0.822 0.766 0.762 0.756
1.5 Service 23.25 1.195 1.090 1.123 1.138
1.85 Service 28.68 1.484 1.330 1.353 1.422
2.0 Service 31.00 - 1.455 1.605 1.602
2.77 Service 42.94 - 2.492 2.325 2.880
2.82 Service 43.71 - 2.628 - 3.108
2.98 Service 46.19 - 3.507 -
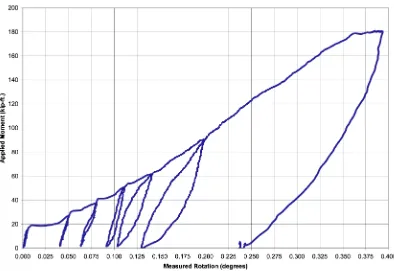
-Figures 3.30 to 3.32 show the moment-rotation behavior for each obtained of the
large specimens. The plots present the applied test moment at the splice face (the applied
load multiplied by the lever arm) versus the rotation at the splice. Rotation was determined
from measurements of longitudinal separation at the top and bottom edge of each splice
(motion of the wood with respect to steel). The longitudinal motion at mid-height of the
splice was also recorded to verify that the plane splice section remained straight throughout
52
Figure 3.30 – Moment vs. rotation at splice, Test #4a
53
Figure 3.32 – Moment vs. rotation at splice, Test #6
The moment-rotation curves are very similar for all tests. The test with the highest
obtained rotation was Test #4a, recording a rotation of 0.656 degrees. For Tests #5 and #6 the
highest recorded rotations were 0.539 and 0.552 respectively.
Figure 3.33 shows the top BS-6 connector of the third 4’6’’ specimen tested (Test #6)
after the glulam was removed from the steel piece. The picture shows how the connector
was pulled out of the glulam member. It also shows the splitting of the wood on the top and
![Figure 1.1 – Typical view of a roof truss [RDUAA 2006]](https://thumb-us.123doks.com/thumbv2/123dok_us/1413348.1173907/13.612.101.527.79.313/figure-typical-view-roof-truss-rduaa.webp)
![Figure 2.1 – Hetzer beam [Steurer 2006]](https://thumb-us.123doks.com/thumbv2/123dok_us/1413348.1173907/16.612.104.536.110.468/figure-hetzer-beam-steurer.webp)