Electronic Theses and Dissertations Theses, Dissertations, and Major Papers
2-15-2019
Thermal management of photovoltaic panel using PCM for
Thermal management of photovoltaic panel using PCM for
improved efficiency and power output
improved efficiency and power output
Joyjit Ghosal University of Windsor
Follow this and additional works at: https://scholar.uwindsor.ca/etd
Recommended Citation Recommended Citation
Ghosal, Joyjit, "Thermal management of photovoltaic panel using PCM for improved efficiency and power output" (2019). Electronic Theses and Dissertations. 7638.
https://scholar.uwindsor.ca/etd/7638
This online database contains the full-text of PhD dissertations and Masters’ theses of University of Windsor students from 1954 forward. These documents are made available for personal study and research purposes only, in accordance with the Canadian Copyright Act and the Creative Commons license—CC BY-NC-ND (Attribution, Non-Commercial, No Derivative Works). Under this license, works must always be attributed to the copyright holder (original author), cannot be used for any commercial purposes, and may not be altered. Any other use would require the permission of the copyright holder. Students may inquire about withdrawing their dissertation and/or thesis from this database. For additional inquiries, please contact the repository administrator via email
using PCM for improved efficiency and power
output
by
Joyjit Ghosal
A Thesis
Submitted to the Faculty of Graduate Studies
Through Mechanical, Automotive, and Materials Engineering
In Partial Fulfilment of the Requirements for
The Degree of Master of Applied Science at the
University of Windsor
Windsor, Ontario, Canada
2019
by
Joyjit Ghosal
APPROVED BY:
______________________________________________
X. Nie
Department of Mechanical, Automotive and Materials Engineering
______________________________________________
G. Rankin
Department of Mechanical, Automotive and Materials Engineering
______________________________________________
A. Fartaj, Advisor
Department of Mechanical, Automotive and Materials Engineering
iii
Joyjit Ghosal. M.A.Sc. Thesis 2019. Dept of Mechanical, Automotive, and Materials Engineering, University of Windsor, CanadaI hereby certify that I am the sole author of this thesis and that no part of this thesis has been published or submitted for publication.
I certify that, to the best of my knowledge, my thesis does not infringe upon anyone’s copyright nor violate any proprietary rights and that any ideas, techniques, quotations, or any other material from the work of other people included in my thesis, published or otherwise, are fully acknowledged in accordance with the standard referencing practices.
iv
Joyjit Ghosal. M.A.Sc. Thesis 2019. Dept of Mechanical, Automotive, and Materials Engineering, University of Windsor, Canada
Abstract
Use of solar energy for electric power generation by means of photovoltaic (PV) cells have shown tremendous growth in recent years due to increased effort to decarbonise the economy as well as for sustainable growth of energy supply. However, low conversion efficiency has been a major issue for commercial application of PV system. Past research has shown that the conversion efficiency drops even further at high operating temperature. Various thermal management techniques to cool the PV cells have shown an increase in cell efficiency.
v
Joyjit Ghosal. M.A.Sc. Thesis 2019. Dept of Mechanical, Automotive, and Materials Engineering, University of Windsor, Canada
Dedicated to –
vi
Joyjit Ghosal. M.A.Sc. Thesis 2019. Dept of Mechanical, Automotive, and Materials Engineering, University of Windsor, Canada
Acknowledgement
At the very outset and foremost I would like to express my most sincere gratitude and thanks to my supervisor Dr. Amir Fartaj for kindly providing me the opportunity to work on this thesis project and for being a guiding light throughout the course of this thesis. His utmost patience, perseverance, resourcefulness and tireless supervision have made possible the completion of this project. It has been an absolute honour to have worked with him which has taught me a great deal about impeccable professional and honourable conduct as well invaluable knowledge about engineering concepts and principles.
I would also like to thank my thesis committee members Dr. Gary Rankin and Dr. Xueyuan Nie for their critical review and valuable advice. I would like to extend my gratitude to Dr. Farid Bahiraei for his valuable suggestions. Special thanks to Dr. Shahram Fotowat for his valuable insights and assistance with the experimental setup at various stages of the work. I would also like to thank Serena Askar for her valuable suggestions and help.
vii
Joyjit Ghosal. M.A.Sc. Thesis 2019. Dept of Mechanical, Automotive, and Materials Engineering, University of Windsor, Canada
Table of Content
Declaration of Originality... iii
Abstract... iv
Dedication...
v
Acknowledgement... vi
List of Figures...
xi
List of Tables... xiv
Nomenclature... xv
CHAPTER 1: INTRODUCTION
11.1 Background...
11.2 Solar power Scenario and Photovoltaic (PV) Cell...
41.2.1 Working principle of a PV cell in brief...
41.2.2 Effect of incident light spectra on the efficiency of a solar cell ...
61.3 Electrical performance of solar cell...
81.4 Thermal management of PV cell...
11.1.4.1 Passive and Active cooling techniques...
131.4.2 Phase Change Materials for thermal regulation of PV cell...
14viii
Joyjit Ghosal. M.A.Sc. Thesis 2019. Dept of Mechanical, Automotive, and Materials Engineering, University of Windsor, Canada
CHAPTER 2: LITERATURE SURVEY AND SCOPE OF PRESENT
WORK
192.1 Passive cooling of PV module...
192.2 Active approach of PV cooling...
192.3 PV-PCM system for thermal regulation...
202.4 Mathematical models and simulation...
222.5 Enhancing thermal conductivity of PCM: ...
232.6 Materials selection...
242.7 Summary of literature survey and scope of the present work...
252.8 Objectives
27CHAPTER 3: THEORETICAL BACKGROUND AND ENERGY
BALANCE
283.1
Background of electrical measurements...
293.2
Temperature coefficient and conversion efficiency correlation...
313.3
Energy exchange and conservation analysis for the PV panel...
333.3.1
Composition of a typical silicon PV cell...
333.3.2
Radiation and convection properties of the surface...
353.3.3
Energy analysis...
363.4
Heat loss rate and heat absorption rate for a PV panel
... 383.4.1
Heat loss rate...
393.4.2
Heat absorption rate...
393.5
Energy analysis for a PV-PCM system
40 3.6Steady state of heat conduction through the PV and PV-PCM system
41 3.6.1Steady state analysis through thermal resistance network...
42ix
Joyjit Ghosal. M.A.Sc. Thesis 2019. Dept of Mechanical, Automotive, and Materials Engineering, University of Windsor, Canada
CHAPTER 4: EXPERIMENTATION - THE-SETUP AND
METHODOLOGY
45
4.1 The experimental set up and scheme of experimentation...
454.1.1 Solar Panel...
474.1.2 Frame structure...
484.1.3 PCM Container...
504.1.4 Lamp system...
534.1.5 Instrumentation and accessories...
534.1.6 Data acquisition system (DAQs)...
554.1.7 Phase Change Material (PCM)...
564.1.8 Circulating fan...
574.2 Estimation of error and uncertainty...
574.3 Details of experimentation...
614.3.1 Experimentation with only solar panel...
634.3.2 Experimentation for thermal regulation with
PV-PCM system...
674.3.2.1 PV-PCM without fins.. ...
684.3.2.2 PV-PCM with internal fins...
684.3.2.3 PV-PCM with internal and external fins...
69CHAPTER 5: RESULTS AND DISCUSSION
705.1
Data reduction and processing...
715.2
V–I characteristics and conversion Efficiency...
735.3
Results for the PV reference system...
775.4
Results for the PV-PCM system...
785.4.1 Experimentation without fins...
795.4.2 Experimentation with fins...
815.5
Electrical output, heat loss and heat absorption...
895.5.1 Electrical output...
89x
Joyjit Ghosal. M.A.Sc. Thesis 2019. Dept of Mechanical, Automotive, and Materials Engineering, University of Windsor, Canada
CHAPTER 6: CONCLUSIONS AND RECOMMENDATIONS
946.1 Conclusions...
94
6.2 Recommendations... 96
REFERENCES
98
APPENDIX-A: VIEW FACTOR FOR RADIATION
105
APPENDIX-B: CALCULATION FOR HEAT CONDUCTION
THROUGH PV/PV-PCM
107
VITA AUCTORIS
109
xi
Joyjit Ghosal. M.A.Sc. Thesis 2019. Dept of Mechanical, Automotive, and Materials Engineering, University of Windsor, Canada
List of Figures
Figure. 1.1: Global energy related CO
2emission...
1
Figure 1. 2: Global Average Net Capacity Addition by type of Energy
Source...
3
Figure 1.3: Present and projected world power generation capacity mix..
3
Figure 1.4: Projected and actual global weighted average capital costs for
solar PV, 2010-2015……….
4
Figure 1.5: Working principle of a photovoltaic cell...
6
Figure 1.6: Spectral intensity distribution in solar radiation...
7
Figure 1.7: Electrical characteristics of a PV cell...
8
Figure 1.8: Typical V-I characteristics of the solar PV array due to change
in incident radiation intensity at constant cell temperature...
9
Figure 1.9: Typical P-V characteristics of the solar PV array due to
change in incident radiation intensity at constant cell
temperature... 10
Figure 1.10: Typical V-I characteristics at different cell operating
temperatures...
10
Figure 1.11: Typical P-V characteristics at different cell operating
temperatures... 10
Figure 1.12: Ttypical variation of cell efficiency in dependence of cell
operating temperature
...11
Figure 1.13: Methods for thermal management of PV cell...
13
Figure 1.14: Working principle of a heat pipe...
14
Figure 1.15: Classification of PCM...
15
xii
Joyjit Ghosal. M.A.Sc. Thesis 2019. Dept of Mechanical, Automotive, and Materials Engineering, University of Windsor, Canada
Figure 2.1: Thermal regulation of PV operating temperature by using
PCM...
21
Figure 3.1: V-I and P-V characteristics of a PV cell...
29
Figure 3.2: Different layers composing a PV cell...
34
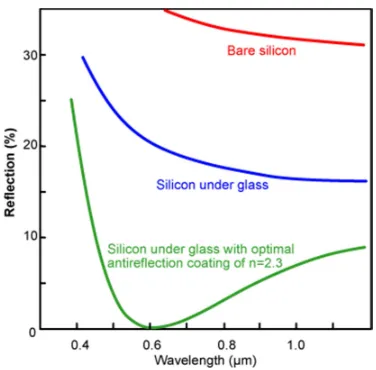
Figure 3.3: Reflectivity property of a PV cell top surface for different
wavelengths of incident radiation...
35
Figure 3.4: Energy exchange, heat transfer and layer components in a PV
cell...
36
Figure 3.5: Solid model view of the PV-PCM system for the present
investigation...
40
Figure 3.6: Energy exchange model of a PV-PCM system...
41
Figure 3.7: Resistance element for steady state heat flow through a body.. 42
Figure 3.8: Steady state resistance circuit across a PV cell indicating
energy flow...
46
Figure 4.1 Schematic of the experimental set up... 46
Figure 4.2: Solar panel front and back showing (a) the locations of
.thermocouple in the front side and (b) major dimensions and
electrical leads at the back side...
47,48
Figure 4.3: The fabricated frame structure for holding PV and PV PCM
system...
49
Figure 4.4: (a) The PCM container with fins (on the internal side of the
back plate), (b) a 3-D solid model and (c) a sectional top view
of the container with fin arrangement...
50,51
Figure 4.5: PV-PCM system (a) with external fins (b) placed in the frame. 52
Figure 4.6: Heat bulbs...
53
Figure 4.7: (a) Pyranometer and (b) Multimeter and Rheostat...
55
xiii
Joyjit Ghosal. M.A.Sc. Thesis 2019. Dept of Mechanical, Automotive, and Materials Engineering, University of Windsor, Canada
Figure 4.9:
MICRONAL® 5528 X paraffin PCM used in the study... 56Figure 4.10: Locations of thermocouple and pyranometer measurement on
the PV panel...
63Figure 4.11: Circuit for electrical measurements...
66
Figure 5.1: Typical incident heat flux distribution on the PV cell front
surface...
71
Figure 5.2: Typical temperature distributions on the PV cell front surface
at an instant of time during PV heating...
72
Figure 5.3 (a) V-I characteristics and (b) P-V characteristics for the
panel...
75
Figure 5.4: Efficiency vs. temperature of the experimental cell...
76
Figure 5.5: Temperature history for the reference PV cell (present
experiment and literature data)...
78
Figure 5.6: Thermal regulation in the present study (without fin) and
literature results (without and with fins)...
80
Figure 5.7: Thermal regulation (with fins) in the present study and
literature results...
82
Figure 5.8 Temperature evolution for the configurations employed in the
present study...
84
Figure 5.9: Column chart for comparison of average temperatures ...
86
Figure 5.10:
Column chart for comparison of thermal regulation period....
89
Figure 5.11: Electrical energy flux output with time for different PV
systems...
91
Figure 5.12: Energy budget with time for a PV reference cell...
93
Figure 5.13: Energy budget with time for a PV-PCM system...
93
xiv
Joyjit Ghosal. M.A.Sc. Thesis 2019. Dept of Mechanical, Automotive, and Materials Engineering, University of Windsor, Canada
List of Tables
Table 1.1: World primary energy demand by fuel in the new policy scenario
(Mtoe)...
2Table 1.2: Comparison table for typical organic, inorganic and eutectic
PCM...
15Table 1.3: Thermo-physical properties of a two representative phase change
materials...
15Table 3.1: Relevant properties of a cell component material and PCM used.
34Table 3.2: Relevant Convection and Radiation quantities...
35Table 4.1: Variables measured and mode of control...
53Table 4.2: Uncertainty values in measurement/calculation...
61Table 5.1: Fin parameters for the present study and literature work...
83Table 5.2:
Comparison table for average PV surface temperature...
85Table 5.3:
Comparison of thermal regulation period... 88xv
Joyjit Ghosal. M.A.Sc. Thesis 2019. Dept of Mechanical, Automotive, and Materials Engineering, University of Windsor, Canada
Nomenclature
A
Frontal area of PV, PCM (m
2)
B
Bias error in measurement
C
PSpecific heat at constant pressure (J/kg/K)
G
Intensity of incident radiation (W/m
2)
G
TTotal global radiation
h
1Heat transfer coefficient (PV front surface) (W/m
2/K)
h
2Heat transfer coefficient (PV back surface), (W/m
2/K)
I
Current (Ampere)
I
scShort circuit current (Ampere)
k
Thermal conductivity (J/m/K)
L
Latent heat of fusion/solidification (J/kg)
m
Mass (kg)
P
Power (Watt)
P
outElectrical power output of the PV panel
P
inPower input to the PV panel (Watt)
P
m,P
maxPower at maximum power point (Watt)
q
Heat flux (W/m
2)
R
Thermal resistance , Electrical Resistance
R
LLoad resistance
T
Temperature (K)
T
ambienceAmbient temperature (K)
T
surroundingTemperature of the surrounding environment (K)
T
mMelting temperature (K)
t
Time (Seconds)
V
Voltage (Volt)
xvi
Joyjit Ghosal. M.A.Sc. Thesis 2019. Dept of Mechanical, Automotive, and Materials Engineering, University of Windsor, Canada
Symbols for Uncertainty Analysis
B
parameter Total bias error in the parameter based on elemental biaserrors, B1, B2, B3.
P
parameter Precision error in the parameterU
parameterUncertainty associated with a parameter
Greek Letters
α
sAbsorptance of panel for solar radiation (dimensionless)
τ
pvTransmittance of PV panel top layer(dimensionless)
ε
glassEmissivity of glass top cover of PV (dimensionless)
η
Conversion efficiency of PV panel (dimensionless)
β
Temperature coefficient of PV conversion efficiency
(%/K)
γ
Temperature coefficient of power of PV panel (%/K)
ρ
Density (kg/m
3), Reflectivity (dimensionless)
Δx
Thickness of PV cell component layer (m)
Δt
Time step (Seconds)
σ
Stephen-Boltzmann constant (W/m
2/K
4)
Subscripts
amb.
Ambient
m, max
Maximum
i
i-th layer in PV cell
ref
Reference condition
xvii
Joyjit Ghosal. M.A.Sc. Thesis 2019. Dept of Mechanical, Automotive, and Materials Engineering, University of Windsor, Canada
Abbreviations
BIPV
Building Integrated Photovoltaic cell
CAAGR
Compound Annual Growth Rate
CSP
Concentrated Solar Power
EVA
Ethylene Vinyl Acetate
Gt
Giga ton
IEA
International Energy Agency
MT
Million Ton
m.p.
Melting point (
0C)
Mtoe
Million ton of oil equivalent
OECD
Organisation for Economic Cooperation and
Development
PCM
Phase Change Material
PV
Photo-Voltaic
PV/T
Photovoltaic-Thermal
RSS Root Sum Squares
STC
Standard Test Condition
1
Joyjit Ghosal. M.A.Sc. Thesis 2019. Dept of Mechanical, Automotive, and Materials Engineering, University of Windsor, Canada
Chapter 1: Introduction
1.1. Background
Generation and use of energy form the backbone of modern civilisation. However, increased awareness about global warming and its harmful effects on the environment has reinvigorated the interest to pursue sustainable clean growth. This has prompted research on improving existing renewable energy technologies as well as developing new technologies for energy generation. Paris Agreement on climate change is in force from Nov. 2016. This agreement is essentially an agreement about one of the most relevant issues of modern times - that of climate change and energy security. Growth in energy-related CO2 emissions stalled completely in 2016 (Figure 1.1). It has been made possible due to increase in conversion efficiency of conventional energy sources and chiefly due to expanded use of renewable energy the world over.
Figure 1.1 Global energy related CO2 emission [1]
International Energy Agency (IEA) has projections of electricity generation growth through 2040 by fuel type (annualized growth rate = 2.0%) as furnished in Table 1.1. It is observed that the contribution from renewable energy sources increases from about 6% to slightly over 10%, but overall the generation mix is not substantially different to what it is now.
2
Joyjit Ghosal. M.A.Sc. Thesis 2019. Dept of Mechanical, Automotive, and Materials Engineering, University of Windsor, Canada
Likewise, Canada also responded to reduce greenhouse gas emission in line with the Paris agreement. On October 3, 2016 the Government of Canada proposed the pan-Canadian framework on clean growth and climate change. Two important core objectives of the framework are to meet Canadian emission targets and to promote innovation and growth by increasing sustainable technology development. A direct consequence of the framework is the carbon pricing due to be implemented in 2018.
Table 1.1 World primary energy demand by fuel in the new policy scenario (Mtoe)[1]
3
Joyjit Ghosal. M.A.Sc. Thesis 2019. Dept of Mechanical, Automotive, and Materials Engineering, University of Windsor, Canada
Figure 1. 2 Global Average Net Capacity Addition by type of Energy Source [1]
By 2040, The world power generation capacity mix in the new policy scenario (Figure 1.3) indicates a staggering 26% of the total generation coming from the combined solar and wind power alone with almost equal share of each.
Figure 1.3 Present and projected world power generation capacity mix [1]
4
Joyjit Ghosal. M.A.Sc. Thesis 2019. Dept of Mechanical, Automotive, and Materials Engineering, University of Windsor, Canada
1.2 Solar Power Scenario and Photovoltaic (PV) Cell
Among renewable energy sources, solar energy has traditionally being viewed as one of the most promising of all sources. Solar PV annual additions surpassed those of wind power for the first time in 2015, with more than 70 GW coming on line, some 50% higher than the previous year. PV’s share of global electricity will reach 16% by 2050 with a projected PV capacity of 4600 GW. Impetus for current and projected rapid growth is due to large scale cost reduction of PV cells (Figure 1.4), thanks to the rapid development in cell technology.
Figure 1.4 Projected and actual global weighted average capital costs
for solar PV, 2010-2015[1]
1.2.1 Working principle of a PV cell
Solar photovoltaic energy conversion is a direct conversion process which generates electrical energy from light energy. According to quantum theory, light is made up of packets of energy called photons. The energy of photon depends only upon the frequency of the light as given by Planck’s equation,
E=hν ...(1.1)
where, h is Planck’s constant and ν, the frequency.
Frequency and wavelength (λ) of radiation are connected by the following equation.
ν=c/λ ..(1.2)
where, c is the velocity of light in vacuum. And hence, Equation 1.1 can also be written as
5
Joyjit Ghosal. M.A.Sc. Thesis 2019. Dept of Mechanical, Automotive, and Materials Engineering, University of Windsor, Canada
Thus, Planck’s Law states that that emitted radiation is directly proportional to the frequency or inversely proportional to the wave length.
Visible photons, incident on a material, excite electrons bound to the solid up to higher energy levels where they are freer to move. This phenomenon is known as the photoelectric effect. Albert Einstein explained this phenomenon using quantum theory. While photoelectric effect acts on a single conducting plate ejecting out electrons, the photovoltaic effect takes place at the interface of two semiconducting materials and electrons accumulate along the boundary creating a voltage.
Albert Einstein discovered that blue or ultra-violet light excites electrons to escape from the surface of a metal. Normally, when light is incident on matter, energy of photons excites electrons to higher energy states within the matter, but the excited electrons quickly fall back to their ground state. To prevent this from happening in a photovoltaic device, built-in asymmetry (P- and N-type semiconductor materials placed together to form the electrode
terminals for external circuit) the photoelectric effect takes place at the interface.
In a photovoltaic cell, two semiconducting materials are fused to create what is called a P-N junction. Commonly, a single material, such as Silicon, is doped with different chemicals to create this junction. If Antimony is doped into Silicon, an N-type semiconductor is created, while doping with Boron makes a P-type semiconductor. Electrons that are knocked out of their orbits accumulate near the P-N junction and increase the voltage across it.
6
Joyjit Ghosal. M.A.Sc. Thesis 2019. Dept of Mechanical, Automotive, and Materials Engineering, University of Windsor, Canada
(a)
(b)
Figure 1.5 Working principle of a photovoltaic cell [2]
1.2.2.
Effect of incident light spectra on the efficiency of a solar cell7
Joyjit Ghosal. M.A.Sc. Thesis 2019. Dept of Mechanical, Automotive, and Materials Engineering, University of Windsor, Canada
Figure 1.6 Spectral intensity distribution in solar radiation [3]
In course of its passage through the atmosphere, some of the light energy with specific energy bands is lost due to absorption by gases, mainly CO2 and water vapour (Figure 1.6). It is also observed that Ultraviolet (UV) range spans from 100 – 400 nm. Visible range of light spans 380-780 nm, while infrared (IR) wavelength ranges from 700 nm to 1000000 nm (or 1 mm).
Photovoltaic effect is sensitive to frequency, ν (or in other words, wavelength, λ) of the incident radiation (Equations 1.1 and 1.3) and hence responds better to sunlight in some zones of the spectrum than the others. After being incident on a conducting material, photons collide with the electrons in the outer shell in the individual atom and if possess sufficient energy, knock them out. Free electrons then circulate through the material.
Planck’s law shows that the energy of the photons is inversely proportional to their wavelength. Shorter wave length thus implies higher energy levels of photons. Sunlight comprises awhole spectrum of radiation, but only those with a short enough wavelength will produce the photoelectric or photovoltaic effect. This means that not all part of the solar spectrum is useful for generating electricity.
8
Joyjit Ghosal. M.A.Sc. Thesis 2019. Dept of Mechanical, Automotive, and Materials Engineering, University of Windsor, Canada
For a voltage to develop across the P-N-junction, the incident radiation must exceed the band gap energy, Eg, which is equal to 1.78 × 10⁻¹⁹ joules. From Plank's equation 1.3, the
wavelength of light corresponding to this energy becomes,
λ = hc/Eg = 1110 nm (frequency ν= c/ λ, h= Plank’s constant)
Thus for enough energy of photon for photoelectric effect, the wavelength of radiation should be less than or equal to 1110 nm. A photon with a wave length of 600 nm, for example, possesses energy of 3.31x10⁻¹⁹ Joules and is more than the band gap energy. The visible light spectrum occurs between 400 and 700 nm, so the bandwidth wavelength for silicon solar cells covers all of the visible range and a part of infrared zone. Thus, it is observed that all of the visible light, UV radiation and some part of the infrared radiation cause the photovoltaic effect for generating electricity. Radiation with a longer wavelength will not be able to produce photovoltaic electricity.
1.3 Electrical performance of solar cell
The electrical performance of a solar cell which acts as a current generator like a battery is broadly assessed through its voltage-current (V-I) characteristics, power-voltage (P-V) characteristics and efficiency. Efficiency of a PV cell is quoted as corresponding to the maximum power condition in the P-V characteristics (Figure 1.7) as given by
𝐸𝑓𝑓𝑖𝑐𝑖𝑒𝑛𝑐𝑦 = 𝑀𝑎𝑥𝑖𝑚𝑢𝑚 𝑝𝑜𝑤𝑒𝑟 𝑜𝑢𝑡𝑝𝑢𝑡
𝐼𝑛𝑐𝑖𝑑𝑒𝑛𝑡 𝑟𝑎𝑑𝑖𝑎𝑛𝑡 𝑒𝑛𝑒𝑟𝑔𝑦 𝑟𝑎𝑡𝑒 𝑖𝑛
Figure 1.7 Electrical characteristics of a PV cell [4]
9
Joyjit Ghosal. M.A.Sc. Thesis 2019. Dept of Mechanical, Automotive, and Materials Engineering, University of Windsor, Canada
of 250C and a solar irradiation incident angle of 45 degrees. When a cell is subjected to incident radiation it attains a temperature established by the thermo-physical properties of the cell (heat absorption by the cell), incident radiation and ambience where an energy exchange process with the surrounding takes place. There are several factors that affect efficiency and operation of PV system. They are as follows.
Absorbed irradiance,
PV cell temperature
PV cell technology
Ancillary equipment
However, the efficiency of a PV cell varies only negligibly with incident radiation but mostly on operating temperature of the PV. Figures 1.8 and 1.9 show the typical variation in I-V and P-V characteristics of a silicon PV cell in dependence of incident radiation while Figures 1.10 through 1.12 show typical variation in I-V, P-V and efficiency characteristics of a typical silicon PV cell as a function of cell operating temperature. These trends are already established in literature.
Fig. 1.8 Typical V-I characteristics of the solar PV array due to change in
incident
10
Joyjit Ghosal. M.A.Sc. Thesis 2019. Dept of Mechanical, Automotive, and Materials Engineering, University of Windsor, Canada
Figure 1.9 Typical P-V characteristics of the solar PV array due to change in
incident radiation intensity
at constant cell temperatureFigure 1.10 Typical V-I characteristics at different cell operating temperature
11
Joyjit Ghosal. M.A.Sc. Thesis 2019. Dept of Mechanical, Automotive, and Materials Engineering, University of Windsor, Canada
Figure 1.12 Typical variation of cell efficiency in dependence of cell operating temperature
1.4 Thermal management of PV cell
Low conversion efficiency of silicon solar cells (15-20%) had been a major stumbling block for its economic use for power generation in the past. The solar energy conversion efficiency of PV panels depends on the three factors [5] namely, solar cell materials, operating temperature and solar radiation intensity (to a lesser extent). In general, the availability of solar radiation, as a natural resource is beyond human control. There is a huge research focus; therefore, on exploring the other two options namely development of newer solar cell materials and maintaining low operating temperatures to improve conversion efficiency. Solar cell operation concerns the ability of semiconductors to convert sunlight (photons) into electricity by exploiting the photovoltaic effect. However, only a fraction of the absorbed solar radiation is converted into electrical energy, the rest being absorbed inside and also dissipated as heat to the outside environment. The maximum possible efficiency is determined by the band-gap of the material. Only those photons which possess energy levels higher than the band-gap yield the photovoltaic effect. Those below are absorbed an dissipated as heat and all excess active photon energy is also absorbed and dissipated as heat [6]. Cell temperature rises on two accounts namely,
1. Electrons and holes indirectly recombine to their original state when they encounter an impurity or defect in the crystal structure or interface releasing thermal energy
2. Absorption of infra-red radiation due to incident irradiation leads to sensible heating of the cell
0 5 10 15 20
0 20 40 60 80
Ef
fc
ie
nc
y
(%
)
12
Joyjit Ghosal. M.A.Sc. Thesis 2019. Dept of Mechanical, Automotive, and Materials Engineering, University of Windsor, Canada
Experimental work in References [7, 8, and 9] establishes that high cell operating temperature reduces the efficiency of a crystalline silicon PV cell at a rate of 0.40-0.65% per deg Celsius rise above the nominal cell operating temperature of 250C. The operating temperature of a PV can be as high as 800C at higher incident radiation intensity. At higher cell temperature, saturation current increases while the voltage developed decrease but the product decreases due to higher degree of voltage decrease compared to increase in current resulting in a decrease in power output [9].
The expression for variation of conversion efficiency in dependence of cell operating temperature is given in [10] as
η (T)= η ref
[
1-β
(T- T
ref)]
..(1.4)Where Tref is reference/characteristic temperature (250 C);
η
ref is the solar cell efficiencyunder reference temperature (usually, 10-18 %, 12% on an average); and β is the temperature-coefficient of efficiency, the average value of about 0.45% /K.
A similar expression for PV power output variation with temperature is given in [10]as
P= GT
τ
pvη
ref A [1-γ
(T- T
ref)]
.
.(1.5)In which GT is the global solar radiation,
τ
pv is the transmittance of the PV cell outside layer,A is the area of solar cell and
γ
is temperature coefficient of power usually in the range of 0.22-0.71% /K.In case of Building Integrated PV (BIPV), Krauter et al [8] reports that the temperature rises to such an extent that a further decrease of 9.3% in power output occurs compared to a non-integrated PV.
This stresses on the need for effective temperature regulation for PV in general and BIPV in particular. Importance of the topic thus, as expected, has attracted research workers world-over and a host of literature is currently available related to thermal management of PV cell.
13
Joyjit Ghosal. M.A.Sc. Thesis 2019. Dept of Mechanical, Automotive, and Materials Engineering, University of Windsor, Canada
have been used for the purpose. Figure 1.13 describes various methods of thermal management.
Figure 1.13 Methods for thermal management of PV cell
1.4.1 Passive and Active cooling techniques
The passive cooling method depends on the three basic heat transfer mechanisms: natural convection, conduction and radiation. Due to less paraphernalia and cost, it is commonly used for the cooling of PV cells particularly in Building-Integrated Photovoltaic Cell (BIPV) application. A duct or air channel behind the PV panel or its mounting system takes heat away through natural circulation or stack effects due to buoyant flow caused by the warming of the external air due to heat transfer from the rear of hot surface of the PV panel. PV panel back surface gets heated up by the heat conducted through the bulk of the PV panel. The front surface of the PV also removes heat through natural convection and radiation exchange with the surrounding. The process of heat transfer is explained in Chapter 3.
Heat pipe cooling is another option in passive cooling. A heat pipe (Figure 1.14) is a heat-transfer device that combines and utilizes both direct conduction heat-transfer and phase change phenomenon to transfer heat between a source and sink. At the hot interface of a heat pipe a liquid comes in contact with the heat source through a thermally conductive solid surface and
Active Cooling
Forced Air Circulation
Water Cooling
Heat Pipe cooling
Passive Cooling
Natural Air Circulation
14
Joyjit Ghosal. M.A.Sc. Thesis 2019. Dept of Mechanical, Automotive, and Materials Engineering, University of Windsor, Canada
turns into a vapour by absorbing heat from that surface. The vapour then travels along the heat pipe at the cold interface by buoyancy, rejects its latent heat to the sink via conduction heat transfer across the cold interface, condenses back into the liquid form and returns to the hot interface either through capillary action, centrifugal force, or gravity, and the cycle repeats. Due to the very high heat transfer coefficients for boiling and condensation, heat pipes are highly effective heat transfer devices.
Figure 1.14 Working principle of a heat pipe [14]
Active approach is primarily a forced convection heat removal employing a pump or a fan. As a consequence, this approach leads to better thermal regulation and increased PV efficiency compared to the passive approach and has better control as well. But this approach involves the parasitic pumping power and maintenance too, thus offsetting somewhat the benefits reaped otherwise. However, this can be cost effective if the heat removed can be utilised in the building services.
1.4.2 Phase Change Materials for thermal regulation of PV cell
A novel approach to passive cooling is to use phase change materials (PCM) which employs the principle of absorbing/releasing high latent heat while keeping the temperature of the material substantially same during the phase change process. Fortunately, a wide choice of PCM is available to suit different applications. Different types of PCM available can be categorised as shown in Figure 1.15.
15
Joyjit Ghosal. M.A.Sc. Thesis 2019. Dept of Mechanical, Automotive, and Materials Engineering, University of Windsor, Canada
Figure 1.15 Classification of PCM [10]
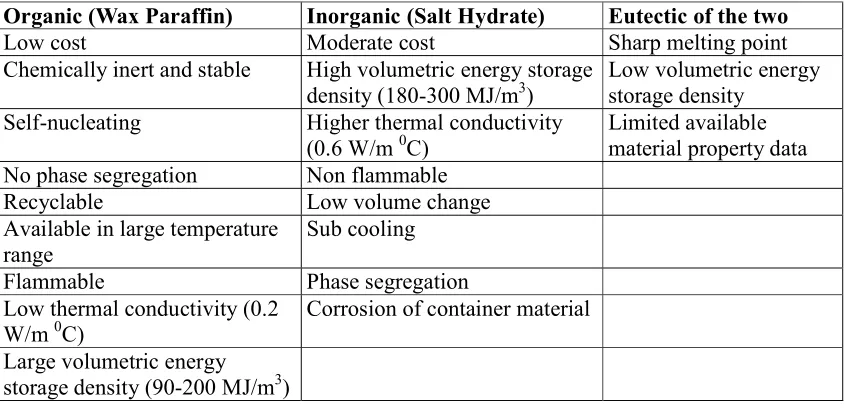
Table 1.2 Comparison table for typical organic, inorganic and eutectic PCM
Organic (Wax Paraffin) Inorganic (Salt Hydrate) Eutectic of the two
Low cost Moderate cost Sharp melting point
Chemically inert and stable High volumetric energy storage
density (180-300 MJ/m3) Low volumetric energy storage density
Self-nucleating Higher thermal conductivity
(0.6 W/m 0C) Limited available material property data
No phase segregation Non flammable
Recyclable Low volume change
Available in large temperature range
Sub cooling
Flammable Phase segregation
Low thermal conductivity (0.2 W/m 0C)
Corrosion of container material
Large volumetric energy storage density (90-200 MJ/m3)
Table 1.3 Thermophysical properties of a two representative phase change materials
Material Salt Hydrate Paraffin
Thermal conductivity (W/m 0C) Specific heat capacity (kJ/kg 0C)
Density (kg/ m3) Viscosity (kg/m.s)
0.60 2.0 1500 0.00184
0.2 2.0 802 0.003
Solidus temperature (0C) 27 38
Liquidus temperature (0C) 32 43
Latent heat of fusion 200 140
16
Joyjit Ghosal. M.A.Sc. Thesis 2019. Dept of Mechanical, Automotive, and Materials Engineering, University of Windsor, Canada
In the past, PCM has been used in many applications as a thermal storage device and for controlling temperature. They have been used in electronic cooling, human body temperature control, refrigeration system, mobile phone, Li-ion battery, to name a few. Integrating PCM with a PV have shown promising results for efficiency enhancement and have engaged the attention of scholars. A typical PV-PCM system is shown in Figure 1.16, following Huang et al [15]. It consists of a metal PCM container, to the front wall of which the back of the PV cell is attached. Heat from the PV cell is absorbed by the PCM and dissipated away to the environment through the back metal plate wall of the PCM container. As a matter of fact, this heat from the back plate can be gainfully utilised for building heating with BIPV system or, during summer, the heat can be absorbed by the PCM from the environment through back plate to keep the environment cool during the night time when sun light is not available for power generation. However, a major problem with PCM is that they have, in general, quite low thermal conductivity. Researchers have used different techniques like placing fins of different configuration, forming metal cells within PCM, mixing highly conducting nano-particles, wire mesh etc.
17
Joyjit Ghosal. M.A.Sc. Thesis 2019. Dept of Mechanical, Automotive, and Materials Engineering, University of Windsor, Canada
1.5 Motivation
The great promise and projected growth of PV cell use combined with government level effort to promote this device for clean power generation has prompted the rapid research growth in the field. It is already noted that by 2050 solar PV technology and system along with wind power will be a major share in global electricity generation.
An advantage of the PV solar energy is that the solar panels are modular in nature and can be connected (in a combination of series and parallel connection) together in such a way that exactly the required quantum of power is delivered. This feature is referred to as “custom made” energy. The reliability and low operations and maintenance costs, as well as modularity and expandability, are enormous advantages of PV solar energy in many rural applications. There are two billion people mostly in rural parts of the world that have no access to electricity and the solar electricity may help them develop their life in a most cost effective manner. Bringing solar electricity to these people represents a huge market potential. Some companies and people have realised that solar electricity can fetch economic benefit now and this fact is probably the real driving force to a widespread development and deployment of the PV solar energy which is further reinforced by government level incentives and efforts towards green energy.
PV power from solar energy is clean, inexhaustible and environment friendly. Development of such a system is considered at present very pertinent with a social contribution. Lot of research is still going on in various aspects of PV technology such as cell material, smart grid integration, integration with wind power, thermal management and manufacturing, among others. One of the important design criteria in the development of an effective solar cell is to maximize its photon to electricity conversion which is adversely affected by rise in cell operating temperature. As such, an open area of active research is thermal management of a PV cell to limit temperature rise. The thermal regulation of PV is the broad area of the current thesis. PCM is a very exciting candidate for thermal management of PV cell and lots of issues are currently hotly researched.
18
Joyjit Ghosal. M.A.Sc. Thesis 2019. Dept of Mechanical, Automotive, and Materials Engineering, University of Windsor, Canada
many other techniques, effect of fins placed inside the PCM container for enhancing heat transfer away from the PV cell is very hotly researched. .
19
Joyjit Ghosal. M.A.Sc. Thesis 2019. Dept of Mechanical, Automotive, and Materials Engineering, University of Windsor, Canada
Chapter 2: Literature Survey and scope of present work
A host of literature is available as to thermal regulation of solar panels. They may be broadly categorised as i) work in the field of conventional passive cooling, ii) Active cooling and iii) cooling with PCM. Both experimental and numerical works have been undertaken while many works relate to mathematical model development. Among research work in the field of PV-PCM system, enhancement of thermal conductivity of PCM has engaged attention of many researchers and various methods of conductivity enhancement like putting conducting fins, wire mesh, nano particles inside PCM have been investigated with promising results.
2.1 Passive cooling of PV module
Yang et al [16] investigated the thermal regulation performance of a PV-wall with air duct using a simulation model (PVWALL-1.0). Brinkworth et al. [17] presented a ‘loop analysis’ approach to estimate the flow rate in naturally ventilated PV system, Commercial CFD software TRNSYS was also used to investigate thermal regulation performance in Batagiannis and Gibbons [10] and Brinkworth et al. [17]. Fossa et al [18] studied an ANSYS model of natural convection in a PV module channel. A recent innovation by Yun et al [19] used ventilated photovoltaic facade in building as a heating device during winter and natural cooling duct during summer.. The results indicate that the temperature of the ventilated PV module rose to a maximum of 55.50 C compared to 76.70 C without ventilation resulting in 15% enhancement in PV efficiency. Heat pipe cooling is another passive cooling method, which delivers heat via working fluid circulation as described in Chapter 1. Anderson et al. [20] experimentally studied the heat pipe cooling of concentrated PV cells. A copper heat pipe passively removed the heat from a PV cell, which was subsequently rejected to ambient air through natural convection
2.2
Active approach of PV cooling:
20
Joyjit Ghosal. M.A.Sc. Thesis 2019. Dept of Mechanical, Automotive, and Materials Engineering, University of Windsor, Canada
improvement by 10.3%. In a novel design, Wilson et al [23] employed gravity-fed cooling water instead of water pump and was flown over the back surface of the PV module. A quick fall in temperature from 620 C to 300 C was noticed and an increase of 12.8% in efficiency could be achieved.
Another approach to active PV thermal regulation is to employ forced air circulation.. Fans are employed to force circulating air through channel. However, systems with heat extraction by air circulation suffer due to the small thermal conductivity, low density and small heat capacity of air. As a result, heat transfer augmentation measures become necessary. Tonui and Tripanagnostopoulos [24] compared performance of natural and forced air circulation. He used fins for heat transfer augmentation. However, parasitic pumping power and maintenance issues are the disadvantages of an active cooling system.
2.3 PV-PCM system for thermal regulation
An innovative approach to passive cooling is to use phase change materials (PCM).. Incorporating PCM in a container and putting it at the back side of a PV panel to take away heat from the PV panel is showing promising results for efficiency enhancement. The principle behind this approach employs the capability of PCM in absorbing/releasing high latent heat while keeping the temperature of the material substantially same during the phase change process. They offer a wide choice of phase transition temperature which facilitates a lot of control on the temperature of the cell. A good review on applications of PCM for energy storage in solar thermal power plant is given in Ben and Li [25]
21
Joyjit Ghosal. M.A.Sc. Thesis 2019. Dept of Mechanical, Automotive, and Materials Engineering, University of Windsor, Canada
Figure 2.1 Thermal regulation of PV operating temperature by using PCM [7]
22
Joyjit Ghosal. M.A.Sc. Thesis 2019. Dept of Mechanical, Automotive, and Materials Engineering, University of Windsor, Canada
Atkin and Farid [34] investigated, among others, effect of placing aluminium fins on the external surface of PCM containers. They found that placing external fins reduced the peak temperature.
2.4 Mathematical models and simulation
In the domain of simulation and mathematical models, a host of articles is available for reference. 1-D finite difference model for A PV-PCM system was developed in [32] and Smith et al [35]. to predict the thermal and electrical performance of the system under different parametric conditions A finite volume based numerical simulation model of non-linear transient 2-D temperature field was developed and implemented by Huang et al. [36]. Conjugate heat transfer was later incorporated while solving the Navier-Stokes equations and Energy equation in [26, 27]. The natural flow arises out of buoyancy in the solid-liquid PCM system. A 3-D numerical model for the purpose was later developed by Huang et al in [26, 36]. A CFD model with an enthalpy approach has been used to model the heat and mass transfer in a PV-PCM system by Biwole et al [38, 39]. More simulation work has been conducted recently. A 2D Ritz-Galerkin model was proposed by Sarwar et al. [40] to simulate the heat transfer phenomena within the PV-PCM system. Park et al [41] developed a transient heat transfer model for the energy simulation program TRNSYS. They predicted power output and the energy conversion efficiency of PV-PCM modules. The commercial package COMSOL MULTIPHYSICS was first used by Cellura et al [42] for analysing a PV-PCM system. The simulation results demonstrate an obviously enhanced energy generation efficiency of the PV-PCM system, when compared with the reference PV system. Their group also developed a finite difference model capable of describing the behaviour of the PV-PCM system as in Ciulla et al [43] and Lo Brano et al [44, 45] and the models were validated against field measurements. In addition, Tanuwijava et al. [46] investigated, via CFD simulations, the heat transfer and thermal management performance of microencapsulated PCMs for PV applications under the conditions of variations of intensity of daily solar radiation.
23
Joyjit Ghosal. M.A.Sc. Thesis 2019. Dept of Mechanical, Automotive, and Materials Engineering, University of Windsor, Canada
The 2D numerical simulation model in [36] predicted that the PV-PCM system can maintain a PV module temperature below 38˚C for one and half hours. The experimental tests by Hasan et al [47] showed that the PV surface temperature remained below 40˚C for approximately 6 hours, if PCMs are used.
2.5 Enhancing thermal conductivity of PCM
24
Joyjit Ghosal. M.A.Sc. Thesis 2019. Dept of Mechanical, Automotive, and Materials Engineering, University of Windsor, Canada
2.6 Materials selection
There is much literature on PCM applications for thermal energy storage and quite a good account is can be found in Jeon et al [51], Khudhair et al [52], Kurnia et al [53], Regin et al [54] and Zalba et al [55]. Hasan et al. [56] reviewed the performances of various PCMs used in BIPV thermal control. The selection criteria for a suitable PCM for its different thermal properties including its melting point, latent heat of fusion and thermal conductivity and different designs and configurations for integration of PV and PCM have been reported. Hasan et al [57, 58] and Makki et al [59] analysed the characterization of organic, inorganic and PCM eutectics incorporated with PV panels. The temperature regulation effect of five different PCMs on solar cell performance was experimentally evaluated at three incident radiation intensity levels. The latent heats of fusion of the five PCMs varied between 170 and 240 kJ/kg while the melting temperatures ranged from 210 to 300 C. Hasan et al. [48], by using the temperature history method (THM), discovered that some potential PCMs were unable to extract latent heat during the discharge process due to low solidification temperatures, while the eutectics of fatty acids, such as Capric–Lauric and Capric–Palmitic, exhibited good performance. Karthik et al [33] used Glauber’s salt for their experiment with BIPV.
The suitable container volume requirement for PCMs so that it can keep a low PV temperature for a longer period of time has also been investigated by Hasan et al [60].
25
Joyjit Ghosal. M.A.Sc. Thesis 2019. Dept of Mechanical, Automotive, and Materials Engineering, University of Windsor, Canada
2.7 Summary of literature survey
From the literature survey it is clear that PV-PCM system has been hotly researched in the past and present decades. However, there is considerable scatter on the results in the literature. Many issues are still open for further investigation. After careful examination of the available literature, it was observed that majority of the studies were deficient in an innovative test set-up in terms of PCM containment and resemblance to actual outdoor conditions during thermal studies. The need was felt for devising a suitable PCM containment which would seamlessly retrofit at the back of the solar panel and could easily be dismantled to change the PCM for experiment purpose at the same time. Further, the previous works focused more on the fluid dynamics behaviour of the PCM and their thermal management capabilities. Electrical performance improvement was tangentially linked to the extent of thermal regulation enhancement rather than experimentally quantifying thermal management enhancement and electrical performance improvement in tandem. Also, the experimental setup varied considerably across studies and this fact had considerable impact on the results.
As evident from the literature survey, fluid flow within the container is inhibited to some extent possibly due to the transverse orientation of the fins forming thermal stratification of the PCM. It is thought that longitudinal orientation of fins could improve the flow due to natural convection within the PCM. However, from the literature survey, no work with longitudinal orientation of fins could be observed to be used by early researchers. In this study, longitudinal fins are used for the purpose of enhancing the natural convection of melt pool over the hot surface of the back of the PV cell as well as in bulk of the melt pool of PCM.
26
Joyjit Ghosal. M.A.Sc. Thesis 2019. Dept of Mechanical, Automotive, and Materials Engineering, University of Windsor, Canada
PCM has fully melted, the fins do not contribute at all to the transfer of heat from the liquid PCM to the back plate because they do not extend up to the back plate thus reducing the heat dissipation from the PCM to the ambience through the back plate during later part of PV heating.
Heat is dissipated away from PV-PCM system from the front PV surface and outside surface of the PCM container back plate. Enhancing heat dissipation from the back plate can be increased by placing external fins. However, no work has been noticed during the literature survey which combines internal fins with external fins. In the present work, therefore, the combination of these two types fin configurations are devised to be investigated (Figure 4.4). In the present investigation, thus, internal fins starting from the back plate and external fins at the outside of the back plate (Figure 4.4) thus complement each one’s function.
It was also observed from the literature survey that all the thermal regulation investigations comprised an energy analyses which were carried out on a ‘dry’ basis i.e. the PV cell was not connected to any load. The electrical energy output along with its changing value (due to changing operating temperature) during the course of thermal experiment would change the temperature condition of the cell and hence energy analysis for predicting the thermal performance should incorporate electrical output.
In the light of the above, the following can be summarised:
i) Tremendous growth of solar PV technology over the last few years as a means to generate clean energy has given impetus for research in this area, the world over. ii) Thermal management of PV panels has shown encouraging results in improving
conversion efficiency at high operating temperature.
iii) Most of the analyses in thermal management with PCM have focussed on temperature regulation without any consideration of concurrent electrical power output which would influence the predicted energy budget and temperature response.
27
Joyjit Ghosal. M.A.Sc. Thesis 2019. Dept of Mechanical, Automotive, and Materials Engineering, University of Windsor, Canada
2.6 Objectives:
In the light of literature review, therefore, thermal regulation is experimentally investigated in the present study. using a PV-PCM system with fins inside and outside the PCM container designed for retrofitting. The main objectives of the thesis are as follows.
i) To study the deterioration in electrical performance of PV cell with rise in temperature under a constant incident radiation heat flux.
ii) To study the enhancement of passive heat transfer and thermal regulation in a PV panel using phase change material.
iii) To investigate the effect of different fin configurations in longitudinal orientation (placed both within and outside) in the PCM container on the time evolution of PV panel temperature as well as on electrical power output in both PV/PCM and finned PV/PCM system.
iv) To study the energy budget for the systems under study incorporating electrical power output during thermal regulation study.
v) To design and develop a solar panel thermal test set-up with data acquisition system and related instrumentation.
vi) To design a PCM container suitable for retrofitting to commercially available solar panels.
28
Joyjit Ghosal. M.A.Sc. Thesis 2019. Dept of Mechanical, Automotive, and Materials Engineering, University of Windsor, Canada
Chapter 3: Theoretical Background and Energy Balance
In this chapter, a theoretical background for the present work and the energy exchange process for both the PV and PV-PCM system with the surrounding are analysed. The energy analysis is carried out to assess the rates of heat absorption and heat loss by the PV reference system as well as PV-PCM system due to the incident radiation. This energy budget information is essential in gaining more insight into the phenomenon of thermal regulation of a PV-PCM system. A steady state heat conduction analysis for the PV and PV-PCM system is also carried out to assess the heat transfer capability of PCM for thermal regulation.
In earlier studies, energy balance analysis considered only the thermal energy exchange of the PV system. However, the concurrent electrical load as output should be included in the analysis as it would alter the overall energy balance. For this, the power (set by rheostat for maximum power condition ) generated by the cell during the entire duration of the thermal experiment is needed to be found out. In the present investigation for temperature response of the PV cell under the influence of constant incident irradiation, the maximum power load setting was made prior to the thermal regulation experimentation. During the process of heating, the maximum power output and hence conversion efficiency decreases due to higher operating temperature. Thus, establishing a correlation of conversion efficiency with temperature is required to determine the maximum electrical power output at each instant of time during the experimentation, the incident radiation energy input being known. In the present investigation, a separate dedicated experimentation for electrical parameter characteristics is carried out for different steady state temperature conditions for the purpose. The correlation is later plugged into the energy balance equation to calculate electrical power output at any instant of time corresponding to the instantaneous temperature condition of the PV cell as obtained from experiment.
29
Joyjit Ghosal. M.A.Sc. Thesis 2019. Dept of Mechanical, Automotive, and Materials Engineering, University of Windsor, Canada
3.1 Background of electrical measurements
Figure 3.1 shows a typical current vs. voltage (V-I) and power vs. voltage (P-V) characteristics of a solar cell. The important electrical parameters of a PV cell include open circuit voltage, short circuit current, maximum power output and panel efficiency which determine the electrical performance of the PV cell. A short description of these quantities is presented as follows.
Figure 3.1 V-I and P-V characteristics of a PV cell [61]
a) Short circuit current (I
sc)):
Short circuit current is the current drawn when the terminals of the PV cell are connected together with only a very short length of very low resistance conductor (ideally the cell terminals brought together and joined) i.e. with almost zero external resistive loads. At this condition, since external load resistance (RL) is zero, the voltage potential (Voutput) used up for driving current (I) through external load resistance (RL) is zero (Voutput = RL*I = 0). All the voltage developed by the cell is consumed to overcome the internal resistance. The output power is thus also zero.
b) Open circuit voltage (V
oc):
30
Joyjit Ghosal. M.A.Sc. Thesis 2019. Dept of Mechanical, Automotive, and Materials Engineering, University of Windsor, Canada
voltage developed is available for any possible external load. Also power output at this condition is zero. For this, voltage across the terminals of the cell is measured when there is no electrical load in the cell. This voltage depends upon the techniques of manufacturing and cell operating temperature but not fairly on the intensity of light and area of exposed surface. Normally, open circuit voltage of solar cell ranges from 0.5 to 0.6 volt.
c) Maximum or Peak power (p
m):
It is the maximum electrical power one solar cell can deliver at its standard test condition. The P-V curve is obtained from V-I data using the relationship P=VI. On the V-I characteristics of a solar cell, maximum power will occur at the drooping point of the characteristic curve. It is shown in the P-V characteristics of solar cell by Pm (or Pmax). To get a comparative picture of the efficacy of different thermal regulation measures adopted in the present investigation, plots of variation of maximum electrical power output with time are presented in Chapter 5.
d)
Panel efficiency :
The efficiency also called the conversion efficiency of a PV panel is defined as the ratio of the maximum electrical power output to the incident radiation power input to the cell. It is expressed in percentage. Mathematically, efficiency of a solar cell is expressed as
𝜂(𝑇) =
=
( )∗ ..(3.1)
where, T is the PV cell temperature, G is the intensity of incident radiation, 𝑃 is the maximum or peak power output as extracted from P-V characteristics under given conditions and A is the frontal area of the panel.
31
Joyjit Ghosal. M.A.Sc. Thesis 2019. Dept of Mechanical, Automotive, and Materials Engineering, University of Windsor, Canada
V-I characteristics at each steady state temperature. From the V-I characteristics, the P-V characteristics are plotted. The maximum power output values are extracted from the P-V characteristics. The conversion efficiencies (corresponding to maximum power values) at each steady state temperature is calculated using Equation 3.1 with measured values of incident radiation (G). Electrical characteristics as obtained in the experimentations are presented in detail in Chapter 5. A temperature correlation of conversion efficiency was obtained by a best fit straight line obtained from the plot of efficiency with temperature. This correlation was subsequently used to calculate the electrical power output of the PV cell at different transient temperatures (measured through DAQs) for the entire time duration for each specific set of thermal regulation experimentation. As already stated, electrical power output calculation forms an integral part of energy budget analysis.
3.2 Temperature coefficient and conversion efficiency correlation
The electrical characteristics (open circuit voltage, short circuit current, peak power and efficiency) of PV cell vary with cell operating temperature as already shown in Figure 1.8 through 1.12. However, for the purpose of energy balance and thermal regulation studies, all changes in electrical parameters may be represented finally through the efficiency parameter which is a function of temperature.
The cell efficiency as a function of temperature is given by,
𝜂(𝑇) = 𝜂 1 − 𝛽 𝑇 − 𝑇 ..(3.2)
where,
η
ref is the cell efficiency at some reference condition of temperature (𝑇 ) andirradiance which is usually the Standard Test Condition (STC) and β is the temperature coefficient of efficiency for the cell obtained from experiment.
Usually, STC refers to a PV cell temperature of 250Cand solar irradiance of 1000 W/m2. The value of
η
ref is supplied by the cell manufacturer. Thus, the conversion efficiency can becomputed if the temperature coefficient β is known.
Temperature coefficient of efficiency, β is given by
32
Joyjit Ghosal. M.A.Sc. Thesis 2019. Dept of Mechanical, Automotive, and Materials Engineering, University of Windsor, Canada
The value of the temperature coefficient, β, can thus be calculated from the slope of the
plot of η vs. T.
Normally, the temperature coefficient value will be supplied by the cell manufacturer and forms the basis of a comparative assessment of temperature dependence of cell efficiency for different cells. Generally, for a polycrystalline solar cell, temperature coefficient is about -0.5%/K. This means the panel will lose half of one percent of its power for every degree temperature rise. In absence of any specific data, an average value of 0.45%/K can be assumed as the temperature coefficient of a solar cell.
In the present study, efficiencies at four different steady state temperature conditions were determined from electrical and irradiation measurements by using Equation 3.1. Variation of the efficiency with temperature T is then plotted from the experimental data. A best fit linear
correlation of the form, η = a + bT, is obtained which yields the slope of the curve
.,
which is the coefficient b in the linear correlation above. The slope being known, the value of the temperature coefficient β is found using equation 3.3. Efficiency value at any temperature can then be calculated from equation 3.2. However, for the purpose of calculating the electrical power output as a function of temperature as used in the energy conservation analysis; instead of using the Equation 3.2, the correlation of the form ( η = a + bT) is more convenient to use. The temperature coefficient β is found only for the purpose of comparing with standard values and any possible deviation therein has been discussed in Chapter 5.
![Figure 1.1 Global energy related CO2 emission [1]](https://thumb-us.123doks.com/thumbv2/123dok_us/1339717.1166918/19.612.154.471.331.485/figure-global-energy-related-co-emission.webp)
![Figure 1.3 Present and projected world power generation capacity mix [1]](https://thumb-us.123doks.com/thumbv2/123dok_us/1339717.1166918/21.612.130.487.64.276/figure-present-projected-world-power-generation-capacity-mix.webp)
![Figure 1.5 Working principle of a photovoltaic cell [2]](https://thumb-us.123doks.com/thumbv2/123dok_us/1339717.1166918/24.612.127.489.70.469/figure-working-principle-photovoltaic-cell.webp)
![Figure 1.6 Spectral intensity distribution in solar radiation [3]](https://thumb-us.123doks.com/thumbv2/123dok_us/1339717.1166918/25.612.151.470.70.313/figure-spectral-intensity-distribution-in-solar-radiation.webp)
![Figure 1.14 Working principle of a heat pipe [14]](https://thumb-us.123doks.com/thumbv2/123dok_us/1339717.1166918/32.612.248.423.195.361/figure-working-principle-heat-pipe.webp)

![Figure 2.1 Thermal regulation of PV operating temperature by using PCM [7]](https://thumb-us.123doks.com/thumbv2/123dok_us/1339717.1166918/39.612.134.422.78.279/figure-thermal-regulation-pv-operating-temperature-using-pcm.webp)
![Table 3.1 Relevant properties of a cell component material [37] and PCM used](https://thumb-us.123doks.com/thumbv2/123dok_us/1339717.1166918/52.612.155.458.70.456/table-relevant-properties-cell-component-material-pcm-used.webp)