ABSTRACT
BRYANT, MICHELLE RENEE. Determining Challenge from Stress and Workload in a Complex Task. (Under the direction of Dr. Anne Collins McLaughlin)
Determining Challenge from Stress and Workload in a Complex Task North Carolina State University
by
Michelle Renee Bryant
A thesis submitted to the Graduate Faculty of North Carolina State University
in partial fulfillment of the requirements for the Degree of
Master of Arts
Psychology
Raleigh, North Carolina 2013
APPROVED BY:
__________________________ __________________________ Dr. Sharolyn Lane Dr. Shevaun Neupert
DEDICATION
BIOGRAPHY
TABLE OF CONTENTS
LIST OF TABLES... vi
LIST OF FIGURES ... vii
INTRODUCTION ... 1
Challenge ... 2
Task Difficulty ... 3
Workload... 4
Challenge as a Function of Workload... 5
Stress ... 5
Challenge as a Function of Stress ... 7
Individual Differences ... 8
Study Overview ... 10
Hypotheses ... 11
METHOD ... 12
Participants... 12
Materials ... 13
Design ... 17
Procedure ... 18
RESULTS ... 18
Overview... 18
Model 1: Performance... 21
Fixed Effects ... 21
Random Effects... 23
Non-significant results ... 24
Further Inspection of Significant Interaction... 24
Model 2: Workload ... 26
Model 3: Stress ... 28
Follow-up Analysis... 31
DISCUSSION ... 31
Stress and Workload ... 31
Individual Differences ... 32
The Experience of Challenge... 34
Limitations ... 35
Theoretical Implications ... 36
Practical Contributions... 37
References... 38
APPENDICIES... 46
Appendix A... 47
Appendix C ... 50
Appendix D... 53
Appendix E ... 55
Appendix F... 58
Appendix G... 61
LIST OF TABLES
Table 1. Descriptive Statistics for Ability Tests (and n’s) and Differences by Age Group ... .19
Table 2. Unstandardized Coefficients (and standard errors) Multilevel Model of Performance... 22
Table 3. Unstandardized Coefficients (and standard errors) Multilevel Model of Workload ... 28
LIST OF FIGURES
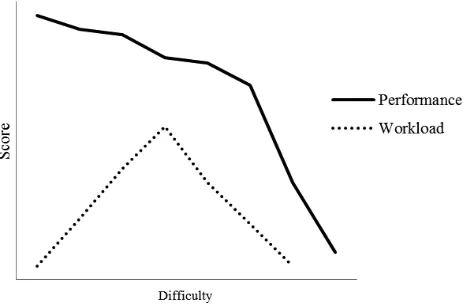
Figure 1. Theoretical Performance and Workload scores by Difficulty... 6
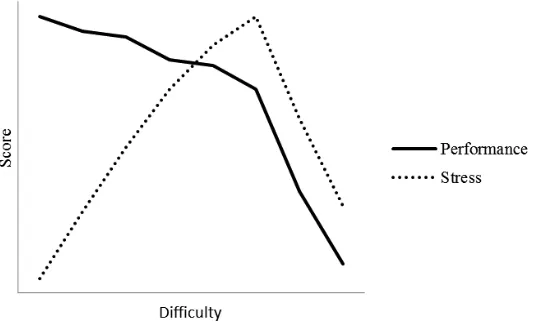
Figure 2. Theoretical Performance and Stress scores by Difficulty ... 8
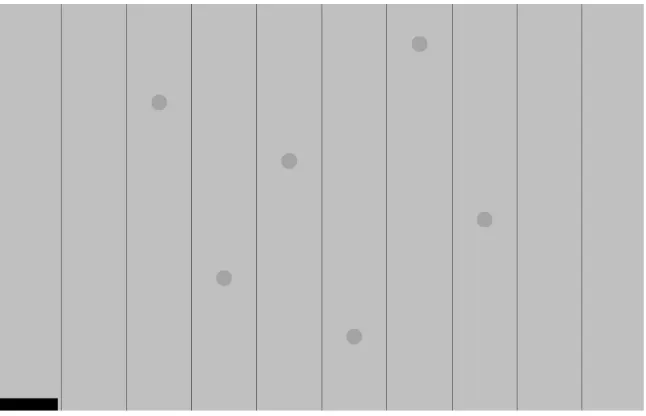
Figure 3. Screenshot of Experimental Task... 15
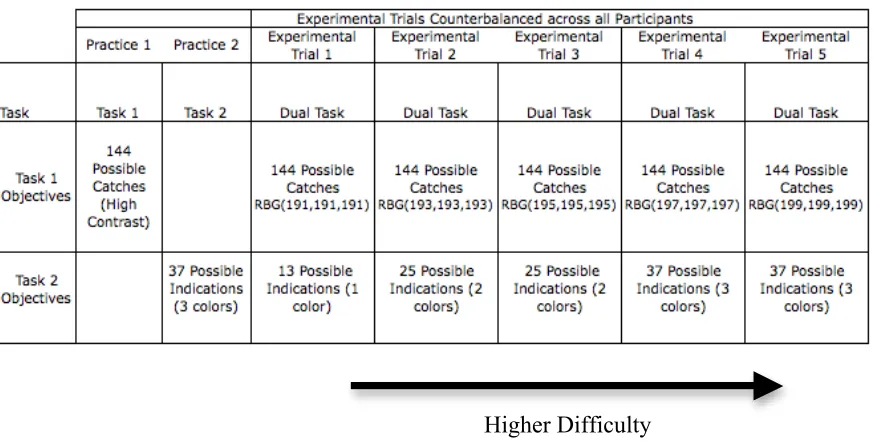
Figure 4. Experimental Task Design ... 19
Figure 5. Age Group × Difficulty Interaction on Performance ... 23
Figure 6. Performance Scores for Each Task by Age Group... 25
Figure 7. Dual-axis Scatterplot of Older Adult Performance for Task 1 and Task 2 Across Difficulty Level ... 25
Figure 8. Bar Graph of Workload Scores Across Difficulty Level by Age Group ... 27
INTRODUCTION
Performance has been at the forefront of human factors research since the inception of the field. The study of subjective factors thought to impact performance has increased in the last 30 years. Subjective workload and stress have been identified as variables that could provide a better understanding of performance. For example, excessive workload negatively affects performance. However, lowering workload too much can result in a vigilance task. This would paradoxically also negatively impact performance by increasing difficulty (Warm, Parasuraman, & Matthews, 2008). Similarly, stress, especially in sustained-attention tasks, has been shown to negatively impact performance (Hancock & Warm, 1989; Lazarus, 1999). In order to verify that considering only stress or workload alone does not fully explain performance, both were measured. This may also lead to an understanding of performance as a function of both subjective workload and stress.
By investigating how workload and stress impact performance it may be possible to predict when performance will decline. Prediction of the point of decline in performance is important for two reasons. First, if performance declines are predictable by measuring workload and stress, tasks can be adjusted for difficulty according to these variables so that performance decline is avoided. Second, it may be possible to find a balance between
Individual differences in performance, however, are likely to be factors of
consideration. Cognitive, perceptual, and motor differences due to age group or personality should be considered when examining workload and stress. Investigating workload and stress through the lens of individual differences allows for a better understanding of these
performance variables and provide for greater external validity. That is, by considering how individual differences affect subjective workload and stress, we may better understand these variables in the greater population.
Challenge
Previous researchers have shown that learning is not measurable by performance change alone (e.g. Newell, 1991; Bjork & Bjork, 2011). Bjork et al. (2011) point out that it is difficult to pinpoint when knowledge has been gained because it is not a directly observable event. However, they agree with Guadignoli and Lee (2004) that challenge (or desirable difficulties) does enhance learning (e.g. distributed vs. massed practice). Since measuring knowledge seems to be so important to the challenge point framework proposed by Guadignoli et al. (2004), it is imperative to find representative, alternative variables by which to measure challenge.
It is proposed that the use of three well-established constructs be used to predict when the experience of challenge occurs; task difficulty, subjective workload, and subjective stress. Tulga and Sheridan (1980) looked at a mathematical equation for predicting subjective workload in participants in relation to performance outcomes. Wickens (1999) proposed that individuals will “off-load” when task difficulty is too high to maintain performance in order to reduce workload. Further, Hancock and Szalma (2008) examined stress as an influencing variable that consumes resources interfering with positive performance outcomes. To this end, by examining each of these three variables results will further challenge research as it relates to performance maintenance.
Task Difficulty
experience as at lower difficulty. To understand the factors affecting performance we must examine the effects of subjective measures such as subjective workload and stress to see where a task might become too difficult for any individual.
Workload
Predictive models of the impact of subjective workload on performance are prevalent in the literature. Overload and under-load (or vigilance) are two such examples. Overload occurs when subjective workload exceeds comfortable levels for the participant. This excess in workload is evidenced by performance declines (e.g., Hockey, 1997). Likewise, in
vigilance experiments where targets are minimal, under-load resource strain is also evidenced by performance declines (Szalma, Hancock, Dember, & Warm, 2006). These findings are important to consider at either end of the task demand spectrum. However, little of the research examining workload has focused on the limits of stable performance.
Understanding performance under very high workload is crucial to understanding limits of stable performance. There are many examples of the need for examining
mental workload. However, once subjects reached a point where many simultaneous tasks were required, they pursued strategies where results were immediate rather than delayed, reducing their immediate subjective workload. These observations support the idea that as task load increases, there is a point where it becomes impossible to plan ahead and obviating this need reduces subjective workload. Further, this adds evidence to the claim of a link between the experience of workload and subsequent performance on a task.
Challenge as a Function of Workload
Just as the association of performance and subjective workload is not simple, neither is the relationship between subjective workload and challenge. Research has not yet examined the connection between challenge and subjective workload reports. Wickens (2002) claimed that by measuring subjective workload we can predict when task demands compete for similar resources. Hancock and Warm (1989) found that just before performance declined individuals reported an increase in subjective workload. Thus, subjective workload may indicate strain on resources just before a task becomes too difficult to maintain performance. This may be closer to an estimate of challenge than performance alone (Figure 1). Using subjective workload reports, we can likely monitor experience of challenge and potentially observe where a task has become too challenging once task-shedding/off-loading begins. However, subjective workload likely does not paint a complete picture of challenge by itself – it is also important to consider stress.
Stress
(1983) explained that this type of stress exists within the participant and occurs when there is a conflict of desired performance and outcomes. For example, a participant is asked to solve problems and must exert high effort while deciding and implementing a particular strategy. When outcomes are unsuccessful for the individual, a stress response will occur.
Figure 1. As task difficulty increases, so does subjective workload, shown hypothetically above. Once a task becomes too difficult, subjective workload should begin to decline due to task shedding. This is a result of the individual reverting to strategies that no longer allow planning. The challenge region of an individual lies just beyond their highest subjective workload where an attempt to compromise between performance stability and adaptability occurs.
reaction to that task. For example, when one appraises the task as threatening his
performance goals, higher levels of stress tend to be reported (Lazarus, 1999). Individual differences such as personality may influence the adaptability of an individual (Hancock & Szalma, 2008) and thus the experience of stress.
Challenge as a Function of Stress
Individual Differences
The effects and interactions of stress, subjective workload, and performance can likely be used to predict challenge, however individual differences that affect each of these variables must also be considered. Factors such as age (e.g., Parker, McDonald, Rabbitt, & Sutcliffe, 2000) and personality (e.g., Lazarus, 1999; Hancock & Szalma, 2008) each have a role in predicting performance, subjective workload, and stress.
Figure 2. As task difficulty increases, so does subjective stress. Once a task becomes too difficult, stress may continue to increase until an individual can no longer conceive performance recovery. This is when stress will begin to decline.
Age. Differences that exist between younger adults and older adults in perceptual
Likewise, as task difficulty increases older adults should report their subjective workload as higher than younger adults (Boyer, Pollack, & Eggemeier, 1992; Ho, Wheatley, & Scialfa, 2005). Thus ability differences should result in experience of higher subjective workload than younger adults when task difficulty is the same.
Taking into account age decrements in cognitive processing capability (see Rogers, 1997 for a review) stress is likely to be reported differently between younger and older adults. If stress is an outcome of the knowledge of incompatibility of task demands and task performance, the attentional resources of older adults may limit the awareness of such incongruity (Sharit & Czaja, 1994) and subsequently influence the experience of challenge. In contrast to this, in laboratory experiments older adults often exert more effort (a measure of workload) to achieve similar performance results as younger adults in the same tasks (Hess & Ennis, 2011) and may be more at risk of negative appraisals as a result (Verhaeghen, Steitz, Sliwinski, & Cerella, 2003). Therefore, their report of stress may be lower due to relative differences in their perception of stress but their subjective workload while performing a task may be higher than younger adults due to the amount of effort required during the task.
Personality. Researchers have found personality-related differences between
individuals in their experience of stress (Bolger & Zuckerman, 1995; Neupert, Almeda, Mroczek, & Spiro, 2006; Salthouse 2004; Szalma, 2009a, b). Young adults who score highly on the neuroticism trait (high-N) have been shown to report significantly higher interpersonal daily stress than those who score low on the neuroticism trait (low-N) (Gunthert, Cohen, & Armeli, 1999). Similarly, research has found that high-N individuals are more vulnerable to stress (Suls, 2001). Lastly, high-N individuals have also been found to be more likely to appraise a situation as threatening (Craske, 1999). Therefore, differences in performance across individuals who are high-N may be more susceptible to negative performance outcomes due to stress.
Study Overview
performance, subjective workload, and subjective stress. Three different models were derived to perform separate analyses for each DV.
Hypotheses:
DV: Performance
1. All participants will perform better on the task at low difficulties compared to high difficulties (Main effect of Difficulty).
2. Younger adults will perform better than older adults on the task in general (Main effect of Age Group).
3. Participants who score highly on the neuroticism trait will perform more poorly than those who score low (Main effect of Neuroticism).
4. Participants who score highly on the neuroticism trait will perform differentially worse at higher levels of difficulty (Interaction of Difficulty and Neuroticism). DV: Workload
1. All participants will report higher workload at higher difficulty levels (Main effect of Difficulty).
2. Older adults will report higher levels of subjective workload than younger adults (Main effect of Age Group).
3. Participants who score highly on the neuroticism trait will report higher workload than those who score low on the neuroticism trait (Main effect of Neuroticism). 4. Controlling for age group, participants who score highly on the neuroticism trait will
DV: Stress
1. All participants will report higher subjective stress levels at higher levels of difficulty (Main effect of Difficulty).
2. Older adults will report lower stress levels than younger adults (Main effect of Age Group).
3. Participants who score highly on the neuroticism trait will report higher stress than those who score low on the neuroticism trait (Main effect of Neuroticism).
4. Participants who score highly on the neuroticism trait will report higher levels of stress at higher levels of difficulty (Interaction of Difficulty and Neuroticism).
METHOD Participants
Younger participants were recruited from undergraduates enrolled in an introductory Psychology course at a large, southeastern university and participants over age 65 were recruited through a database of potential participants maintained by the Learning, Aging, Cognitive, and Ergonomics Lab. A total of fifty-six young adults and twenty-nine older adults were recruited for the study. Ten younger adult participants had to be excluded in the final analysis due to a protocol change with one additional participant excluded for
Materials
Ability Tests. Near vision and normal color vision were both assessed. Color vision
was assessed by selected electronic plates from the Ishihara color test to test for red-green color blindness (Ishihara, 1994). A computerized choice reaction time test was given to highlight age group differences in reaction time.
Participants were administered a computerized Functional Field of View test (FFOV) (Feng, Spence & Pratt, 2007) to measure the range of view outside of a fixation point. Last, participants were given the Mental Rotation Test (MRT) (Peters, Laeng, Latham, Jackson, Zaiyouna, & Richardson, 1995; Vandenberg, & Kuse, 1978) to measure spatial ability. The Ginsburg Functional Acuity Contrast Test (FACT)(Ginsburg, 1984) was administered to measure the peak contrast sensitivity and lowest levels of contrast sensitivity of participants.
Questionnaires. All participants were given a demographics survey (Appendix A)
and exit interview (Appendix E). Each was given to collect information about previous experience and usage rates of computers, and general feelings about playing video games.
International Personality Item Pool-NEO (IPIP-NEO). The IPIP-NEO
(Neuroticism, Extroversion, Openness, and Conscientiousness) (Goldberg, Johnson, Eber, Hogan, Ashton, Cloninger, & Gough, 2006) is comprised of 50 questions that assess an estimate of the participants standing within the five-factor personality model (See Appendix C).
Life-Shortened Stress State Questionnaire. The SSSQ (Helton, 2004) is a
the Dundee Stress State Questionnaire (Matthews, et. al., 1999, 2002). This assessment was given as a measure of baseline subjective stress.
Equipment.The experimental task was performed on IBM-compatible computers (1.80 GHz Pentium Dual-Core, 1.96 GM RAM). Screen size was 19” with a resolution of 1280 x 1024 pixels and a refresh rate of 60 Hz.
Experimental Task. The study required participants to play a 2 dimensional computerized game (Figure 3) in a dual-task paradigm. Task 1 consisted of a game with a bucket that could be moved from left to right at the bottom of the screen. Participants moved the bucket using the right and left arrow keys. From the top of the window, two-dimensional balls fell at a rate where participants were unable to ‘catch’ all of the specified targets. This rate was determined by pilot testing. The goal of the game for each trial was to collect (or ‘catch’) balls that fell from the top of the screen by moving the bucket underneath the ball as it approached the bottom of the screen.
Figure 3. The experimental task was comprised of ten columns from which target balls fall from the top of the screen to the bottom of the screen. The bucket (indicated by a black line at the bottom of the screen) moves both left and right. To ‘catch’ a ball, the bucket must be aligned below the target as it reaches the bottom of the screen. Feedback was provided for a ‘catch’ by flashing the bucket green. Participants move the bucket left and right with the corresponding keyboard arrows.
Each participant completed 1 practice trial for each of the 2 tasks. Practice was
followed by 5 dual-task trials where both tasks were performed simultaneously under varying conditions of difficulty (see Appendix F). During the first practice trial participants only ‘caught’ balls and contrast between balls and the background was high to allow participants to concentrate on learning to use the interface rather than experiencing difficulty due to experimental manipulations. In the second practice trial participants only indicated the color of the target using their left hand on the Z, X, and C keys. Once the experimental trials began, task difficulty was manipulated by changing the lightness values of the balls
determine the appropriate contrast level changes. Contrast was programmed to change using the RGB (x,x,x) units for color value where x is an integer between 0 and 255. The final rate of 2 RBG units of change in contrast level per trial was determined whereby contrast of the targets in experimental trial 5 was the same as the background of the two-dimensional field (RBG level, 199). For task 2, difficulty was manipulated by increasing the number of possible indications from 13 to 37 and from one color to three colors (Figure 4). Each trial lasted approximately 2 minutes. Trials were counterbalanced so that participants did not receive trials from highest contrast to lowest contrast. This ensured that participant’s subjective stress and subjective workload reports were indicative of each trial rather than building throughout the task.
NASA-TLX. A modified computerized NASA-TLX, (Appendix B, Sharek, 2011)
based on Hart and Staveland’s (1988) original assessment, was administered after each trial to assess subjective workload. Participants rated their subjective feelings on 6 dimensions (physical demand, temporal demand, mental demand, performance, effort, frustration). Once participants rated these items they were shown the dimensions in pairs and asked to choose which dimension contributed more to their subjective workload during the preceding trial. Participants took the assessment 8 times throughout testing; once after each practice trial, once between each of the 5 experimental trials and once more following the administration of the FFOV.
Task-SSSQ. This assessment was a modified form of the Life-SSSQ. Modifications
Higher Difficulty
Figure 4. Participants had two practice sessions, one for each task completed in the order presented here. The experimental trials were counterbalanced so that no participant experienced the same order of trials. Difficulty was manipulated by both reducing target contrast and increasing indicating demands.
Design
Performance scores were calculated by adding the sum of correct color indications (ic) and dividing by the total possible indications (ip) which produced an indicating
percentage. Next, the indicating percentage was added to the sum number of balls caught (cc) divided by the total possible catches (cp) (equation below). By calculating the scores using this equation we ensured that both tasks were equally weighted.
(cc/cp) + (ici/ip) = Performance score
Procedure
Once informed consent was collected in the laboratory participants were given the demographics form and then assessed for colorblindness and near vision. All participants took the contrast sensitivity assessment and Life SSSQ followed by a series of ability tests. Then, participants were given instructions on how to complete the experimental task and given the opportunity to ask questions. Participants then completed the practice trials. Once finished, questions were addressed and the participants began the experimental task. After every trial, participants completed the computerized NASA-TLX and SSSQ.
Following this participants completed the FFOV assessment and responded to the Task-SSSQ and NASA-TLX. Last, participants responded to a computerized exit interview, were debriefed, and given course credit or compensation for their time. In general, younger adult sessions took 2 hours to complete while older adults sessions varied from 3 to 4 hours.
RESULTS
Participant demographics, ability test information, and general descriptors may be found in Table 1. Task performance, task stress, and task workload data were examined via multilevel models that incorporated personality, age group, and difficulty as predictors.
Overview
workload and subjective stress at multiple levels it was possible to see intra-individual change or the change that occurs around a participants own average at various levels of difficulty (Neupert, Miller, & Lachman, 2006) and to make inferences about the effects of age group and neuroticism within-person (Lee & Bryk, 1989).
Note: Age was measured in years; contraast sensitivity via Ginsburg (1984); Mental Rotation via Vandenberg and Kuse (1978); Functional field of view (FFOV) at 30 degrees by Feng, Spence and Pratt (2007); Neuroticism via IPIP-NEO; Performance on game was calculated (see results); Workload measured via the NASA-TLX (Hart & Staveland, 1988); Task stress through the SSSQ (Helton, 2004).
Analyzing subjective stress data where estimates of both levels of variability are made, has been touted by Lazarus (2000) as most meaningful because it is the best substitute for a traditionally longitudinal design.
In multilevel modeling, predictors are typically grand mean centered. However, because age group (young adults = 0, older adults = 1) was dichotomous and difficulty had a meaningful zero, neuroticism was the only predictor grand mean centered for this analysis. The basic equation used for the three models presented can be seen below:
Level 1: DVit = β0it + β1it(Difficulty) + rit
Level 2: β0i = γ00 + γ01 (Age Group)+ γ02 (Neuroticism)+ u0i β1i = γ10 + γ11 (Age Group)+ γ12 (Neuroticism)+ u1i
In Level 1, the intercept, β0it, was defined as the expected level of the DV for person i. The difficulty slope, β1, was the expected change in the DV associated with each level of difficulty. The error term, rit, represented a unique effect associated with person i (i.e., how much that individual changed or varied in the DV over difficulty level).
The individual intercepts (β0i) and slopes (β1i) become the outcome variables at Level 2 where the average level of the DV for the sample when difficulty equaled zero was
represented (γ00). The independent contribution of Age Group (γ01) and Neuroticism (γ02) on the DV was also represented in the analysis. This showed whether a main effect of Age Group or Neuroticism on the DV existed. The extent to which people vary from the sample average of the DV was represented by u0i. Further, the extent of change in the DV
Model 1: Performance
A fully unconditional model was employed where only performance was entered as the dependent variable. Results from this analysis indicated that 36% of the variability in performance was between people (Level 2) (τ00 = .03, z = 4.33, p < .001) while 64% of the variability was within-person (Level 1) (σ2 = .05, z = 11.97, p < .001). Results from this analysis determined that there was enough variability at both levels for further analysis of performance.
Model 1 represented the performance hypotheses. The performance equation can be found below:
Level 1: Performanceit = β0it + β1it(Difficulty) + rit
Level 2: β0i = γ00 + γ01 (Age Group)+ γ02 (Neuroticism)+ u0i β1i = γ10 + γ11 (Age Group)+ γ12 (Neuroticism)+ u1i
Fixed Effects.
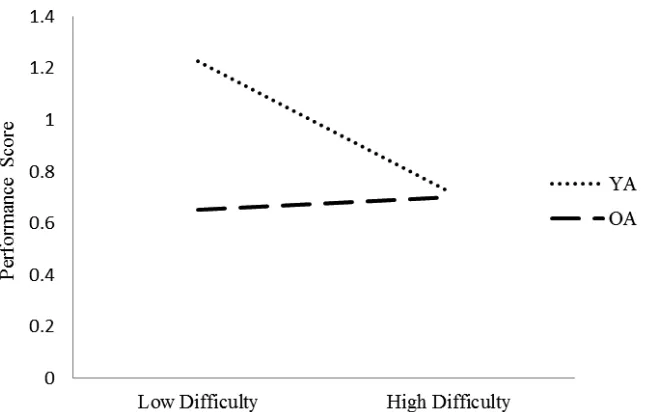
5). When young adults were at lowest difficulty level they performed significantly better than older adults at the same level. Likewise, younger adults out performed older adults
significantly at the highest level of difficulty. The rate of change (slope) that younger adults demonstrated from low to high difficulty was significantly different from older adults.
Figure 5. Age Group × Difficulty interaction on Performance. The units on the y-axis represent performance score out of 2. Points were plotted by conducting a slopes and intercepts model where the estimates are calculated using the means and standard deviations of difficulty and age group. A simple slopes test revealed significant differences between younger and older adult performance rate from low to high difficulty. Tests of contrast show that young adults significantly out-performed older adults at both levels of difficulty.
Random Effects. Participants did vary significantly between-person in performance
This model accounted for 47% of the previously reported 64% within-person variance in performance. Using the Snijers and Bosker (2011) solution for pseudo-R2 values at level 2, a 1- ratio of reduction of ((σ2/n)+ τ00) from the unconditional and conditional model with constrained slopes was calculated: 1 – (constrained/unconditional). Therefore, this model accounted for 2% of the previously reported 36% between-person variance in performance.
Non-significant results. Neuroticism was not significantly related to performance.
There were also no Difficulty × Neuroticism or Difficulty × Age Group interactions. (Table 2).
Further Inspection of Significant Interaction. To further investigate the significant
decrease in performance by younger adults, Performance Score by Difficulty Level was plotted (Figure 6). This showed that older adults did not show variability in performance across dificulty level as expected.
Figure 6. Bar graph of younger and older adult performance score for both tasks out of 2 with error bars. Older adult performance remains relatively stable over difficulty level while younger adult performance decreases at higher levels of difficulty.
Model 2: Workload
Model 2 was derived to best reflect the hypotheses of task workload:
Level 1: Workloadit = β0it + β1it(Difficulty) + rit
Level 2: β0i = γ00 + γ01 (Age Group)+ γ02 (Neuroticism) β1i = γ10 + γ11 (Age Group)+ γ12 (Neuroticism)
Both Difficulty and Neuroticism were constrained to fit the average slope in order to
represent the most parsimonious model. This constraint is represented by excluding u0i , and u1i in the β1i outcome variable at level 2.
A fully unconditional model was conducted where no predictors were entered in the model. This concluded that 53% of the variance in workload was between-person (level 2) (τ00 = 133.91, z = 4.96, p < .001) while 47% of the variance was within-person (level 1)( σ2 = 120.63, z = 11.83, p < .001). This was a sufficient amount of variability to warrant further analysis.
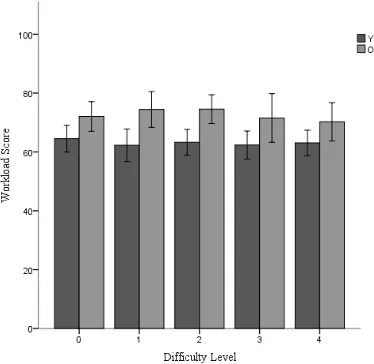
Fixed Effects. As predicted, age group was significantly related to workload (γ01 =
10.04, t = 3.06, p = .003) (Table 3). Therefore, on average older adults reported more workload than younger adults (Figure 8).
Random Effects. Participants varied significantly between-person in reports of
Figure 8. Bar graph of younger and older adult workload scores with error bars across difficulty level. Younger and older adults showed little variance over difficulty level. However, younger adults reported significantly lower workload than older adults at all levels of difficulty. Error bars illustrate the significant within person variance in workload within person. Comparison of error bars between age groups illustrate significant between-person variance.
Non-significant results. Difficulty and Neuroticism were not significantly related to
Model 3: Stress
Model 2 reflected the hypotheses of stress and is seen below:
Level 1: Stressit = β0it + β1it(Difficulty) + rit
Level 2: β0i = γ00 + γ01 (Age Group)+ γ02 (Neuroticism)+ u0i β1i = γ10 + γ11 (Age Group)+ γ12 (Neuroticism)
This model represents the same justifications for constraining Difficulty and Neuroticism as was done in the workload model.
(τ00 = .006, z = 3.24, p < .001) of the variance was between-person, and 80% (σ2 = .022, z = 11.94, p < .001) of the variance was within-person. This provided evidence of enough variability at both levels to continue analysis.
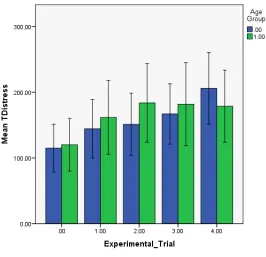
Fixed Effects. As predicted, Age Group was significantly related to Stress (γ01 = -.13,
t = -4.26, p <.001) (See Table 4). Therefore, on average older adults reported less stress than younger adults (Figure 9).
Figure 9. Bar graph of younger and older adult stress scores with error bars across difficulty level. Younger and older adults showed little variance over difficulty level. However, younger adults reported significantly higher stress than older adults at all levels of difficulty.
Random Effects. Participants significantly varied between themselves in their reports
Stress (τ11 = .001, z = 11.79, p < .001). Therefore, participants varied in reported stress based on their age group.
Non-Significant results. Neuroticism and Difficulty were not significantly related to
stress. There were also no Difficulty × Neuroticism or Difficulty × Age Group interactions (Table 4).
Follow-up Analysis
A Pearson’s r correlation was conducted to determine if there was a significant relationship between subjective workload and subjective stress. Results indicated no significant relationship between workload and stress (r = -.44, n = 348, p = .21).
DISCUSSION
This study measured workload and stress under varying levels of difficulty to determine the role of age group and neuroticism in performance. In general, all participants performed better when difficulty was low. Younger adults performed worse when difficulty was high. Older adult performance remained relatively stable across difficulty. As predicted, older adults reported significantly higher workload across all difficulty levels than younger adults. Also, older adults reported significantly lower stress across all difficulty levels than younger adults. There was no relationship found between the report of workload, stress or performance for those participants who scored highly on the neuroticism trait.
Stress and Workload
In general, it was expected that participants would report higher workload and stress at higher levels of difficulty. This was not found to be true in this study. Rather, participants reported relatively stable experiences of workload and stress for the duration of the
experimental task. A possible explanation of this finding is that task demands did not change enough by difficulty level to result in a change in the experience of workload and stress for the sample. For example, workload definitions typically include some aspect of task demands versus mental resource capacity (e.g., Eggermeier, Wilson, et al., 1991). If the change in difficulty level did not result in a noticeable difference of resource capacity requirements, participants would feel the same mental strain and report similar feelings of workload across all difficulty levels. A similar concept may also apply to stress. That is, since there was no noticeable change in goals or ability to attain those goals (Sanders, 1983), participants would not experience any change in the feelings of stress across difficulty levels.
Individual Differences
In an effort to accurately measure the influence of stress and subjective workload on
analysis into possible coping mechanisms employed (Matthews, 2001; Teo, et. al., 2011) that may explain differences found in performance. If personality and coping differences arise in stress research, we expect to also see differences in how subjective workload is experienced.
Though this was not an outcome found here, it is important to continue to research this area so that we might better understand how personality traits may influence individuals who are managing high stress and subjective workload to compensate for task difficulty.
Age group did significantly influence performance in this study. As noted in the introduction, aging influences in cognitive and motor ability were highlighted by our results in two ways. First, the performance rate of younger and older adults at the lowest difficulty level were significantly different where younger adults outperformed older adults. Second, at the highest difficulty level, older adults exhibited task switching behavior. This would
support subjective workload literature (Wickens, 2002) where offloading of tasks occurs when task demand limits are reached. . While age group was a significant predictor of performance, there remained a significant amount of performance variance to be explained within subjects. This supports the examination of repeated measures such as subjective workload and subjective stress.
Stress was also reported differently for younger and older adults. Previous research has shown that older adults frequently rate stressful events as less stressful than younger adults (Almeida & Horn, 2004). These findings were supported by this study underscoring the hypothesis that subjective stress should be measured independently of subjective workload as it was experienced differently by age group.
The Experience of Challenge
It was expected that by measuring subjective workload, it would have been possible to predict when the task was too difficult to maintain performance once task demands exceeded resource capability. Although subjective workload varied significantly within- person, between-person and as a function of age group, it did not change significantly over difficulty level. By understanding each of these findings it may be possible to inform the use of subjective workload as a proxy for challenge.
since older adults’ subjective workload was reported significantly higher than younger adults. Taken together, these findings reflect two primary requirements of using workload as a proxy for challenge; 1) workload must vary as a function of difficulty, and 2) workload must vary between-persons at the person level. If both of these conditions are satisfied, we may come closer to using subjective workload as one side of the experience of challenge.
The second side of challenge was to measure subjective stress. It was expected that as task difficulty increased, so would task stress. This relationship was not observed. Moreover, stress did not change significantly over difficulty level for either age group. However, just as was found for workload, significant within-person, between-person and between group variance was observed. Each of these findings underscores that the requirements outlined for workload also apply to stress as a proxy for challenge: 1) stress must vary as a function of difficulty, and 2) stress must vary between persons at the person level. By meeting both of these requirements, stress may be used as a way to observe when an individual is
experiencing challenge. Limitations
A basic limitation of this study was the unequal sample sizes. Second, an unintended consequence of the study was the differential amount of time spent in the appointment session for older and younger adults. Although time spent in the experimental task was very similar, future studies should control for total time spent in session.
mental strain is more overt. This change in task demands may allow for more fluctuation in feelings of subjective workload as difficulty is manipulated. Second, it may be necessary to ensure individuals are stable within themselves in their reports of both subjective stress and workload. That is, subjective stress and workload reports should change as a function of difficulty.
Finally, it would be advantageous to include pre-established performance goals at each difficulty level. This protocol would clearly present performance goals at the start of the task. This approach may allow stress to be more fully realized at difficulty levels where participants are unable to reach those pre-established goals.
Theoretical Implications
This study was the first to attempt to measure subjective workload and stress where individuals experience a point in a task where their performance was no longer maintained due to a change in difficulty. It was expected that this would result in high levels of
Practical Contributions
References
Ackerman, P. L. (1987). Individual differences in skill learning: An integration of
psychometric and information processing perspectives. Psychological Bulletin, 102(1), 3-27. doi:10.1037//0033-2909.102.1.3
Almeida, D. M. (2005). Resilience and vulnerability to daily stressors assessed via diary methods. Current Directions in Psychological Science, 14(2), 64-68.
doi:10.1111/j.0963-7214.2005.00336.x
Almeida, D. M., & Horn, M. C. (2004). Is daily life more stressful during middle adulthood? In R. C. Brim, O.G., Ryff, C.D., Kessler (Eds.), How healthy are we? A national study of well-being at midlife (pp. 425-451). Chicago, IL: University of Chicago Press.
Ball, K., Beard, B., Roenker, D., Miller, R., & Griggs, D. (1988). Age and visual search: expanding the useful field of view. Journal of the Optical Society of America, 5(12), 2210-2219.
Boyer, D. L., Pollack, J. G., & Eggemeier, F. T. (1992). Effects of aging on subjective
workload and performance. Human Factors Society 36th Annual Meeting (pp. 156-160).
Charles, S. T., & Almeida, D. M. (2007). Genetic and environmental effects on daily life stressors: more evidence for greater variation in later life. Psychology and aging, 22(2), 331-40. doi:10.1037/0882-7974.22.2.331
Craske, M. G. (1999). Worry, Anxiety, and Fear and Imminence of Threat. In Anxiety disorders: psychological approaches to theory and treatment (pp.1-29). Boulder, Colorado: Westview Press.
Czaja, S., & Sharit, J. (1993). Age differences in the performance of computer-based work.
Psychology and Aging 8(1), 59-67. doi: 10.1037/0882-7974.8.1.59.
DeYoung, C. G., Peterson, J. B., & Higgins, D. M. (2005). Sources of
Ericsson, K. A., & Lehmann (1996). Expert and exceptional performance : Evidence of maximal adaptation to task constraints. Annual Review of Psychology 47, 273-305.
Eggermeier, F. T., Wilson, G. F., et al. (1991). Workload assessment in multi-task environments. In Damos, D. L. (Ed.), Multiple task performance, (pp. 329-360).
London : Taylor and Francis.
Faubert, J. (2002). Visual perception and aging. Canadian Journal of Experimental Psychology, 56(3), 164-76. Retrieved from
http://www.ncbi.nlm.nih.gov/pubmed/12271747
Feng, J., Spence, I., & Pratt, J. (2007). Playing an action video game reduces gender differences in spatial cognition. Psychological Science, 18(10), 850-55.
Fozard, J. L., & Gordan-Salant, S. (2001). Changes in vision and hearing with aging. In Birren, J. E., and Schaie, K. W. (Eds.), Handbook of the Psychology of Aging, (5th Edition, pp. 241-260). San Diego: Academic Press. Inc.
Ginsburg, A. P. (1984). A new contrast sensitivity vision test chart. American Journal of Optometry and Physiological Optics, 61(6), 403-407.
Goldberg, L., Johnson, J., Eber, H., Hogan, R., Ashton, M., Cloninger, C., & Gough, H. (2006). The international personality item pool and the future of public-domain personality measures. Journal of Research in Personality, 40(1), 84-96.
doi:10.1016/j.jrp.2005.08.007
Guadagnoli, M.A., & Lee, T. D. (2004). Challenge Point: A framework for conceptualizing the effects of various practice conditions in motor learning. Journal of Motor Behavior,
36(2), 212-224.
Haga, S., Shinoda, H., & Kokubun, M. (2002). Effects of task difficulty and time-on-task on mental workload. Japanese Psychological Research, 44(3), 134-143. doi:10.1111/1468-5884.00016
Hancock, P. A. (1986). The effect of skill on performance under an environmental stressor.
Aviation, Space, and Environmental Medicine, 57(1), 59-64.
Hancock, P. A. (2009). Performance on the very edge. Military Psychology, 21(sup1), S68-S74. doi:10.1080/08995600802554680
Hancock, P. A., & Szalma, J. (2008). Performance Under Stress. Hancock, P. A., Szalma, J., (Eds.). Burlington, VT.: Ashgate Publishing Company.
Hancock, P. A., & Warm, J. S. (1989). A dynamic model of stress and sustained attention.
Human Factors, 31(5), 519-37. Retrieved from http://www.ncbi.nlm.nih.gov/pubmed/14552346
Hart, S. G., & Staveland, L. E. (1988). Development of NASA-TLX (Task Load Index): Results of empirical and theoretical research. In Hancock, P. A. (Ed.), Human and
Mental Workload. Amsterdam: North-Holland.
Helton, W. S. (2004). Validation of a short stress state questionnaire. Human Factors,
48(11), 1238-1242. doi:10.1177/154193120404801107
Ho, G., Wheatley, D., & Scialfa, C. T. (2005). Age differences in trust and reliance of a medication management system. Interacting with Computers, 17(6), 690-710. doi:10.1016/j.intcom.2005.09.007
Hockey, G. R. (1997). Compensatory control in the regulation of human performance under stress and high workload; a cognitive-energetical framework. Biological Psychology,
45(1-3), 73-93. Retrieved from http://www.ncbi.nlm.nih.gov/pubmed/9083645
Kang, N. E., & Yoon, W. C. (2008). Age and experience-related user behavior differences in the use of complicated electronic devices. Human-Computer Studies, 66. pp. 425-37.
doi:10.1016/j.ijhcs.2007.12.003
Lazarus, R. S. (1999). Stress and Emotion: A new synthesis. New York: Springer.
Lazarus, R. S. (2000). Toward better research on stress and coping. American Psychologist,
55(6), 665-673. doi: 10.1037/0003-066X.55.6.665.
Lazarus, R. S., & DeLongis, A. (1983). Psychological stress and coping in aging. The American Psychologist, 38(3), 245-54. Retrieved from
http://www.ncbi.nlm.nih.gov/pubmed/6870040.
Lee, V. E. , & Bryk, A. S. (1989). A multi-level model of the social distribution of high school achievement. Sociology of Education, 62(3), 172-92.
Loft, S., Sanderson, P., Neal, A., & Mooij, M. (2007). Modeling and predicting mental workload in en route air traffic control: Critical review and broader implications.
Human Factors, 49(3), 376-399. doi:10.1518/001872007X197017.
Mathews, A., & Mackintosh, B. (1998). A cognitive-motivational analysis of anxiety.
Cognitive Therapy and Research, 122, 539-560.
Matthews, G., Emo, A. K., Funke, G., Zeidner, M., Roberts, R. D., Costa, P. T., & Schulze, R. (2006). Emotional intelligence, personality, and task-induced stress. Journal of Experimental Psychology: Applied, 12(2), 96-107. doi:10.1037/1076-898X.12.2.96
Matthews, G., Joyner, L., Gilliland, K., Campbell, S., Huggins, J., & Falconer, S. (1999).
Neupert, S. D., Almeida, D. M., Mroczek, D. K., & Spiro, A. (2006). Daily stressors and memory failures in a naturalistic setting: Findings from the VA normative aging study.
Psychology and Aging, 21(2), 424-9. doi:10.1037/0882-7974.21.2.424
Neupert, S. D., Miller, L. M., & Lachman, M. E. (2006). Physiological reactivity to cognitive stressors: Variations by age and socioeconomic status. International Journal of Aging and Huan Development, 62(3), 221-35.
Newell, K. M. (1991). Motor Skill Acquisition. Annual Review of Psychology, 42, 213-37.
Parker, D., McDonald, L., Rabbitt, P., & Sutcliffe, P. (2000). Elderly drivers and their accidents: The aging driver questionnaire. Accident Analysis and Prevention, 32(6), 751-9. Retrieved from http://www.ncbi.nlm.nih.gov/pubmed/10994602
Peters, M., Laeng, B., Latham, K., Jackson, M., Zaiyouna, R., & Richardson, C. (1995). A redrawn Vandenberg and Kuse mental rotations test: Different versions and factors that affect performance. Brain and Cognition, 28, 39-58.
Revelle, W. (1993). Attention: Selection, awareness and control: A tribute to Donald
Broadbent. Baddely, A., Weiskrantz, L. (Eds.), (pp. 346-373). Oxford, England: Oxford University Press.
Rogers, W. A. (1997). Individual differences, aging, and human factors: An overview. In Fisk, A.D., Rogers, W.A. (Eds.), Handbook of Human Factors and the Older Adult (pp. 151- 170). San Diego: Academic Press. Inc.
Salthouse, T. A. (2004). What and when of cognitive aging. Current Directions in Psychological Science, 13(4), 140-144. doi:10.1111/j.0963-7214.2004.00293.x
Sanders, A. F. (1983). Towards a model of stress and human performance. Acta Psychologica, 53(1), 61-97. Retrieved from
http://www.ncbi.nlm.nih.gov/pubmed/6869047
Sharit, J., & Czaja, S. J. (1994). Ageing, computer-based task performance, and stress: issues and challenges. Ergonomics 37(4), 559-77. doi: 10.1080/00140139408963674.
Sharit, J., Czaja, S. J., Nair, S. N., Hoag, D. W., Leonard, D. C., & Dilsen, E. K. (1998). Subjective experiences of stress, workload, and bodily discomfort as a function of age and type of computer work. Work & Stress, 12(2), 135-44.
doi:10.1080/02678379808256855
Snijers, T. A. B. & Bosker, R. J. (2011). How much does the model explain? Multilevel Analysis: An Introduction to Basic and Advanced Multilevel Modeling 2nd Edition. (pp. 109-118). Los Angeles: Sage.
Sperandio, J. C. (1978). The regulation of working methods as a function of work-load among air traffic controllers. Ergonomics, 21(3), 195-202.
doi:10.1080/00140137808931713.
Suls, J. (2001). Affect, Stress, and Personality. In Forgas J. P. (Ed.), Handbook of affect and social cognition, (pp. 392-409). Mahwah, NJ: Lawrence Elrbaum Associates.
Suss, J., & Ward, P. (2010). Skill-based differences in the cognitive mechanisms underlying failure under stress. Human Factors and Ergonomics Society 54th Annual Meeting (pp. 1062-1066).
Szalma, J. L. (2009a). Individual differences in human-technology interaction: incorporating variation in human characteristics into human factors and ergonomics research and design. Theoretical Issues in Ergonomics Science, 10(5), 381-397.
doi:10.1080/14639220902893613
Szalma, J. L. (2009b). Individual differences in performance, workload, and stress in sustained attention: Optimism and pessimism. Personality and Individual Differences,
47(5), 444-451. doi:10.1016/j.paid.2009.04.019
Szalma, J. L., Hancock, P. A., Dember, W. N., & Warm, J. S. (2006). Training for vigilance: the effect of knowledge of results format and dispositional optimism and pessimism on performance and stress. British Journal of Psychology, 97, 115-35.
Szalma, J. L., Warm, J. S., Matthews, G., Dember, W. N., Weiler, E. M., Meier, A., & Eggemeier, F. T. (2004). Effects of sensory modality and task duration on performance, workload, and stress in sustained attention. Human Factors: The Journal of the Human Factors and Ergonomics Society, 46(2), 219-33.
doi:10.1518/hfes.46.2.219.37334
Teo, G., Szalma, J. L., & Schmidt, T. (2011) Predicting performance, subjective states and coping strategy in a vigilance task: The role of individual differences.
Human Factors and Ergonomics Society 55th Annual Meeting, (pp.1467-71).
Tugla, M. K., & Sheridan, T. B. (1980). Dynamic decisions and work load in multitask supervisory control. IEEE Transactions on Systems, Man, and Cybernetics, SMC-10(5), 217-232.
Vandenberg, S.G., & Kuse, A. R. (1978). Mental rotations, a group test of three-dimensional spatial visualization. Perceptual and Motor Skills, 47, 599-604.
Warm, J. S., Parasuraman, R., & Matthews, G. (2008). Vigilance requires hard mental work and is stressful. The Journal of the Human Factors and Ergonomics Society, 50(3). pp. 433-41. doi:10.1518/001872008X312152
Wickens, C. D. (1999). Automation technology and human performance (current research
and trends). Scerbo, M. W., Mouloua, M. (Eds.). Mahwah, New Jersey: Lawrence
Erlbaum Associates.
Wickens, C. D. (2002). Multiple resources and performance prediction. Theoretical Issues in
Ergonomics Science, 3(2), 159-177. doi:10.1080/14639220210123806
Wu, C., & Liu, Y. (2006). Queuing network modeling of age differences in driver mental workload and performance. Human Factors and Ergonomics Society 50th Annual Meeting, (pp. 1117-21).
APPENDIX A
Demographics Questionnaire
1. Please enter your participant ID 2. Please enter your date of birth 3. What is your sex?
a. Male b. Female
4. Indicate the highest level of completed education a. Less than high school graduate
b. High school graduate or G.E.D.
c. 2 year technical degree or technical college d. Certificate program
e. 2 years or less of undergraduate status at a 4 year university
f. 2 years or less of undergraduate status at a 4 year university without a degree. g. Bachelor of Arts or Bachelor of Science degree
h. Some Graduate school i. Master’s degree
j. M.D., J.D., Ph.D., or other advanced degree 5. Indicate the race/ethnicity that best describes you
a. American Indian/Alaskan Native b. Asian American/Pacific Islander c. Black/African American
d. Hispanic/Latino e. White/Caucasian
f. Other ________________ g. Multiracial
6. Indicate your occupational status a. Full time student
b. Full time student/part time work c. Part time student/part time work d. Part time student/full time work e. Full time work
f. Part time work g. Retired/not working h. Retired/part time working 7. What is your occupation?
8. If you are a student, what college are you currently enrolled in? a. Agriculture & Life Sciences
b. Design c. Education d. Engineering
g. Natural Resources
h. Physical & Mathematical Sciences i. Textiles
j. Veterinary Medicine k. First Year College l. Distance Education
m. Other _________________ 9. Is English your first language?
a. Yes b. No
10. Do you play video games? a. Yes
b. No
11. How would you describe your feelings about playing video games? a. I do not generally like to play video games
b. I do like video games
c. I only like to play one specific video game
d. I only like certain types of video games and only play types that are in the same genre
12. Indicate about how much time you spend playing video games. a. A few times a week
b. A few times a day
c. Only once or twice a day but for long periods of time d. Only once or twice a week but for long periods of time. e. More than any of the above options
f. Less than any of the above options
13. What would you say are the best reasons why you play video games (choose all that apply)?
a. For enjoyment
b. To practice skills you deem important c. To procrastinate
d. To escape reality e. To socialize f. To relax
g. To sharpen your mind h. To have some “me time”
APPENDIX B
APPENDIX C
International Personality Item Pool- Neuroticism Extroversion Openness (IPIP-NEO)
APPENDIX D
APPENDIX E
APPENDIX F
Experimental Trials
Practice Trial 1
Experimental Trial 1
Experimental Trial 3
APPENDIX G
SSSQ Subscales Output by Age and Trial
Figure 10. Mean total worry across experimental trial by age group.
APPENDIX H
Output of NASA-TLX by Age and Trial
Figure 14. Mean total temporal workload across experimental trial by age group.
Figure 16. Mean total effort workload across experimental trial for each age group.