Electronic Theses and Dissertations Theses, Dissertations, and Major Papers
2010
Improving corrosion performance by surface patterning
Improving corrosion performance by surface patterning
Majid Karimi BigdeliUniversity of Windsor
Follow this and additional works at: https://scholar.uwindsor.ca/etd
Recommended Citation Recommended Citation
Bigdeli, Majid Karimi, "Improving corrosion performance by surface patterning" (2010). Electronic Theses and Dissertations. 8075.
https://scholar.uwindsor.ca/etd/8075
This online database contains the full-text of PhD dissertations and Masters’ theses of University of Windsor students from 1954 forward. These documents are made available for personal study and research purposes only, in accordance with the Canadian Copyright Act and the Creative Commons license—CC BY-NC-ND (Attribution, Non-Commercial, No Derivative Works). Under this license, works must always be attributed to the copyright holder (original author), cannot be used for any commercial purposes, and may not be altered. Any other use would require the permission of the copyright holder. Students may inquire about withdrawing their dissertation and/or thesis from this database. For additional inquiries, please contact the repository administrator via email
surface patterning
by
Majid Bigdeli Karimi
A Thesis
Submitted to Faculty of Graduate Studies through Materials Engineering in partial fulfilment of the requirements for the degree of Master of Applied Science at the
University of Windsor
Windsor, Ontario, Canada 2010
Published Heritage Branch
395 Wellington Street Ottawa ON K1A 0N4 Canada
Direction du
Patrimoine de I'edition
395, rue Wellington OttawaONK1A0N4 Canada
Your file Votre r6f6rence ISBN: 978-0-494-80229-8 Our file Notre r6f6rence ISBN: 978-0-494-80229-8
NOTICE: AVIS:
The author has granted a
non-exclusive license allowing Library and Archives Canada to reproduce,
publish, archive, preserve, conserve, communicate to the public by
telecommunication or on the Internet, loan, distribute and sell theses
worldwide, for commercial or non-commercial purposes, in microform, paper, electronic and/or any other formats.
L'auteur a accorde une licence non exclusive permettant a la Bibliotheque et Archives Canada de reproduire, publier, archiver, sauvegarder, conserver, transmettre au public par telecommunication ou par I'lnternet, preter, distribuer et vendre des theses partout dans le monde, a des fins commerciales ou autres, sur support microforme, papier, electronique et/ou autres formats.
The author retains copyright ownership and moral rights in this thesis. Neither the thesis nor substantial extracts from it may be printed or otherwise reproduced without the author's permission.
L'auteur conserve la propriete du droit d'auteur et des droits moraux qui protege cette these. Ni la these ni des extraits substantiels de celle-ci ne doivent etre imprimes ou autrement
reproduits sans son autorisation.
In compliance with the Canadian Privacy Act some supporting forms may have been removed from this thesis.
Conformement a la loi canadienne sur la protection de la vie privee, quelques
formulaires secondaires ont ete enleves de cette these.
While these forms may be included in the document page count, their removal does not represent any loss of content from the thesis.
Bien que ces formulaires aient inclus dans la pagination, il n'y aura aucun contenu manquant.
1*1
research under the supervision of professors Vesselin Stoilov and Derek O.
Northwood. The research collaboration is covered in Chapters 3, 4 and 5 of the
thesis. In all cases, the key ideas, primary contributions, experimental designs,
data analysis and interpretation, were performed by the author, and the
contributions of the co-authors was primarily in the capacity of supervision of the
research in the form of technical advice and suggestions.
I am aware of the University of Windsor Senate Policy on Authorship and I
certify that I have properly acknowledged the contribution of other researchers to
my thesis, and have obtained written permission from each of the co-author(s) to
include the above material(s) in my thesis.
I certify that, with the above qualification, this thesis, and the research to which
it refers, is the product of my own work.
Author's Declaration of Originality
I hereby certify that I am the sole author of this thesis and that no part of this
thesis has been published or submitted for publication. I certify that, to the best of
my knowledge, my thesis does not infringe upon anyone's copyright nor violate
any proprietary rights and that any ideas, techniques, quotations, or any other
material from the work of other people included in my thesis, published or
otherwise, are fully acknowledged in accordance with the standard referencing
practices.
Furthermore, to the extent that I have included copyrighted material that
surpasses the bounds of fair dealing within the meaning of the Canada Copyright
Act, I certify that I have obtained a written permission from the copyright owner(s)
to include such material(s) in my thesis and have included copies of such
copyright clearances to my appendix. I declare that this is a true copy of my
thesis, including any final revisions, as approved by my thesis committee and the
Graduate Studies office, and that this thesis has not been submitted for a higher
metal (nickel) was investigated. The idea originates from the fact that
hydrophobic (low or non wettable) surfaces can decrease the contact area
between a corrosive solution and a surface. In the current work, special surface
patterns were created on pure nickel sheets. The corrosion behaviour of those
surfaces was studied using a dynamic polarization method in 0.5M H2S04. It was
found that there is a trend or dependency between the hole size (D), the hole
distance (L), and the corrosion current density (Icorr). The higher the (D/L)2 ratio,
the higher the corrosion current density (Icorr). The corrosion potential (Ecorr) of
all samples was lower than that of the reference sample in all the tests. SEM
images showed that after the first corrosion test some local corroded regions
were created on the surfaces but in the samples with the lowest Icorr there was a
Mehdi,
Narges,
First, I am heartily thankful to my thesis advisors Dr. Vesselin Stoilov and Dr.
Derek O. Northwood for their thoughtful supervision, encouragement, and consistent
support in my study period. It was a great pleasure in my academic life to have their
guidance and attention and my study has been challenging and productive.
In addition, I would like to express my sincere gratitude to my committee members
Dr. Daniel Green, Dr. David Ting and Dr. Henry Hu for their invaluable comments
and time.
I warmly thank to Dr. X. Nie and Dr. A. Alpas for their kindness in granting
permission to use the corrosion test equipment and profilometry instrument,
respectively. Also, I appreciate the assistance of engineering technologists: Mr. John
Robinson for all technical assistance in the different laboratories, and Mr. Andy
Jenner and Mr. Matt St. Louis for their assistance in sample preparation for this
Declaration of Co-Authorship
Author's Declaration of Originality Abstract
Dedication
Acknowledgements
List of Tables
List of Figures
Chapter 1: Introduction
Chapter 2: Literature review
2.1. Effect of surface roughness on corrosion behavior
2.1.1. Surface roughness of steels
2.1.2. Relationship between surface roughness and pitting
2.1.3. Surface roughness of coatings
2.2. Hydrophobicity: concepts, properties and applications
2.2.1. Hydrophobicity of metals
2.2.1.1. Hydrophobic surfaces on steel
2.2.1.2. Hydrophobic surfaces on nickel
2.2.1.3. Hydrophobic surfaces on copper
2.2.1.4. Hydrophobic surfaces on aluminum
2.2.1.5. Hydrophobic surfaces on other materials
2.3. Laser surface patterning
2.3.1. Laser interface metallurgy method
2.3.2. Laser patterning on stainless steel 2.3.3. Laser operations on different materials
Chapter 3: Experimental procedures
3.1. Material
3.2. Specimen preparation
3.3. Laser ablation
3.7. X-ray diffraction (XRD) 3 8
Chapter 4: Results and discussion 39
4.1. SEM images of the patterned samples 39
4.2. EDS analysis of the patterned samples 4 4
4.3. Roughness of the patterned samples 46
4.4. Corrosion tests 53
4.5. SEM images after corrosion tests 72
4.6. Roughness data after corrosion tests 82
4.7. EDS after the first corrosion test 89
Chapter 5: Conclusions and recommendations 91
5.1. Conclusions 91
5.2. Recommendations 92
References 93
Chapter 2: Literature review
Table 2-1. Pitting potentials after various surface treatments [26] 5
Chapter 3: Experimental procedures
Table 3-1. The hole sizes and their distances of the textures created on the nickel sheet 35 surfaces
Table 3-2. Sample coding system 35
Chapter 4: Results and discussions
Table 4-1. The roughness values from profilometry test for all samples 47
Table 4-2. The corrosion data for all samples after the first test 57
Table 4-3. The corrosion data for all samples after the second test 57
Table 4-4. The corrosion data for all samples after the third test 57
Table 4-5. Dependence of Icorr of all samples and different parameters 66
Table 4-6. Dependence of Ecorr of all samples and different parameters 66
Fig. 2-1. Dependence of pitting potential of the 316LVM surface on the surface 5 roughness; the modified sample went through CCP method [24].
Fig. 2-2. Anodic polarization curves of smooth and rough steel substrates (AISI4340), a- 6 Ta coatings deposited on these substrates and of Ta foil, in 0.5 M H2S04 deaerated with
N2 at room temperature [27].
Fig. 2-3. Potentiodynamic polarization curves for HNS in aerated 0.05M H2S04 + 0.5M 7
NaCI solution at ambient temperature with different surface roughness [25].
Fig. 2-4. The pitting potential, EP, of 304L stainless steel measured in 0.6 M NaCI as a 8
function of the surface finish [1].
Fig. 2-5. (a) Potentiodynamic polarisation behavior of the specimens PEO coated at 9 different current densities for 15 min (test electrolyte: 0.1 M NaCI solution), (b) average
thickness and roughness of the specimens PEO coated at different current densities for 15 min [31].
Fig. 2-6. Potentiodynamic polarization curves obtained in the 3.5% NaCI solution at a 10 scanning rate of 1 mV/s: the oxide coating with roughness of (a) 1.6 pm; (b) 4.2 pm; and
(c) 6.3 pm [32].
Fig. 2-7. Polarization curves of various Ti-Si-N coatings tested in 3.5 wt% NaCI solution 10 [33].
Fig. 2-8. SEM images of the surface of a lotus leaf [8]. 11
Fig. 2-9. The schematic illustration of surface tensions on a solid surface in contact with 13 a water droplet, where ysv is the solid-vapor surface energy, ysi is the solid-liquid
interfacial energy and viv is the liquid-vapor surface energy.
Fig. 2-10. (a) Photo of water droplets on the phosphating film and superhydrophobic film, 15 (b) SEM image of the superhydrophobic film which was fabricated by silicon sol [21].
Fig. 2-11. Top (left), side (308) (middle) and profile view (right) SEM micrographs of AISI 16 316L type austenitic stainless steel-based [12].
Fig. 2-12. Schematic illustration of laser-induced periodic surface structure (LIPSS) 16 covered with nanoparticles formed at fluences 0.08 J/cm2. (a) The alternating array of
LIPSS and nanoparticles. (b) The local interaction of the sort water interface with the top of LIPSS [12].
Fig. 2-13. Surface and microstructure of Ni; SEM images: (a) left, overview, (b) middle, 17 pentagon, (c) right, pore [39]
Fig. 2-14. Fabricated nickel micromesh sheet: (a) photograph of a nickel micromesh 18 prototype unit, (b) & (c) magnified SEM images of the micromesh [8].
Fig. 2-17. SEM images of the formation of the superhydrophobic metal surface and an 20 image of a water drop on this surface: (a) the as-deposited copper surface; (b) High
magnification image of the copper surface after electrochemical reaction with sulfur gas at 150 °C for 10 min; (c) Low magnification image of (b); (d) Schematic diagram of the formation of the micro- and nanostructured metal surface; (e) Optical image of a water drop on the surface in (b) [9].
Fig. 2-18. SEM images of the copper surfaces with different produced at different current 21 densities: (a) current density = 0.04 A/cm2, contact angle = 125°. (b) Current density =
0.08 A/cm , Contact angle = 153.5 (c) Enlarged SEM image on surface b. (d) Current density = 0.10 A/cm2, Contact angle = 132.5 [41].
Fig. 2-19. Model of the interface between super-hydrophobic surface and sterile 21 seawater[13].
Fig. 2-20. FE-SEM images of the textured aluminum sheet: (a) top view and (b) tilted 22 view. The scale bar is 1 pm [20].
Fig. 2-21. The change in thickness of the aluminum layer versus time for samples 23 protected by films of varying contact angle and a sample with only native Al203 layer
(without protective film) [15].
Fig. 2-22. Potentiodynamic polarization curves of untreated, anodized and 24 superhydrophobic samples for 34 h in sterile seawaterat 2mVs'1 [7].
Fig. 2-23. SEM images of (a) the untreated aluminum and (b) the superhydrophobic 24 aluminum surfaces [17].
Fig. 2-24. A schematic of a rough surface immersed in seawater [18]. 25
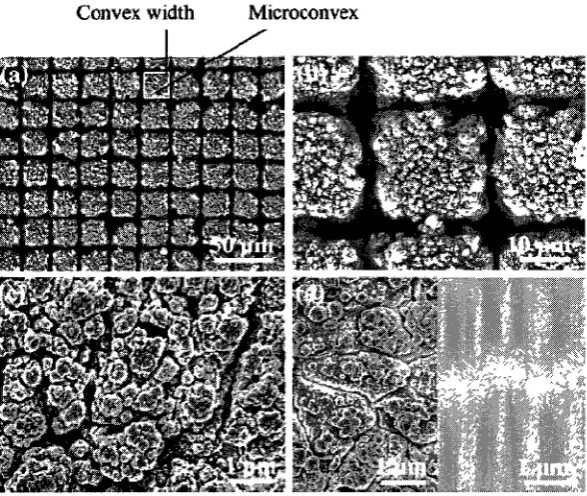
Fig. 2-25. (a) Typical SEM images of the laser-etched PDMS surface with the convex 27 width of about 25 mm, showing the regular arrays of microconvexes; (b) magnified image
of (a), showing the submicro structures on each convex; (c) high-resolution image of a single convex of (b), showing the nanoparticles composed of each submicro block; (d) high resolution image of a single convex with width of about 50 mm (left) and a flat PDMS surface (right [10].
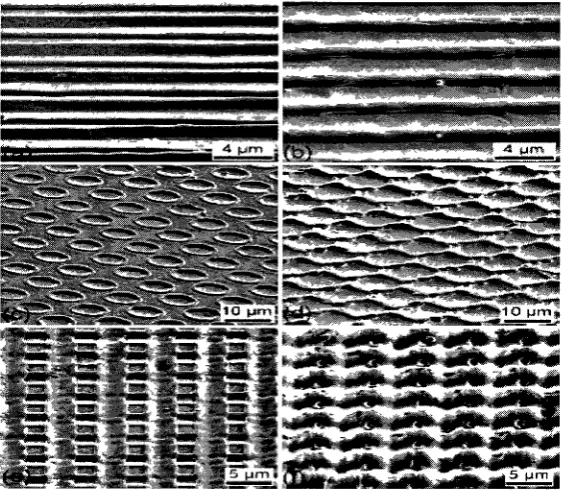
Fig. 2-26. Scanning electron micrographs of the structured surfaces irradiated with low 29 and high laser intensities. Line-like structures: low (a) and (b) high laser fluence; Dot-like
structures: low (c) and (d) high laser fluence; Cross-like structures: low (e) and (g) high laser fluence. Tilt: 52° [49].
Fig. 2-27. SEM micrographs of three laser beams irradiated stainless steel substrates 30 (period = 8.00 mm): (a) 2.15 J/cm2; (b) 2.41 J/cm2. The insert in (a) shows the three laser
beams configuration and the calculated interference pattern. Tilt: 52 ° [50].
Fig. 2-28. SEM images (view tilt 30°) of the surface at incident beam angles of (a) 75°, 30 (b) 60°, and (c) 45° using the following parameters: Laser wavelength 1064 nm, intensity
0.43 GW/cm, and 5000 pulses/spot [54].
Chapter 3: Experimental procedure
Fig. 3-1. Flowchart of experimental procedures. 33
Fig. 3-2. (a) Diamond suspension and (b) alumina powder water suspension polishing 34 machines.
Fig. 3-3. 34
Fig. 3-4. Schematic presentation of the proposed surface texture model; D assigns to the 36 hole diameter and L assigns to the distance between the holes. The gray area is the
laser ablated region.
Fig. 3-5. JEOL 5800 scanning electron microscope. 36
Fig. 3-6. The Wyko NT1100 profilometry machine. 37
Chapter 4: Results and discussions
Fig. 4-1. The SEM micrographs of the initial smooth sample after final polishing with 0.05 40 pm-alumina particles suspension.
Fig. 4-2. The SEM micrographs of samples (a) and (b) D5L5; (c) and (d) D5L10; (e) and 41 (f) D5L20 after laser ablation process.
Fig. 4-3. The SEM micrographs of samples (a) and (b) D10L10; (c) and (d) D10L20; (e) 42 and (f) D10L30 after laser ablation process.
Fig. 4-4. The SEM micrographs of samples (a) and (b) D20L20; (c) and (d) D20L30; (e) 43 and (f) D20L40 after laser ablation process.
Fig. 4-5. EDS analysis spectra of samples (a) REF, (b) D5L5; surface, (c) D5L20; surface, (d) 44 D5L20; hole, and (e) D20L40; surface (continued).
Fig. 4-6. Sample D5L5 (a) 3D roughness, (b) X-profile, (c) Y-profile and (d) histogram 48 curve.
Fig. 4-7. Sample D5L20 (a) 3D roughness, (b) X-profile, (c) Y-profile and (d) histogram 49 curve.
Fig. 4-8. Sample D10L20 (a) 3D roughness, (b) X-profile, (c) Y-profile and (d) histogram 50 curve.
Fig. 4-9. Sample D20L20 (a) 3D roughness, (b) X-profile, (c) Y-profile and (d) histogram 51 curve.
Fig. 4-10. Sample D20L40 (a) 3D roughness, (b) X-profile, (c) Y-profile and (d) histogram 52 curve.
Fig. 4-13. Potentiodynamic corrosion curves for sample D5L10 in 0.5M H2S04 after 59
different tests.
Fig. 4-14. Potentiodynamic corrosion curves for sample D5L20 in 0.5M H2S04 after 59
different tests.
Fig. 4-15. Potentiodynamic corrosion curves for sample D10L10 in 0.5M H2S04 after 60
different tests.
Fig. 4-16. Potentiodynamic corrosion curves for sample D10L20 in 0.5M H2S04 after 60
different tests.
Fig. 4-17. Potentiodynamic corrosion curves for sample D10L30 in 0.5M H2S04 after 61
different tests.
Fig. 4-18. Potentiodynamic corrosion curves for sample D20L20 in 0.5M H2S04 after 61
different tests.
Fig. 4-19. Potentiodynamic corrosion curves for sample D20L30 in 0.5M H2S04 after 62
different tests.
Fig. 4-20. Potentiodynamic corrosion curves for sample D20L40 in 0.5M H2S04 after 62
different tests.
Fig. 4-21. Corrosion data of sample D5L5 (a) Icorr and Rp curves, (b) Ecorr curve. 63
Fig. 4-22. Corrosion data of sample D5L20 (a) Icorr and Rp curves, (b) Ecorr curve. 63
Fig. 4-23. Corrosion data of sample D20L40 (a) Icorr and Rp curves, (b) Ecorr curve. 63
D 67
Fig. 4-24. The Icorr values versus hole diameters (D) for all samples with (—)2 = 1 and
sample REF (D/L)=0 after the first corrosion test.
D 67
Fig. 4-25. The Icorr values versus hole diameters (D) for all samples with (—f = 0.25 and sample REF (D/L)=0 after the first corrosion test.
D 67
Fig. 4-26. The Ecorr values versus hole diameters (D) for all samples with (—f = and sample REF (D/L)=0 after the first corrosion test.
D 68
Fig. 4-27. The Ecorr values versus hole diameters (D) for all samples with (—)2 = 0.25
and sample REF.
Fig. 4-32. The SEM micrographs of sample D5L10 after: (a) and (b) the first; (c) and (d) 74 the second; (e) and (f) the third corrosion tests in 0.5M H2S04.
Fig. 4-33. The SEM micrographs of sample D5L20 after: (a) and (b) the first; (c) and (d) 75 the second; (e) and (f) the third corrosion tests in 0.5M H2S04.
Fig. 4-34. The SEM micrographs of sample D10L10 after: (a) and (b) the first; (c) and (d) 76 the second; (e) and (f) the third corrosion tests in 0.5M H2S04.
Fig. 4-35. The SEM micrographs of sample D10L20 after: (a) and (b) the first; (c) and (d) 77 the second; (e) and (f) the third corrosion tests in 0.5M H2S04.
Fig. 4-36. The SEM micrographs of sample D10L30 after: (a) and (b) the first; (c) and (d) 78 the second; (e) and (f) the third corrosion tests in 0.5M H2S04.
Fig. 4-37. The SEM micrographs of sample D20L20 after: (a) and (b) the first; (c) and (d) 79 the second; (e) and (f) the third corrosion tests in 0.5M H2S04.
Fig. 4-38. The SEM micrographs of sample D20L30 after: (a) and (b) the first; (c) and (d) 80 the second; (e) and (f) the third corrosion tests in 0.5M H2S04.
Fig. 4-39. The SEM micrographs of sample D20L40 after: (a) and (b) the first; (c) and (d) 81 the second; (e) and (f) the third corrosion tests in 0.5M H2S04.
Fig. 4-40. Sample D5L5 (a) 3D roughness, (b) X-profile, (c) Y-profile and (d) histogram 84 curve after the second corrosion test.
Fig. 4-41. Sample D5L20 (a) 3D roughness, (b) X-profile, (c) Y-profile and (d) histogram 85 curve after the second corrosion test.
Fig. 4-42. Sample D10L20 (a) 3D roughness, (b) X-profile, (c) Y-profile and (d) histogram 86 curve after the second corrosion test.
Fig. 4-43. Sample D20L20 (a) 3D roughness, (b) X-profile, (c) Y-profile and (d) histogram 87 curve after the second corrosion test.
Fig. 4-44. Sample D20L40 (a) 3D roughness, (b) X-profile, (c) Y-profile and (d) histogram 88 curve after the second corrosion test.
BTESPT CPP Ecorr EDM EDS Em EWF FAS GTM HNS Icorr, icorr LIST MEMS MIC OCP PDMS PEI PEM PEO PPFC SAM SCE SEM SLM XRD bis-[triethoxysilylpropyl] tetrasulfide
cyclic potentiodynamic passivation
corrosion potential
electrical discharge machining
energy dispersive spectroscopy
pit potential
electron work function
fluoroalkylsilane
golf-tee shaped micropillar
high nitrogen bearing stainless steel
corrosion current density
laser interference surface treatment
micro-electro-mechanical systems
microbially influenced corrosion
open circuit potential
polydimethylsiloxane
polyethyleneimine
proton exchange membrane
plasma electrolytic oxidation
plasma polymerized fluorocarbon coating
self-assembled monolayers
standard calomel electrode
scanning electron microscopy
selected laser melting
1. Introduction
The corrosion resistance is one of the important properties of metals and their
alloys. In many applications metallic structures are in contact with corrosive
media and failure con occur in relatively short times. Hence, improving the
corrosion resistance of metallic alloys can be of paramount importance.
Surface roughness of materials especially metals affects their corrosion
resistance. The pitting potential, which is the minimum potential at which stable
pits are observed to propagate, is lower for rougher surfaces [1,2] than for
smoother ones. Pits initiate at specific sites on the surface (usually inclusions)
and rougher surfaces generally provide sites with a more occluded geometry. It is
easier to maintain a concentrated local chemistry at these occluded sites, and so
rougher surfaces tend to support a higher frequency of pit initiation [3]. Although
it has been found that a higher surface roughness can decrease the corrosion
resistance, in some applications having special surface pattern (topography or
geometry) can be useful. It has been found that hydrophobic surfaces are useful
in applications involving wear, self cleaning, and corrosion [4-7].
Many terrestrial plants and animals are water-repellent due to hydrophobic
surface components with microscopic roughness. It has been shown that these
surfaces provide a very effective anti-adhesive property against particulate
contamination. This self-cleaning mechanism, called the "Lotus-Effect", is an
important function of many microstructured biological surfaces [5]. The surface of
the lotus leaf is covered with micro-protrusions, which are themselves covered
nano-protrusions. The nano-protrusions are composed of epicuticular wax
crystalloids that are hydrophobic [8].
The unusual wetting characteristics of superhydrophobic surfaces are
governed by both their surface chemical composition and surface geometric
microstructure [9,10]; their wettability can be decreased by creating a local
geometry with a large geometric area relative to the projected area [9]. The origin
of the self-cleaning property of lotus leaves has been revealed to be a
Many methods have recently been developed to fabricate surfaces with
controlled roughness through various approaches such as the sol-gel process,
generation of a fibrillar structure, creation of a rough surface covered with low
surface energy molecules, and the phase separation of a polymer in a mixed
solvent system, etc [9]. 'Etch and coat" methods are potentially useful for large
scale production of superhydrophobic surfaces on metals. Despite the diversity of
approaches, which have been applied to creating superhydrophobic metal
surfaces there are just two factors which dominate the overall performance. One
is the roughness or texture of the surface, the second is the nature of the surface
modifying layer [11]. It is said that the fraction of air between the water droplet
and the double-scale (patterned) surface is the important reason of
superhydrophobicity of the surface [12].
Some studies have shown that creation of hydrophobic surfaces on such
metals as aluminum and copper can increase the corrosion resistance in different
corrosive media [7,13-18].
A surface with a rough structure can be fabricated by many techniques, such
as chemical vapor deposition, anodization, soft etching, and optical lithography.
The laser fabrication technique provides an effective tool to fabricate periodic
structures on any material surface due to its ultrahigh peak power [19]. Some
hydrophobic surfaces have been created on different metals and alloys such as
stainless steel, nickel, aluminum, copper and etc [4,9,20,21]. In all of these
studies, hydrophobicity was achieved using a roughness on a surface along with
a material to decrease surface energy. However, some new research [22,23] has
shown that it is possible to create hydrophobic properties on a surface whether it
is naturally hydrophilic or hydrophobic.
In this research nickel was selected as model metal because no work had been
done on surface patterning of this metal thus far. The aim of this work was to
create special surface patterns (topography) on a pure nickel surface and study
the corrosion behavior of the patterned surfaces. In fact in this research the
novelty was first to select pure nickel and second to create a hydrophobic surface
decrease the surface energy. In other words, it was targeted to fabricate a
2. Literature review
This review covers four general topics, namely: effect of surface roughness on
corrosion behavior; hydrophobicity; laser surface patterning and polymer
exchange membrane fuel cells. In each section, the relevant research is
summarized to provide a background for the current research.
2.1. Effect of surface roughness on corrosion behavior
Several researchers have investigated the effect of surface roughness on the
corrosion behavior of steels. These have induced studies on surface roughness
on cyclic potentiodynamic passivation [24], electrochemical behavior [25] and the
effect of surface roughness on pitting corrosion resistance [26].
2.1.1. Surface roughness of steels
The influence of surface roughness on the efficiency of a cyclic
potentiodynamic passivation (CPP) method on stainless steel was investigated
by Shahryari and his colleagues [24]. They showed that a decrease in surface
roughness of stainless steel 316LVM on which a passive film is naturally formed,
results in an increase in the alloy's resistance to pitting corrosion. However for
the surface on which the passive film is formed using the CPP method, an
increase in both general and pitting corrosion resistance was observed. It was
also demonstrated that the CPP method is highly effective in increasing the
general and pitting corrosion resistance of 316LVM in the entire surface
roughness range, thus further supporting its potential use in a wide range of
biomedical and industrial applications. Fig. 2-1 shows the EpA as a function of
surface roughness for the 316LVM stainless steel.
Girija and his collaborators [26] studied the effect of mechanical and chemical
treatments of the surface on the pitting corrosion resistance of type 316LN
stainless steel in 0.5M sodium chloride (NaCI) solution. When the surface
roughness is greater, it is more likely that an electrochemically active inclusion is
associated with a concavity in the surface that is deep enough to support pit
barrier to diffusion of dissolved corrosion products, protons and ions from the pit
site). When the surface roughness is lower, the inclusions can not act as pit sites
because their depression into the surface is not great enough to provide a
sufficient diffusion barrier. Anyhow, they found that surface roughness has no
significant effect on the pitting potentials after chemical treatment. Table 2-1
presents the Grijia's results for pitting potentials in different conditions.
378 134 117 65 62 24
Surface roughness (rim)
Fig 2-1. Dependence of pitting potential of the 316LVM surface on the surface roughness; the modified sample went through CCP method [24]
Table 2-1. Pitting potentials after various surface treatments [26]
Surface finish method Diamond cloth
finish 600 grit SiC
abrasive polishing
320 grit SiC abrasive polishing Lathe finish Surface Roughness (Mm) 0 009 0 05 0 07 0 5 Mechanical treatment 394 mV 326 rnV 307 mV 152 mV Pickling 672 mV 651 rnV 637 mV 631 mV Pickling followed by passivation 1114mV 1040mV 1000 rnV 865 rnV
In another research [27], deposited a-Ta coatings on smooth and rough AISI
Maeng et al.'s research objective was to study the corrosion behavior of the
coatings deposited on smooth and rough steel surfaces. The coatings deposited
on both substrates showed almost identical anodic polarization behavior although
the corrosion current density was slightly higher in the case of the coating on the
rough substrate. Fig. 2-2 shows the potentiodynamic corrosion curves for those
coated and uncoated surfaces.
1 0l
1 0 '
1 0 '
1 0 '
1 0 '
10 '
10
rough steel substrate
smooth steel substrate a-Ta coating with 50 u.m
on rough steel substrate
Ta foil
-0 5 0 5
E (V) vs SCE
1 5
Fig 2-2 Anodic polarization curves of smooth and rough steel substrates (AISI 4340), a-Ta coatings deposited on these substrates and of Ta foil, in 0 5 M H2S04 deaerated with N2 at room
temperature [27]
The effects of oxygen, H2S04 concentration and surface roughness on the
electrochemical behavior of high nitrogen bearing stainless steel (HNS) in 0.05
H2SO4 + 0.5M NaCI solution was studied by Qiao and his co-workers [25]. They
observed three corrosion potentials (active, active-passive and passive regions)
in the potentiodynamic polarization curve which is probably due to hydrogen
evolution reaction and even generation of metal cations [28]. The surface
roughness has no noticeable effect on the number of corrosion potential but
increases the values of the corrosion potentials and passivation current densities
with increase in the surface roughness (Fig. 2-3). The surface roughness has no
rate with increased surface roughness could be assumed to be due to the
reduction in the average electron work function (EWF) with surface roughness
[25].
1E-7 1E-6 1E-5 1E-4 1E-3 0 01 Current density /A.cnr2
Fig. 2-3. Potentiodynamic polarization curves for HNS in aerated 0.05M H2S04 + 0.5M NaCI
solution at ambient temperature with different surface roughness [25].
Celik et al. researched the corrosion behavior of grit-blasted AISI 304L stainless
steel substrates coated with Al203 in 1 N H2SO4 solution. The results showed that
the corrosion resistance of plasma-sprayed coatings is reduced with increasing
surface roughness [29].
2.1.2. Relationship between surface roughness and pitting corrosion
Some works have examined the role of surface roughness in pitting corrosion.
The pitting potential, which is the minimum potential at which stable pits are
observed to propagate, is lower for rougher surfaces [1,2] than for smoother
ones, a phenomenon which is in qualitative agreement with the known diffusion
control of the rate of metastable and stable pit propagation [1]. Pits initiate at
specific sites on the surface (usually inclusions) and rougher surfaces generally
provide sites with a more occluded geometry. It is easier to maintain a
concentrated local chemistry at these occluded sites, and so rougher surfaces
a smaller frequency of metastable pitting in comparison with a rougher one. The
surface with the smoother finish, however, also shows a far higher frequency of
nucleation events. This apparently paradoxical phenomenon is attributed to the
repetitive nucleation of pits from individual sites of pitting [30]. The potential (Em)
at which the metastable pit or pits start to grow on the surface depends on
surface roughness.
The nucleation of corrosion pits on stainless steel was researched by Burstein
and Vines [30] in chloride solution at constant potential through observation of
minute current transients. The nucleation of pits is a process that is apparently
random in time, and its frequency of occurrence decays with time at constant
potential with first-order kinetics. The time-constant associated with this is a
function of the surface finish and reflects the ability of nucleated sites to
propagate as metastable pits or to repassivate. A smoother surface finish makes
propagation more difficult and allows more repetitive nucleations from the same
site. In another work, Sasaki and Burstein [1] focused on the effect of created
surface roughnesses on the pitting potential during slurry erosion-corrosion in
304L stainless steel. Their results confirm that surface roughness is a critical
parameter in determining the pitting potential of 304L stainless steel. The pitting
potential is easily changed by several tenths of a volt by appropriate surface
roughening. For surfaces finished by grinding on silicon carbide paper, the pitting
potential falls linearly with increase in the reciprocal grit number (Fig. 2-4),
implying a linear relationship with the particle size.
0 . 4
0 . 3
y? 0 . 2
O «
> 0.1
Ck.
IXJ
0.0
-0.1
- 0 . 2
0 0 . 0 0 2 0.OO4 0 . 0 0 6 r e c i p r o c a l grit n u m b e r
-r—«—i—«—f T '• r r""* • t
2.1.3. Surface roughness of coatings
Srinivasan and his collaborators produced some coatings on AM50 magnesium
alloy using plasma electrolytic oxidation (PEO) in a silicate-based electrolyte
using a DC power source. The anti-corrosion ability of an oxide coating on
AZ91D alloy is decreased with the increasing porosity. The results reveal that the
roughness level of the coatings increase with increase in current density for a
given processing duration and corrosion resistance decreases as well. Thus, the
thicker (more porosity) and rougher the coating, the higher the corrosion (See
Fig. 2-5) [31].
40
VI 4>
c
10' 10' 10'3 10" 10 10 Current density, mA/cmJ
10' 10"
10
04-w
D Thickness
• Roughness
A-1S
•2
_ _ ( o 25
1530
1 ®
1 »n
05
C-15
Fig. 2-5. (a) Potentiodynamic polarisation behavior of the specimens PEO coated at different current densities for 15 min (test electrolyte: 0.1 M NaCI solution), (b) average thickness and roughness of the specimens PEO coated at different current densities for 15 min. [31].
Fig. 2-6 shows the potentiodynamic corrosion curve of some coatings with
different roughnesses. Bai's research [32] confirms that an oxide coating (on
AZ91D Mg alloy) with the minimum roughness value, exhibits the maximum
corrosion resistance. Bai contends that the roughness (proportional to porosity)
value of an oxide coating is the predominant factor promoting the anti-corrosion
ability. Thus, the corrosion resistance of an oxide coating has a dependency to
the roughness of the coating. On the other hand, the dense oxide coating with
g s <
s
s=
-" • (a) Run 8 _ • (b) • Run 2
• (cl Run 9 ^ _ ^ - ~ - " ~ "
— *s ^^r
—
i
r
. I . I .
*^^~^^^—- (a»
1 i 1 i 1 i
-1.6 -1.4 -1.2
Potential ( V )
-0.8
F/g. 2-6. Potentiodynamic polarization curves obtained in the 3.5% NaCI solution at a scanning
rate of 1 mV/s: the oxide coating with roughness of (a) 1.6 pm; (b) 4.2 pm; and (c) 6.3 pm [32].
Chang et al. [33] deposited a nano-composite Ti-Si-N films on tungsten
carbide substrates by a filtered cathodic arc deposition using TiSi-alloy as arc
sources. It was clearly proved that corrosion resistance in 1 N H2SO4 and 3.5%
NaCI solutions increased with reduced surface roughness. The reason is that the
dense (less porosity) or amorphous structure makes the films less permeable by
the corrosion medium. The Ti-Si-N film exhibits superior corrosion resistance as
the number of microparticles or surface roughness is reduced. Fig. 2-7 shows the
polarization curves of various Ti-Si-N coatings tested in 3.5wt.% NaCI solutions.
It was established that the corrosion potential (Ecorr) is reduced with increasing
surface roughness.
-6 -5 log(i/A>
2.2. Hydrophobicity: concepts, properties and applications
Many terrestrial plants and animals are water-repellent due to hydrophobic
surface components with microscopic roughness. It has been shown that these
surfaces provide a very effective anti adhesive property against particulate
contamination. This self-cleaning mechanism, called the "Lotus-Effect", is an
important function of many microstructured biological surfaces [5]. It is now
recognized that the fascinating fluid behaviors observed for the lotus plant, like
the rolling and bouncing of liquid droplets and self-cleaning of particle
contaminants, arise from a combination of the low interfacial energy and the
rough surface topography of waxy deposits covering their leaves [15]. As shown
in Fig. 2-8, the surface of the lotus leaf is covered with micro-protrusions, which
are clothed in nano-protrusions. The nano-protrusions are composed of
epicuticular wax crystalloids that are hydrophobic [8].
Fig. 2-8. SEM images of the surface of a lotus leaf [8].
The unusual wetting characteristics of superhydrophobic surfaces are
governed by both their surface chemical composition and surface geometric
microstructure [9,10]; their wettability can be decreased by creating a local
geometry with a large geometric area relative to the projected area [9]. The origin
of the self-cleaning property of lotus leaves has been revealed to be a
cooperative effect of micro- and nano-scale structures on their surfaces [10].
Cheng and his colleagues emphasized the importance of the lotus leaf's
nanoscale hair-like structure on its self-cleaning ability [34]. Barthlott et al.
assumed that "Lotus effect" can be transferred to artificial surfaces (e.g. cars,
energy of a solid surface decreases, hydrophobicity increases. To decrease the
surface free energy, rough surfaces formed either etching or by fabrication of
micro/nanostructures, can be useful [8].
Wetting properties are defined by the magnitude of contact angle. If the contact
angle is lower than 90°, a material is hydrophilic (wettable), otherwise it is
hydrophobic (non or low wettable). The contact angle is not only material
property dependent, but it changes with the surrounding conditions, time and it
also depends on the history of wetting [36].
The apparent contact angle (9) between a rough surface and a liquid droplet
can be determined using:
cos9 = rcosdT, (2-1)
where r is the roughness ratio (the actual surface area divided by the apparent
surface area) and 0T is the thermodynamic contact angle defined by:
cos 9T = (Ysv - Ysi) A/*,, (2-2)
where ysv is the solid-vapor surface energy, ysi is the solid-liquid interfacial
energy and yiv is the liquid-vapor surface energy (see Fig. 2-9). As roughness
increases, air can be locally trapped underneath the liquid, resulting in the
formation of a composite surface with a large contact angle, a phenomenon that
is described using the following theoretical equation:
COS 9 = fS COS 9T - fair (2-3)
Where fs is the fractional contact area between the liquid and the solid surface,
and fair is the fractional contact area between the liquid and the air underneath
Solid
Fig. 2-9. The schematic illustration of surface tensions on a solid surface in contact with a water droplet, where ysv is the solid-vapor surface energy, ys, is the solid-liquid interfacial energy and
Yiv is the liquid-vapor surface energy.
The successful advancement of micro-electro-mechanical systems (MEMS and
NEMS [4,8]) with miniature moving parts, including micromotors, gears and
transmissions, mechanical discriminators and optical microswitches, relies on the
development of new wear resistant materials and surfaces with high
hydrophobicity (water repellency) and low adhesion and friction. Other possible
applications for durable water repellent surfaces range from micro-fluidic devices
to bipolar plates in proton exchange membrane (PEM) fuel cells [4,6]. This effect
may inspire thinking about a similar mechanism in the solid-water-corrosive
matters system, namely, prevention of corrosion by repelling corrosive matters
from a surface, making them easily roll off by an external force [7].
Because of superhydrophobic surfaces' interesting properties and important
applications in fundamental research and industrial applications, they have
attracted significant attention, and various fabrication methods have been
reported [36]. Many methods have recently been developed to fabricate surfaces
with controlled roughness through various approaches such as the sol-gel
process, generation of a fibrillar structure, creation of a rough surface covered
with low surface energy molecules, and the phase separation of a polymer in a
mixed solvent system. Most of the methods unveiled to date, however, are not
suitable for the fabrication of protective coatings on metal substrates with
complex shapes [9]. The formation of self-assembled monolayers (SAMs) using
monomeric compounds that bear a surface-reactive group has been known to be
a simple and practical technique for controlling wettability, corrosion, and
2.2.1. Hydrophobicity of metals
Superhydrophobic surfaces are of great importance for many industrial
applications, and may present a solution to the long-standing problems of
environmental contamination and corrosion of metals [7]. The prospect of
producing surfaces that repel water suggests huge opportunities in the area of
corrosion inhibition for metal components, chemical and biological agent
protection for clothing, antifouling for marine vehicles, among many other
applications [34].
Generally metals are hydrophilic or wettable. To create a hydrophobic surface
on a metal there are some methods such as creation of surface patterns, using
some chemicals and a combination of surface patterns and chemicals. The two
main methods of applying sufficient pattern are etching a metal substrate and
electroless deposition of a metal coating onto the substrate. Other methods
which produce metal-based superhydrophobic surfaces include sulfur treatment,
either with sulfur gas or direct mixing of a thiol solution with a metal (Cd or Zn)
salt solution. Electrochemical methods to provide roughness have also been
reported for indium tin oxide (ITO)-coated glass and doped silicon. A range of
techniques, including anodization has been successfully applied to Al. Between
presented reports; there are two different approaches to lowering the surface
energy of the roughened surfaces: use of fluorinated silanes or of fluorinated
thiols. For metals the range of compounds that could be used to lower the
surface energy is much larger since there are numerous functional groups that
bind to metals. Despite the diversity of approaches, which have been applied to
creating superhydrophobic metal surfaces there are just two factors, which
dominate the ultimate performance. One is the roughness or texture of the
surface, the second is the nature of the surface modifying layer [34]. Generally,
metal oxides are more hydrophobic than the metal, so the wettability may
become lower with increase in the amount of metal oxide [37]. The weaker
wetting properties of aluminum, brass and stainless steel can be explained by the
aluminum or chromium oxides are hydrophobic. The passivation of copper is not
such a rapid process as it is in the case of aluminum, zinc or chromium, so the
surface of copper plate remains hydrophilic [36].
Wang and Kido studied the wetting characteristics of natural mica, polished, air
oxidized and water immersed pure chromium, nickel, iron and SUS304 steel
surfaces. They found that the wettability of natural mica and each metal surface
differs from the others and the nano-size wettability is higher than the
millimeter-size even for the same metal surface [37]. It was found that copper has the best
wettability properties, followed by: aluminum, brass and stainless steel.
Aluminum and stainless steel lose their hydrophobic properties during the
dropping procedure while copper and brass remain hydrophilic or hydrophobic
[34].
2.2.1.1. Hydrophobic surfaces on steel
A convenient method to prepare a water-soluble hydrophobic agent and create
a super-hydrophobic film on the base material is by use of a film or electroless
N'h-P composite coating on carbon steels (Fig. 2-10) as shown by Zhu and Jin
[21]. That super-hydrophobic film, has good stability in the air at room
temperature and good corrosion resistance in 5 wt.% NaCI solution, neutral salt
spray test and water erosion test.
Wu and his collaborators fabricated stainless steel-based superhydrophobic
surfaces by microstructuring using a femtosecond laser and the method of
Silanization [12]. Fig. 2-11 shows SEM images of their created surfaces. They
proved that these micro- and submicron double-scale structure surfaces yield
apparent contact angles higher than those on single scale structure surfaces,
and the maximum value was 166.3°. Also their results confirm that the fraction of
air between the water droplet and the double-scale surface was large, which is
the important reason of superhydrophobicity of the surface. This provides a
simple and easily-controlled method for fabricating stainless steel-based
superhydrophobic surfaces [12]. Fig. 2-12 is a schematic illustration of their laser
work.
Fig. 2-11. Top (left), side (308) (middle) and profile view (right) SEM micrographs of AISI 316L type austenitic stainless steel-based [12].
Fig. 2-12. Schematic illustration of laser-induced periodic surface structure (LIPSS) covered with nanoparticles formed at fluences 0.08 J/cm2. (a) The alternating array of LIPSS and
nanoparticles. (b) The local interaction of the sort water interface with the top of LIPSS [12].
Larmour and his collaborators [11] worked on improving thiol-modified systems.
No combinations of etching, Au coating and thiol modification were capable of
and Fe. Application of a sacrificial copper layer followed by an electroless
galvanic deposition method can produce a good hydrophobic surface. This
general method for the preparation of superhydrophobic surfaces on metals is
sufficiently simple and inexpensive to be suitable for application on an industrial
scale, for example in marine or aeronautical engineering. "Etch and coat"
methods are potentially useful for large scale production of superhydrophobic
surfaces on metals [11]. Kurtz et al. described such an aqueous post-dip
treatment (Betatec), providing corrosion resistance for various types of metal
surfaces without impairing the contact resistance and other technical properties
[38]. The Betatec post-dip can impart beneficial hydrophobic properties to the
gold surface with subsequent blocking of pores. This beneficial post-treatment
has no adverse effects on electrical, solderability, or bonding properties of the
gold electrodeposits.
2.2.1.2. Hydrophobic surfaces on nickel
Nickel-based alloys have been studied and used as biomaterials due to their
corrosion resistance and excellent metallurgical compatibility with alloying
elements. Shi et al. have studied the tribochemical behavior of nickel sheets on
exposure to a mixture of biomaterial solutions (cell culture media). The nickel
sheets used in this research were designed as filters (see Fig. 2-13). They found
that the droplet contact angle of the Ni sample is 128.3°, which shows the dry
nickel samples are hydrophobic [39].
Hexagonal-shaped nickel micromeshes (see Fig. 2-14) were designed and
fabricated and their water-repellent and water-proofing abilities were investigated
by Lee and his collaborators [8]. By the effect of the micromesh and PPFC
coating, the contact angles were increased sharply from 63° of the non-coated
flat nickel to 140° of the PPFC-coated micromesh to modify the surface from
hydrophilic to superhydrophobic. The hole size and increasing the lattice width of
the micromesh are necessary to improve the water- proofing ability. The
proposed nickel micromesh sheets can be applied to many application areas that
require water-blocking yet must allow passage of gases or sound waves.
Examples include water- proof phones/speakers and water-proof gas detectors
[8].
irtii#iitiHitiii
Fig. 2-14. Fabricated nickel micromesh sheet: (a) photograph of a nickel micromesh prototype unit, (b) & (c) magnified SEM images of the micromesh [8].
Lotus leaf surface-textured nanocrystalline (NC) Ni films, developed by
replicating the original biotexture, modified using a selective electrodeposition
and a PFPE solution treatment were fabricated by Shafiei and Alpas (see Fig.
2-15). The superhydrophobicity of the NC Ni films is attributed to successful
development of a multi-level surface roughness (where a nanoscale surface
texture was superimposed on a microscale structure of protuberances) with a low
surface energy [4].
NC Ni crowns nanostructured by PFPE solution
ft
crowns" [4].
The hydrophobic and protective mechanism has been evaluated [38] by water
contact angle measurements on pure copper, nickel, and gold deposits together
with nickel/gold plating on copper (before and after treatment with the gold
post-dip). The tests for a nickel surface (surface energy of nickel is 2.45 J/m2) showed
a contact angle of approximately 92 ° after treatment with the post-dip. Hence,
despite nickel possessing considerably higher surface energy, thereby making it
more hydrophilic, Beratec post-dip treatment was very effective at imparting
hydrophobic surface properties (Fig. 2-16).
Fig. 2-16. Wetting of an acid-activated nickel surface by water after treatment with Betatec gold post-dip, e=92" [38]
2.2.1.3. Hydrophobic surfaces on copper
Han et al. [9] attempted to mimick nature by combining the features of metallic
and organic coatings in the protective coating of a metal surface. According to
their results, nanostructured copper sulfide was formed on the micro-structured
copper surfaces, and the hydrophobization was successfully performed with a
perfluorosilane compound via a solution process, resulting in the formation of
ultra water-repellent metal surfaces. The obtained surface structure is shown in
Fig. 2-17. Superhydrophobic surfaces composed of interconnected Cu(OH)2
nanowires were constructed on copper plates via a simple immersion process in
an aqueous solution by Pan et al [40]. They claimed this method is easy, fast,
inexpensive and environmentally friendly. Since copper can easily be coated on
the surfaces of various engineering metals, their results introduced a new
pathway for the fabrication of superhydrophobic surfaces on engineering metals
with many industrial applications. Xi and his collaborators [41] prepared copper
roughnesses. Some of the prepared copper surfaces behaved hydrophobic
without chemical modification. When the surface configuration was properly
fabricated, super-hydrophobicity could be obtained even on a hydrophilic
substrate. Fig. 2-18 shows the SEM images of the copper surfaces where
spherical grains are observed.
Fig. 2-17. SEM images of the formation of the superhydrophobic metal surface and an image of a water drop on this surface: (a) the as-deposited copper surface; (b) High magnification image of the copper surface after electrochemical reaction with sulfur gas at 150 °C for 10 min; (c) Low magnification image of (b); (d) Schematic diagram of the formation of the micro- and nanostructured metal surface; (e) Optical image of a water drop on the surface in (b) [9].
Liu et al. created a novel super-hydrophobic film by n-tetradecanoic acid
chemically adsorbed onto the copper sample. They suggested that a composite
interface formed by the flower-like surface nanostructures, water droplet and air
trapped in the crevices is responsible for the superior water-repellent property
(Fig. 2-19). Their findings show that hydrophobicity plays an important role in
corrosion behavior compared to the film thickness. Corrosion of copper was
effectively inhibited by formation of a super-hydrophobic film [13]. In another
similar work, n-tetradecanoic acid (CH3(CH2)i2COOH) etch, the
microstructural results showed that the film is similar to haulm (a plant) or flower
and the seawater contact angle is larger than 150°. The results prove that the
super-hydrophobic surface can significantly improve the corrosion resistance of
copper. As said, this method is a simple and inexpensive one to create
superhydrophobic surfaces on copper. However, The interaction of pure
n-tetradecanoic acid and copper surface was very weak, so
bis-[triethoxysilylpropyljtetrasulfide (BTESPT) was used to link n-tetradecanoic acid
and copper surface in order to enhance their interaction [42].
Fig 2-18. SEM images of the copper surfaces with different produced at different current densities- (a) current density = 0 04 A/cm2, contact angle =125' (b) Current density = 0 08
A/cm2, Contact angle = 153 S (c) Enlarged SEM image on surface b (d) Current density = 0 10
A/cm2, Contact angle = 132 5 [41]
Wu and Shi [43] fabricated a lotus-like micro-nanoscale binary structure
surface of copper phosphate dihydrite using galvanic cell corrosion of a copper
foil with aqueous phosphorus acid solution droplets. They showed that the
surface wettability can be changed from superhydrophilic to highly hydrophobic
or superhydrophobic by just heating or modify it with an n-dodecanethiol
monolayer. This method can be easily scaled up and has potential applications in
industry for producing superhydrophobic materials and it is able to be applicable
for making other interesting micro-nanoscale structures using a different
electrolyte or changing the substrate to another metal or alloy.
2.2.1.4. Hydrophobic surfaces on aluminum
Cho et al. designed and synthesized a new random copolymer, poly
(TMSMA-r-fluoroMA), with the aim of fabricating superhydrophobic surfaces on
oxide-based substrates. As a model substrate, they fabricated aluminum substrates
with varying roughnesses by controlled anodic oxidation. A superhydrophobic
surface was generated with the polymer coated nanoporous anodic aluminum
oxide (AAO) substrate (Fig. 2-20). They suggested that poly (TMSMAr- fluoroMA)
could be applied to the coating of a variety of hydroxyl-presenting materials, such
as glass, Si wafers, polymers, and other metals [20].
Fig. 2-20. FE-SEM images of the textured aluminum sheet: (a) top view and (b) tilted view. The scale bar is 1 pm [20].
Barkhudarov and his co-workers investigated the effectiveness of
superhydrophobic films as corrosion inhibitors. They concluded that the extreme
case of a superhydrophobic coating with a contact angle of >160° decreases the
rate of corrosion roughly tenfold compared to the unprotected aluminum. Fig.
conditions. More importantly, making the protective layer superhydrophobic
rather than hydrophilic improved corrosion by a factor of six [15].
0
-10
£
is
§ _, -20 • s |
a .3
%£ -30
6
-40
0 5 l O 15 2 0 2 5 3 0
Time (Hours)
Fig. 2-21. The change in thickness of the aluminum layer versus time for samples protected by films of varying contact angle and a sample with only native Al203 layer (without protective film)
[15].
Liu and his collaborators have successfully created a superhydrophobic
surface on aluminum surface by an anodization process and chemical
modification using myristic acid. The electrochemical measurements showed that
the superhydrophobic surface significantly improves the corrosion resistance of
aluminum in sterile seawater. The superhydrophobic surface affects mainly on
the aluminum anodic reaction, whose currents (Icorr) are reduced by about three
orders of magnitude, the corrosion potential (Ecorr) shifts positively by 0.2 V
when the anodized aluminum is covered with the myristic acid (Fig. 2-22). It is
believed that this method can be easily applied to large scale production of
superhydrophobic engineering materials with ocean industrial applications [7].
In another research Liu et al. [16] studied the use of superhydrophobic surfaces
on aluminum as a method for inhibition of microbially influenced corrosion (MIC).
Their study claims that the superhydrophobic film does not only decrease the
corrosion current densities (Icorr), but also microbially influencing corrosion
acceleration inhibition (MICI) due to preventing colonization of microorganisms
[16]. The analysis of potentiodynamic polarization, EIS and appropriate
inhibited by the formation of a stable super-hydrophobic film [17]. Fig. 2-23
shows the untreated and treated surfaces of aluminum prepared by myristic acid
in Yin et al. 's research.
Fig. 2-23. SEM images of (a) the untreated aluminum and (b) the superhydrophobic aluminum surfaces [17]
The electrochemical measurements [18] showed that the super-hydrophobic
surface significantly improves the corrosion resistance of aluminum in sterile
seawater. The proposed mechanism of the underwater superhydrophobic
surface applied in the corrosion resistance is presented by He and co-workers in
a schematic figure (Fig. 2-24). The figure shows a surface with roughness of 2
the surface and because of the roughness a portion (white areas) of the surface
is unwetted.
&9#wm%t Jg* 9/ ^Mr^
*" M'~s-"J _S^Pfc«*Cr.*^"
2|mi
is3sBs& **<"
?&-*<?
«nr
%K
__X
jfi? **gl3|gj*£
J&Bf"*^ •
V
.
\
. * I
Fig 2-24 A schematic of a rough surface immersed in seawater [18]
2.2.1.5. Hydrophobic surfaces on other materials
A superhydrophobic film was prepared by myristic acid chemically absorbed onto
the polyethyleneimine (PEI) coated Fe^AI-type intermetallic wafer. Liu at al.
demonstrated a simple and inexpensive method to create superhydrophobic
surface on F e ^ / [36]. Anodic films were prepared on the AZ91D magnesium
alloy in the electrolyte of 1.0 M Na2Si03 with and without the addition of silica sol
by Li's group [44]. The addition of silica sol increases the thickness of the anodic
film and improves the roughness of the film surface. As a result, such anodic
films reveal some hydrophobic property. Moreover, the anodic film formed with a
sol addition reveals higher hydrophobicity and provides higher corrosion
resistance for AZ91D Mg alloy than the anodic films formed in the base
electrolyte with more or less silica sol addition [44].
Narhe and collaborators [45] studied the water condensation on a metallic zinc
surface, regularly used as anticorrosive surface. The zinc surface was coated
with hydroxide zinc carbonate by chemical bath deposition. The results show
that, on such surfaces, water condensation, although a complex and challenging
process, is similar to smooth planar surfaces. As the nucleation events occur at a
much smaller length scale than the surface texture scales, the surface chemistry
dominates the texture effects during condensation and therefore leads to similar
results as on a smooth surface. In particular, it is noticeable in view of corrosion
a simple and powerful method to modify the surface roughness and wettability,
from hydrophobic to superhydrophobic.
It is feasible to create a super-hydrophobic PDMS surface with ultra-low water
adhesive force by a simple one step laser-cutting method, which can also be
extended to fabricate other polymers. Jin et al. [10] demonstrated a facile
one-step laser-etching method to fabricate rough polydimethylsiloxane (PDMS)
surface containing micro-, submicro-, and nano composite structures. The SEM
image of created microstructure is shown in Fig. 2-25. Spori et al. [46] analyzed
four different (sandblasted glass slides as well as replicas of acid etched,
sandblasted titanium, lotus leaves, and photolithographically manufactured
golf-tee shaped micropillars [GTMs]), heavily structured over a wide range of surface
energies via water contact angle measurements. With regard to
superhydrophobic surfaces, the golf-tee-shaped (GTM) pillars show stable
superhydrophobicity over a wide range of surface energies. This topography
seems to be a very effective design for microstructured, superhydrophobic
surfaces.
Wu et al. [47] studied the influence of chemical and morphological
modifications on the hydrophobicity of a silica based sol-gel hard coating. The
substrate was anodized aluminum alloy AA6061. They obtained a sol-gel coating
material and process which provides a one-step and low-cost method to obtain
hydrophobic coatings with hard and durable properties for industrial applications.
Shen and his co-workers prepared nano-Ti02 coatings on the surface of the type
316L stainless steel and improved its corrosion resistance. To increase the
surface hydrophobic property, fluoroalkylsilane (FAS-13) was applied on the
surface of nano-Ti02 coating using a self-assembly method. Their
electrochemical test results indicated that the hydrophobic coatings have an
excellent corrosion resistance in oxygen-saturated Ringer solution (Ringer's
solution technically refers only to the saline component, without lactate). The
corrosion potentials shift positively, lCOrr decreases by three orders of magnitude,
![Fig 2-2 Anodic polarization curves of smooth and rough steel substrates (AISI 4340), a-Ta coatings deposited on these substrates and of Ta foil, in 0 5 M H2S04 deaerated with N2 at room temperature [27]](https://thumb-us.123doks.com/thumbv2/123dok_us/1449973.1177622/22.600.162.473.199.443/anodic-polarization-substrates-coatings-deposited-substrates-deaerated-temperature.webp)

![Fig 2-19 Model of the interface between super-hydrophobic surface and sterile seawater [13]](https://thumb-us.123doks.com/thumbv2/123dok_us/1449973.1177622/37.599.157.455.248.464/fig-model-interface-super-hydrophobic-surface-sterile-seawater.webp)
![Fig. 2-21. The change in thickness of the aluminum layer versus time for samples protected by films of varying contact angle and a sample with only native Al203 layer (without protective film) [15]](https://thumb-us.123doks.com/thumbv2/123dok_us/1449973.1177622/39.601.206.393.125.296/thickness-aluminum-versus-samples-protected-varying-contact-protective.webp)
![Fig 2-24 A schematic of a rough surface immersed in seawater [18]](https://thumb-us.123doks.com/thumbv2/123dok_us/1449973.1177622/41.599.223.403.124.232/fig-schematic-rough-surface-immersed-seawater.webp)