University of Windsor University of Windsor
Scholarship at UWindsor
Scholarship at UWindsor
Electronic Theses and Dissertations Theses, Dissertations, and Major Papers
2013
New Directions for Solid-State NMR of Insensitive Nuclei:
New Directions for Solid-State NMR of Insensitive Nuclei:
Applications to Metal Nuclei in Inorganic Materials
Applications to Metal Nuclei in Inorganic Materials
Bryan Lucier
University of Windsor
Follow this and additional works at: https://scholar.uwindsor.ca/etd
Recommended Citation Recommended Citation
Lucier, Bryan, "New Directions for Solid-State NMR of Insensitive Nuclei: Applications to Metal Nuclei in Inorganic Materials" (2013). Electronic Theses and Dissertations. 4909.
https://scholar.uwindsor.ca/etd/4909
New Directions for Solid-State NMR of Insensitive Nuclei:
Applications to Metal Nuclei in Inorganic Materials
by
Bryan Edward Gregory Lucier
A Dissertation
Submitted to the Faculty of Graduate Studies
through the Department of Chemistry and Biochemistry
in Partial Fulfilment of the Requirements for
the Degree of Doctor of Philosophy at the
University of Windsor
Windsor, Ontario, Canada
New Directions for Solid-State NMR of Insensitive Nuclei:
Applications to Metal Nuclei in Inorganic Materials
by
Bryan Edward Gregory Lucier
APPROVED BY:
______________________________________________ B. Chmelka, external examiner
University of California, Santa Barbara
______________________________________________ C. Rangan
Department of Physics
_____________________________________________ J. Wang
Department of Chemistry and Biochemistry
_____________________________________________ S. H. Eichhorn
Department of Chemistry and Biochemistry
____________________________________________ R. W. Schurko, Advisor
Department of Chemistry and Biochemistry
iii
Declaration of Co-Authorship/Previous Publication
This thesis is presented in manuscript format, as outlined in the guidelines set forth
by the Faculty of Graduate Studies. Chapters 2 and 6 of the work discussed in this
dissertation have previously been published in peer-reviewed journals where I was the
primary author:
Chapter 2: Lucier, B.E.G., Reidel, A.R., and Schurko, R.W. Multinuclear Solid-State NMR of Square-Planar Platinum Complexes: Cisplatin and Related Systems. Can. J. Chem.2011, 89, 919-937.
Chapter 6: Lucier, B.E.G., Tang, J.A., Schurko, R.W., Bowmaker, G.A., Healy, P., and Hanna, J.V. Solid-State 65Cu and 31P NMR Spectroscopy of
Bis(triphenylphosphine) Copper Species. J. Phys. Chem. C. 2010, 114,
7949-7962.
I am also the primary author of Chapters 3 and 5, which are planned for publication.
Chapter 4 was a collaborative effort (vide infra) and portions have been published in
peer-reviewed journals:
Chapter 4: Thibault, M.-H., Lucier, B.E.G., Schurko, R.W., and Fontaine, F.-G. Synthesis and Solid-State Characterization of Platinum Complexes with Hexadentate Amino- and Iminophosphine Ligands. Dalton Trans., 2009, 7701-7716.
I acknowledge my advisor, Professor Robert W. Schurko, as a co-author in this work
who made key contributions to writing and editing of all manuscripts. I hereby declare that
this thesis incorporates material that is a result of joint research, as follows:
Chapter 2, “Multinuclear Solid-State NMR of Square-Planar Platinum Complexes:
Cisplatin and Related Systems,” includes contributions from Alex R. Reidel, who was an
undergraduate student in our research group who assisted with sample preparation and ab
Chapter 3, “Solid-State NMR of Magnus' Green and Pink Salts,” is a collaboration
with several members of Brookhaven National Laboratory/National Synchrotron Light
Source in the USA. Sanjaya D. Senanayake acquired the pXRD patterns, Wenqian Xu and
Jonathan C. Hanson performed Lebail fittings and interpretation of pXRD data, and Megan
Bourassa conducted and analyzed IR experiments. Monika Srebro of Jagiellonian University
in Poland as well as Jochen Autschbach at the University at Buffalo, State University of New
York performed ab initio calculations and contributed to the ab initio section of this chapter.
Karen E. Johnston in Windsor also made contributions to the resolution of this project in
terms of data analysis and interpretation. Victor Terskikh of the NMR 900 facility at the
NRC in Ottawa, ON was responsible for acquiring 35Cl SSNMR spectra.
The “Applications of 195Pt Solid State NMR” detailed in Chapter 4 describes the
results of two works, one published and one ongoing. “Synthesis and Solid-State
Characterization of Platinum Complexes with Hexadentate Amino- and Iminophosphine
Ligands” was published by collaborators Marie-Hélène Thibault and Frédéric-Georges
Fontaine at Université Laval in Quebec. I acquired all SSNMR spectra and wrote the
SSNMR portions of the manuscript in conjunction with my supervisor, Robert W. Schurko.
“Solid-State NMR of Vapochromic Pt(bipy)(CN)2” is unpublished work in which I am the
primary author and includes contributions from Daniel Klauke, an undergraduate student in
our research group.
Chapter 5, “Multinuclear Solid-State NMR of (H3O)Y3F10•xH2O Nanoparticles,”
consists of work in which I am the primary author. Karen E. Johnston of Windsor and
v
pXRD data. Collaborators Jean-Luc Lemyre, Ariane Beaupré, Maxime Blanchette, and
Anna M. Ritcey at Laval University in Québec performed the synthesis of the compounds
studied.
The final chapter, “Solid-State 65Cu and 31P NMR Spectroscopy of
Bis(triphenylphosphine) Copper Species,” is a manuscript for which I am the primary author.
Joel A. Tang assisted with the acquisition of SSNMR spectra in Windsor. Sample synthesis
was performed by collaborators Graham A. Bowmaker of the University of Auckland, New
Zealand and Peter C. Healy of Griffith University, Australia. John V. Hanna of the
University of Warwick, U.K. also contributed to sample preparation, as well as NQR
measurements and some editing of the manuscript.
I am aware of the University of Windsor Senate Policy on Authorship and I affirm
that I have acknowledged the contribution of other individuals to my thesis, and I have
obtained permission from each of the co-authors to include the aforementioned material in
my thesis. I certify that the previously mentioned material describes work completed during
my registration as a graduate student at the University of Windsor.
I declare that, to the best of my knowledge, my thesis does not infringe upon anyone's
copyright nor violate any proprietary rights and that any ideas, techniques, quotations, or any
other material from the work of other people included in my thesis, published or otherwise,
are fully acknowledged in accordance with standard referencing practices. To the extent that
I have included copyrighted material that surpasses the bounds of fair dealing within the
meaning of the Canada Copyright Act, I certify that I have obtained a written permission
obtained permission from the copyright owner(s) to include previously published material
vii
Abstract
This thesis is largely devoted to solid-state NMR (SSNMR) studies of insensitive nuclei, which are challenging to study via conventional NMR experiments due to their low natural abundances, low gyromagnetic ratios, and/or anisotropically broadened powder
patterns. SSNMR experiments on insensitive nuclei such as 195Pt, 89Y, 65Cu, 35Cl, and 14N
hold much promise for elucidation of structure and bonding within inorganic and
organometallic systems. Herein, I describe the use of novel NMR pulse sequences and
acquisition methodologies, in combination with X-ray diffraction (XRD) techniques and
quantum chemical calcuations of NMR interaction tensors, for this purpose.
This thesis begins with a brief introduction to NMR, followed by a proof-of-concept
multinuclear (195Pt, 14N, 35Cl) study on cisplatin and several related square-planar Pt(II)
species. This work is extended to the structural determination of Magnus' Pink Salt, in
conjunction with refinements of powder XRD data and ab initio calculations. Two further
applications of 195Pt solid-state NMR follow: determination of Pt oxidation state and
coordination with hexadentate ligands, and investigation of Pt vapochromism in the
Pt(bpy)CN2 system. NMR experiments involving insensitive 89Y nuclei, in conjunction with
19F NMR and powder XRD data, are applied for the structural elucidation of
(H3O)Y3F10•xH2O nanoparticles. Lastly, the use of 65Cu and 31P SSNMR for investigation of a series of bis(triphenylphosphine) copper(I) complexes is described. A wide variety of
materials may be characterized using information derived from SSNMR experiments on
ix
Acknowledgements
At the conclusion of a Physical Chemistry class in Fall 2004, Professor Robert W.
Schurko called out my name. To be accurate, he also called out the name of over a dozen
other second-year undergraduate students in the class. Us students were part of a scholarship
that also allowed us the opportunity to pursue research interests, Rob was responsible for
helping to run the program, and we hadn't exactly pursued our research interests yet.
After taking a tour of the department and meeting all of the faculty, I decided I wanted
to work in the Schurko lab (or for “Team Solid State”, as it was affectionately known at the
time), and Rob was later gracious enough to further supervise me as a graduate student. I
would like to thank him for the opportunity to work in his research group and for his
contributions toward this thesis, as well as my maturity as a person. Rob has been very
patient and supportive during my growth as a graduate student and gave me the opportunity
to travel to many conferences domestically and in the USA, as well as to the NRC facility in
Ottawa for work at the high-field facility. Rob, along with my undergraduate and
early-graduate co-supervisors Joel Tang and Cory Widdifield, lead by example in work ethic
and went far above their requirements to help me out, even on weekends and at odd hours.
Rob, Joel and Cory were very helpful and were always available to demonstrate any lab
techniques or troubleshoot issues with the spectrometer.
I have had the privilege of working with many other talented individuals. I have
worked with three outstanding postdoctoral fellows, Karen Johnston, Kris Harris, and Luke
O'Dell, who were always available to explain any NMR-related questions and assist with
in Chapters 4 and 6 to a close, and somehow was also always tolerant of a
poorly-impersonated Scottish accent. Luke and Kris took the time to design and implement
key NMR pulse sequences used in this thesis, and without them, experimental times would
have been astronomical and several of these chapters would certainly be lacking. Andy Lo
was helpful with 19F experimental setup and demonstrating proper fashion trends. Hiyam
Hamaed was always available for advice, whether in NMR or a variety of other fields, and
was the author of several well-executed, but always humourous, jokes at my expense. Aaron
Rossini was an extremely knowledgeable and helpful colleague as well as an excellent
teammate on our chemistry soccer and ball hockey teams. Alan Macgregor and Marcel
Hildebrand are acknowledged for their efforts to bring sanity and order to the Schurko Lab
during the course of their MSc. degrees. Stanislav Veinberg was always available to help
with computer and technical issues, and is acknowledged for his assistance with the Magnus'
Salt project. Chris O'Keefe is also acknowledged for his helpful advice with laboratory
techniques.
I would like to thank the undergraduate students who have worked with me, Alex
Reidel, Daniel Klauke, and Michael Roslan. Their contributions, hard work, and deadpan
humour have been instrumental to the completion of several chapters in this dissertation.
Michael Jaroszewicz, Andrew Namespetra, Zack Friedl, Chris Mireault, Anthony Sandre, and
Michael Laschuk have been a pleasure to work with and contributed to many
thought-provoking lab discussions.
Dr. Matthew Revington and Mr. Mike Fuerth are thanked for their helpful discussions
xi
Jezdic is also thanked for his help with hardware diagnostics and repair. Ms. Una Lee is
acknowledged for her advice regarding glassware, and for supplying the frits used in the
Magnus' Salt project. Ms. Janeen Auld is thanked for her efforts in running elemental
analyses as well as mass spectroscopy analyses.
I would like to thank the members of my advisory committee: Brad Chmelka, S.
Holger Eichhorn, Jichang Wang, and Chitra Rangan, for taking the time to attend various
meetings over the years, as well as providing helpful insights, suggestions, and
thought-provoking questions during our meetings.
I thank my partner Laura and my family for their love and support through the past
Table of Contents
Declaration of authorship/co-authorship and previous publications . . . iii
Abstract . . . vii
Dedication . . . viii
Acknowledgements . . . ix
List of tables . . . xvi
List of figures . . . xix
List of schemes . . . xxviii
List of abbreviations . . . xxix
List of symbols . . . xxxiii
1 Introduction to Nuclear Magnetic Resonance . . . 1
1.1 - Phenomenon of Nuclear Magnetic Resonance . . . 1
1.2 - Overview of NMR Interactions . . . 2
1.3 - Zeeman Interaction . . . 3
1.4 - RF Interaction . . . 5
1.5 - Relaxation Processes . . . 8
1.6 - Magnetic Shielding/Chemical Shift Interaction . . . 9
1.7 - Quadrupolar Nuclei and the Quadrupolar Interaction . . . 17
1.8 - Euler Angles . . . 23
1.9 - Indirect Spin-Spin Interaction (J-Coupling) . . . 24
1.10 - Direct Spin-Spin Interaction (Dipolar Coupling) . . . 25
1.11 - Residual Dipolar Coupling . . . 26
1.12 - Experimental NMR Techniques . . . 28
1.12.1 - Magic Angle Spinning . . . 28
1.12.2 - Cross-Polarization (CP) . . . 31
1.12.3 - Variable Amplitude Cross-Polarization (VACP) . . . 32
1.12.4 - Hahn-Echo and Carr-Purcell Meiboom-Gill (CPMG) Experiments . . . 33
1.12.5 - Wideband Uniform Rate Smooth Truncation (WURST) Pulse Sequence . . . 36
1.12.6 - BRoadband Adiabatic INversion - CP/WURST-CPMG Pulse Sequence . . . 37
1.12.7 - Variable Offset Cumulative Spectroscopy (VOCS) Piecewise Acquision . . . 40
1.13 - Quantum Calculations of NMR Tensor Parameters . . . 41
1.14 - Context of Research . . . 44
1.15 - Bibliography . . . 48
2 Multinuclear Solid-State NMR of Square-Planar Platinum Complexes: Cisplatin and Related Systems . . . 52
2.1 - Overview . . . 52
2.2 - Introduction . . . 53
2.3 - Experimental . . . 56
xiii
2.3.2 - Solid-State NMR . . . 58
2.3.3 - Theoretical Calculations . . . 60
2.4 - Results and Discussion . . . 62
2.4.1 - 195Pt WURST-CPMG SSNMR Experiments: Cisplatin and Transplatin . 62 2.4.2 - Pt(py)2Cl2, Pt(en)Cl2, and Carboplatin . . . 65
2.4.3 - 195Pt Hahn-Echo SSNMR Experiments . . . 66
2.4.4 - 195Pt MAS SSNMR Experiments . . . 68
2.4.5 - First Principles Calculations of Platinum Magnetic Shielding Tensors: Comparison of Experimental and Calculated Results . . . 72
2.4.6 - Platinum MS Tensor Orientations . . . 76
2.4.7 - 195Pt T 1 and T2 Relaxation Measurements . . . 77
2.4.8 - 14N WURST-QCPMG SSNMR Experiments . . . 80
2.4.9 - First Principles Calculations of 14N EFG Tensors . . . 82
2.4.10 - 14N T 2 Relaxation Measurements . . . 85
2.4.11 - 35Cl WURST-QCPMG SSNMR Experiments . . . 86
2.4.12 - First Principles Calculations of 35Cl EFG Tensors . . . 90
2.4.13 - 35Cl T 2 Relaxation Measurements . . . 92
2.5 - Conclusions . . . 93
2.6 - Bibliography . . . 96
3 Solid-State NMR of Magnus' Green and Pink Salts . . . 103
3.1 - Overview . . . 103
3.2 - Introduction . . . 104
3.3 - Experimental . . . 108
3.3.1 - Sample Identities . . . 108
3.3.2 - Synthesis of Magnus' Pink Salt (MPS) . . . 108
3.3.3 - Solid-State NMR . . . 110
3.3.4 - Theoretical Calculations . . . 112
3.3.5 - Powder X-ray Diffraction . . . 114
3.3.6 - Elemental Analysis . . . 115
3.3.7 - Infrared Spectroscopy . . . 115
3.4 - Results and Discussion . . . 116
3.4.1 - 195Pt WURST-CPMG Experiments . . . 116
3.4.2 - 1H-195Pt BRAIN-CP/WCPMG Experiments . . . 120
3.4.3 - 195Pt Hahn-Echo and 1H-195Pt CP-echo NMR Experiments . . . 121
3.4.4. - 195Pt MAS NMR Experiments . . . 125
3.4.5 - 14N WURST-CPMG and 1H-14N BRAIN-CP/WCPMG Experiments . . 128
3.4.6 - 35Cl WURST-CPMG Experiments . . . 133
3.4.7 - Powder X-ray Diffraction Experiments and Refinement of MPS Data . 137 3.4.8 - Proposed Structural Model of MPS . . . 140
3.4.9 - Ab Initio Calculations . . . 144
3.5 - Conclusions . . . 153
4 Applications of 195Pt Solid-State NMR . . . 162
4.1 - Overview . . . 162
4.2 - Solid-State NMR of Platinum Complexes with Hexadentate Amino- and Iminophosphine Ligands . . . 163
4.2.1 - Introduction . . . 163
4.2.2 - Experimental . . . 164
4.2.2.1 - Sample Preparation . . . 164
4.2.2.2 - Solid-State NMR . . . 165
4.2.3 - Results and Discussion . . . 167
4.2.3.1 - Solid-State NMR of the Pt(0) Complex . . . 167
4.2.3.2 - Solid State NMR of the Pt(II) Iodine Complexes . . . 171
4.2.3.3 - Solid State NMR of the Pt(II) Chlorine Complex. . . 173
4.2.4 - Conclusions . . . 178
4.3 - 195Pt Solid-State NMR Investigations of Vapochromic Pt(bpy)CN 2 . . . 179
4.3.1 - Introduction . . . 179
4.3.2 - Experimental . . . 181
4.3.2.1 - Sample Synthesis and Preparation . . . 181
4.3.2.2 - Solid-State NMR . . . 182
4.3.2.3 - Theoretical Calculations . . . 183
4.3.2.4 - Elemental Analysis . . . 184
4.3.3. - Results and Discussion . . . 185
4.3.3.1 - WURST-CPMG Experiments: K2PtCN4•xH2O and Pt(CN)2•xH2O 185 4.3.3.2 - WURST-CPMG Experiments: Pt(bpy)(CN)2 and Pt(bpy)(CN)2•xH2O . . . 191
4.3.3.3 - MAS Experiments . . . 193
4.3.3.4 - Theoretical Calculations . . . 195
4.3.4 - Conclusions and Future Work . . . 199
4.4 - Bibliography . . . 201
5 Multinuclear Solid-State NMR of (H3O)Y3F10•xH2O Nanoparticles . . . 208
5.1 - Overview . . . 208
5.2 - Introduction . . . 209
5.3 - Experimental . . . 211
5.3.1 - Synthesis of Single Crystal (H3O)Y3F10•xH2O Nanoparticles . . . 211
5.3.2 - Solid-State NMR . . . 214
5.3.3 - Powder X-ray Diffraction . . . 216
5.4 - Results and Discussion . . . 217
5.4.1 - Powder X-ray Diffraction . . . 217
5.4.2 - 1H MAS NMR Experiments . . . 222
5.4.3 - 19F MAS Experiments . . . 226
5.4.4 - 19F-89Y VACP/MAS NMR Experiments . . . 236
5.4.5 - Static 19F-89Y VACP NMR Experiments . . . 242
5.5 - Conclusions . . . 249
xv
6 Solid-State 65Cu and 31P NMR Spectroscopy of Bis(triphenylphosphine) Copper
Species . . . 258
6.1 - Overview . . . 258
6.2 - Introduction . . . 259
6.3 - Experimental . . . 265
6.3.1 - Sample Preparation . . . 265
6.3.2 - Solid-State NMR . . . 265
6.3.3 - Theoretical Calculations . . . 267
6.3.4 - NQR . . . 267
6.4 - Results and Discussion . . . 268
6.4.1 - Ultra-Wideline 65Cu SSNMR. [(PPh 3)2CuO2CCHnF3-n] Series . . . 269
6.4.2 - [(PPh3)2CuO2N] and [(PPh3)2CuO2NO] . . . 273
6.4.3 - [(PPh3)2CuO2CH] and [(PPh3)2CuO2CPh] . . . 275
6.4.4 - WURST-QCPMG Experiments . . . 275
6.4.5 - 31P CP/MAS NMR . . . 279
6.4.6 - 65Cu and 31P NMR of [(PPh 3)2CuBH4] . . . 285
6.4.7 - Theoretical Calculations of 65Cu EFG Tensors . . . 287
6.4.8 - Copper NMR Parameters and Molecular Structure . . . 291
6.4.9 - Copper Chemical Shift Anisotropy . . . 292
6.4.10 - Copper NQR . . . 293
6.5 - Conclusions . . . 297
6.6 - Bibliography . . . 298
7 Conclusions and Future Directions . . . 305
8 Appendices Appendix A - Chapter 2 . . . 311
Appendix B - Chapter 3 . . . 332
Appendix C - Chapter 4 . . . 356
Appendix D - Chapter 5 . . . 363
Appendix E - Chapter 6 . . . 376
List of Tables
Chapter 2: Multinuclear Solid-State NMR of Square-Planar Platinum Complexes: Cisplatin and Related Systems
2.1 195Pt static NMR experimental parameters . . . 63
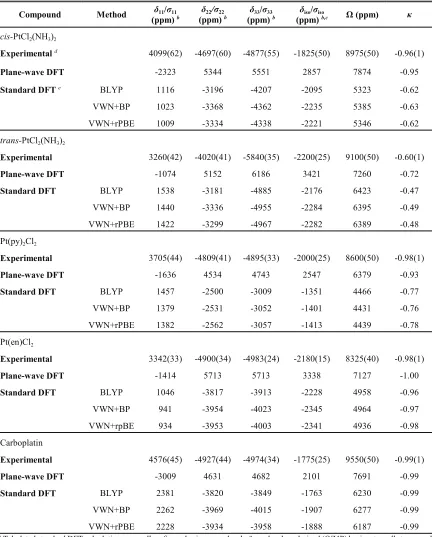
2.2 195Pt experimental and calculated CS tensor parameters . . . 75
2.3 Experimental 14N EFG tensor parameters . . . 81
2.4 Experimental and calculated 14N EFG tensor parameters. . . 84
2.5 Experimental 35Cl EFG tensor parameters . . . 86
2.6 Experimental and calculated 35Cl EFG tensor parameters. . . 92
Chapter 3: Solid-State NMR of Magnus' Green and Pink Salts 3.1 Platinum chemical shift tensor parameters determined from 195Pt static and MAS NMR experiments. . . 119
3.2 Experimental 14N EFG tensor parameters. . . 130
3.3 Experimental 35Cl NMR parameters . . . 135
3.4 Powder X-ray diffraction refinement parameters of MPS crystal structure . . . 140
3.5Calculated ZORA 195Pt isotropic shielding and experimental chemical shifts for Magnus' Green Salt and reagents . . . 146
3.6195Pt NMR comparison of Magnus' Green Salt and reagents. . . 146
3.7 Calculated spin-orbit ZORA 195Pt shielding tensors for MGS and reagents . . . 147
xvii
Chapter 4: Applications of 195Pt Solid-State NMR
4.1. 1H-195Pt static CP/CPMG NMR chemical shift tensor parameters . . . 170
4.2. 1H-31P CP/MAS NMR chemical shift tensor parameters. . . 171
4.3. 195Pt MAS NMR chemical shift tensor parameters . . . 178
4.4 Platinum chemical shift tensor parameters determined from 195Pt static and MAS NMR experiments . . . 189
4.5 Pt MS tensor parameters calculated via standard DFT methods on isolated
clusters . . . 197
4.6 Pt MS tensor parameters calculated via plane-wave DFT methods.a . . . 198
Chapter 5: Multinuclear Solid-State NMR of (H3O)Y3F10•xH2O Nanoparticles
5.1 Synthetic parameters for (H3O)Y3F10 • xH2O nanoparticle samples . . . 214
5.2 Structural parameters for the 67 nm (H3O)Y3F10 • 0.6H2O nanoparticles. Space group Fd-3m, a = 15.4876(9) Å and V = 3715.0(4) Å3. χ2 = 1.14, wR
p = 3.99 % and Rp = 6.23 %. . . 218
5.3 Relevant interatomic lengths obtained from Rietveld refinement of the 67 nm
diameter (H3O)Y3F10 • 0.6H2O nanoparticle pXRD pattern. . . 221
5.4 Relative integrated areas (including spinning sidebands) of resonances in 19F MAS NMR spectra of hydrated (H3O)Y3F10 • xH2O nanoparticles and bulk YF3. A, B, C, F1, and F2 refer to resonance labels, from high to low frequency (see Figure 5.7). . . . 230
5.5 19F chemical shift tensor parameters extracted from MAS spectra of hydrated (H3O)Y3F10 • xH2O nanoparticles and bulk YF3 via Herzfeld-Berger analysis of
spinning sidebands. . . 235
5.6 Relative integrated areas (including spinning sidebands) of resonances in 19F-89Y VACP/MAS NMR spectra of hydrated (H3O)Y3F10 • xH2O nanoparticles. a See
Figures 5.11, 5.12. . . 242
Chapter 6:Solid-State 65Cu and 31P NMR Spectroscopy of Bis(triphenylphosphine)
Copper Species
6.1 Experimental 65Cu NMR parameters . . . 272
6.2 Experimental 31P NMR parameters . . . 284
6.3 EFG tensor parameters calculated using the RHF method in the Gaussian03
software package . . . 289
6.4 Calculated orientation of the EFG tensor with respect to the P-Cu dipolar vector using the RHF method in the Gaussian03 software package . . . 290
xix
List of Figures
Chapter 1: Introduction to Nuclear Magnetic Resonance
1.1 The splitting of degenerate energy levels of a spin-1/2 nucleus in an external
magnetic field, B0, due to the Zeeman interaction. . . 4
1.2 The magnetic fields present in the rotating frame. The static field is reduced by a factor of ωrf/ω0, so in the case of an on-resonance pulse (ωrf = ω0), only B1 remains. . . 6
1.3 Orientation of bulk magnetization (top) and illustration of spin state populations (bottom) (a) at the instant an on-resonance pulse B1 is applied along the y-axis, (b) As
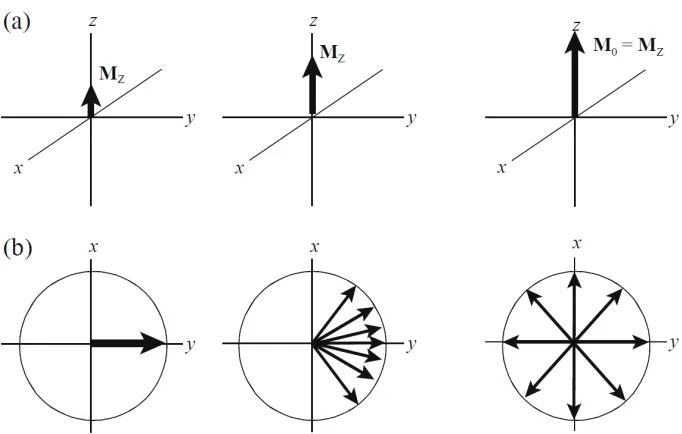
B1 tips M0 counterclockwise into the xy plane, and (c) In the xy plane (θ = 90E) at the conclusion of 90E pulse B1. . . 7 1.4 T1 relaxation is depicted in (a) and T2 relaxation is shown in (b). M0 denotes the net spin magnetization vector, MZ is the z-component of M0. . . . 9
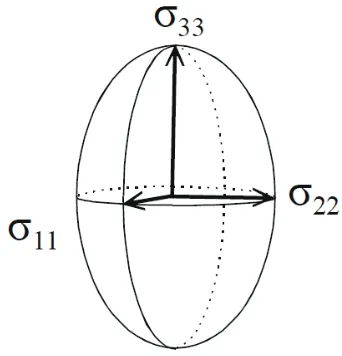
1.5 Visual representation of the chemical shielding tensor. . . 11
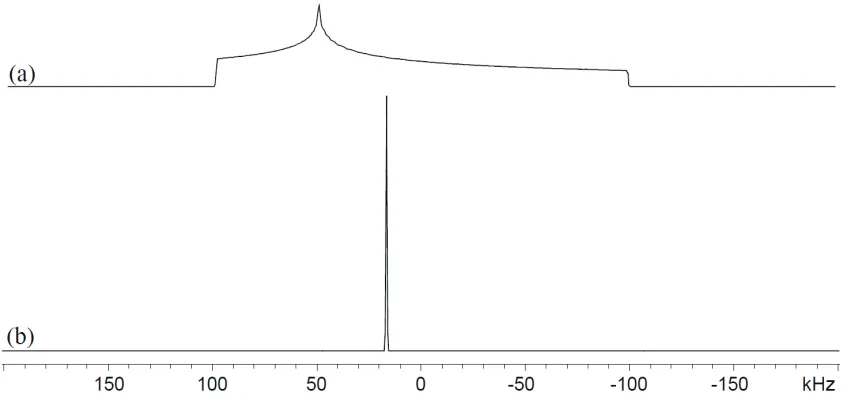
1.6 Averaging of the CSA demonstrated via a comparison of simulated (a) solid-state and (b) solution-state NMR spectra for a spin-1/2 nucleus. Intensity of solid-state
spectrum enhanced by ca. 10 x for clarity. . . 12
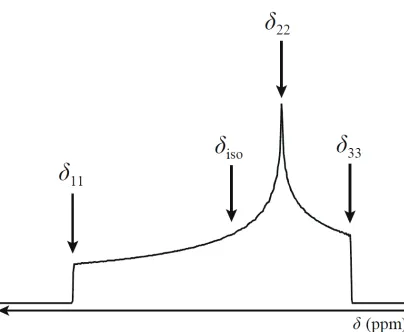
1.7 Simulation of a CSA-dominated NMR powder pattern, with arrows indicating CS tensor components. . . 15
1.8 (a), (b) - Shape of powder patterns according to the difference between the δ11 and δ33 components of the CS tensor. (c)-(f) - Shape of powder patterns according to symmetry of the CS tensor: (a) axial, (b) non-axial, (c) non-axial, and (d) axial
symmetry. . . 16
1.9 The splitting of energy levels of a spin-3/2 nucleus due to the Zeeman interaction, first-order quadrupolar interaction (FOQI), and second-order quadrupolar interaction (SOQI). CT denotes the central transition, ΔQ1 represents the change in transition energy due to the FOQI. ΔQ2 represents the change in transition energy due to t
he SOQI. . . 21
1.10 Effects of (a) the quadrupolar coupling constant (holding ηQ constant) and (b) the asymmetry parameter (holding CQ constant) on a central transition powder
1.11 The splitting of energy levels of a spin-1 nucleus due to the Zeeman interaction, first-order quadrupolar interaction (FOQI), and second-order quadrupolar interaction (SOQI). ΔQ1 represents the change in transition energy due to the FOQI.
ΔQ2 represents the change in transition energy due to the SOQI.. . . 22
1.12 An idealized spectrum exhibiting a Pake doublet, representing the two
separate 14N spin transitions .. . . 22
1.13 Euler angles (α, β, γ) linking the PAS system of the EFG and CS tensors. . . 24
1.14 The effect of residual dipolar coupling between a spin-1/2 and spin 3/2 nucleus, as observed in the spin-1/2 spectrum. . . 27
1.15 (a) For each of the Cu-P vectors, β = 90E and α ranges from 60 to 70E. (b) An alternate view of one of the dipolar vectors in the EFG tensor frame. . . 28
1.16 The Magic-Angle Spinning experiment angular dependence. A chemical
shielding tensor is represented by an ellipsoid.. . . 30
1.17 The cross-polarization pulse sequence. . . 32
1.18 Pulse sequences (left) and a representation of resulting spectra (right) of: (a) Standard one-pulse Bloch decay, experiment, (b) Hahn-echo experiment, and
(c) CPMG experiment. FT denotes a Fourier Transformation. . . 35
1.19 Schematic of the WURST pulse sequence. WURST-B and WURST-C denote two WURST pulses identical in phase profile and amplitude for broadband
“excitation” and refocusing, respectively. . . 36
1.20 Schematic of the BRAIN-CP/WCPMG pulse sequence. WURST-A is a distinct WURST pulsesfor broadband adiabatic inversion, WURST-B and WURST-C denote identical WURST pulses for broadband detection and refocusing, respectively . . . 38
1.21 The 195Pt spectrum of Pt(NH
3)4Cl2•H2O, acquired in the same period of time via (a) a 1H-195Pt CP-CPMG experiment (orange), and (b) a 1H-195Pt BRAIN-CP/WCPMG experiment (blue). A simulation of the ideal powder pattern is shown at top (c). . . 39
xxi
Chapter 2: Multinuclear Solid-State NMR of Square-Planar Platinum Complexes: Cisplatin and Related Systems
2.1 Static WURST-QCPMG 195Pt NMR spectra (bottom trace) and simulations (top trace) of (a) cisplatin and (b) transplatin . . . 63
2.2 Local structure of (a) cisplatin and (b) transplatin. Dashed lines indicate Pt-Pt and Pt-H contacts. Contacts are shown on the bottom transplatin Pt for clarity. . . 65
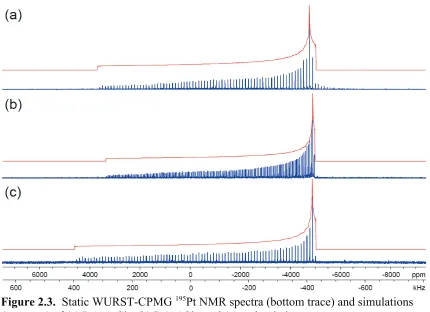
2.3 Static WURST-CPMG 195Pt NMR spectra (bottom trace) and simulations (top
trace) of (a) Pt(py)2Cl2, (b) Pt(en)Cl2, and (c) carboplatin. . . 66
2.4 Experimental 195Pt MAS spectrum of transplatin at a speed of 26 kHz (bottom trace), analytical simulation of experimental pattern (middle trace), and analytical simulation of experimental spectrum using parameters extracted from static
experiments (top trace). . . 70
2.5 (a) Calculated 195Pt MS vs CS values using plane-wave DFT calculations
(b) Calculated 195Pt MS vs CS values using standard DFT (BLYP) calculations . . . 74
2.6 Calculated 195Pt MS tensor orientations from standard DFT calculations
(plane-wave DFT calculations predict similar orientations). (a) Cisplatin, (b) transplatin, (c) Pt(py)2Cl2, (d) Pt(en)Cl2, and (e) carboplatin. σ11 is perpendicular to the page in all instances. . . 77
2.7 Static WURST-QCPMG 14N NMR spectra (bottom trace) and simulations (top trace) of (a) cisplatin, (b) transplatin, and (c) carboplatin. . . 81
2.8 Calculated 14N EFG tensor orientations of (a) cisplatin, (b) transplatin, (c)
carboplatin. V11 is perpendicular to the page in the case of cisplatin, V22 is perpendicular to the page in the case of transplatin and carboplatin. . . 85
2.9 Static WURST-QCPMG 35Cl NMR spectra at a magnetic field of 9.4 T (bottom trace) and simulations (top trace) of (a) cisplatin and (b) transplatin. Static
WURST-QCPMG 35Cl NMR spectra at a magnetic field of 21.1 T (bottom trace) and simulations (top trace) of (c) cisplatin and (d) transplatin . . . 87
2.10 Static WURST-QCPMG 35Cl NMR spectra (bottom trace) and simulations (top trace) of cisplatin at a magnetic field of 21.1 T, using (a) three unique 35Cl sites and (b) two unique 35Cl sites. In both cases, sites are simulated with equal weighting. . . 91
2.11 Calculated 35Cl EFG tensor orientations of (a) cisplatin, (b) transplatin. V 11 is
Chapter 3: Solid-State NMR of Magnus' Green and Pink Salts
3.1 195Pt static WURST-CPMG NMR spectra of (a) Pt(NH
3)4Cl2•H2O, (b) K2PtCl4, (c) Magnus’ Green Salt, and (d) 1H-195Pt static BRAIN-CP/WCPMG NMR spectrum of Magnus’ Pink Salt, (e) Pt(NH3)4Cl2•H2O, (f) MGS, and (g) Magnus’ Pink Salt. Asterisks (*) denote interference from local FM radio stations. Dashed lines indicate the high frequency edge (δ11) of the powder patterns of the starting reagents. . . 118
3.2 Individual static Hahn-echo 195Pt NMR spectra (i.e., single sub-spectra excited by a single rectangular pulse) of (a) Pt(NH3)4Cl2•H2O, (b) WURST-CPMG spectrum of K2PtCl4 co-added in the time domain, 47 c) Hahn-echo spectrum of MGS. 1H-195Pt CP-echo NMR spectra of MGS using a (d) 16 ms contact time and (e) 3 ms contact time, as well as CP-echo NMR spectra of MPS using a (f) 15 ms contact time and
(g) 3 ms contact time. . . 124
3.3 Individual 1H-195Pt CP-echo NMR spectra (i.e., single sub-spectra excited by a single rectangular pulse) of MPS. (a) A two-site simulation along with experimental spectra utilizing a contact time of (i) 3 ms and (ii) 15 ms. (b) Experimental spectrum (contact time of 3 ms) along with simulated spectra (dashed lines) accounting for two unique Pt sites in MPS along with Pt(NH3)4Cl2•H2Oand MGS impurities at a relative intensity of (i) 40% and (ii) 10 %. . . 125
3.4 195Pt MAS NMR spectra acquired at 9.4 T using (recycle delay): (a) MGS (40 s), (b) MPS (90 s), and (c) MPS (8 s). . . 127
3.5 14N static NMR spectra (bottom traces) and simulations (top traces) of (a) Pt(NH3)4Cl2•H2O, (b) MGS, and (c) MPS. Spectra on the left were acquired with direct-excitation WURST-CPMG experiments, spectra on the right were acquired
using 1H-14N BRAIN- CP/WCPMG experiments. . . 129
3.6 Static WURST-CPMG 35Cl NMR spectra acquired at 21.1 T (bottom traces) and simulations (top traces) of (a) K2PtCl4, (b) Pt(NH3)4Cl2•H2O (with Hahn-echo
experiment inset), (c) MGS, and (d) MPS. . . 136
3.7 Powder X-ray diffraction patterns of square-planar Pt complexes. Two separate batches of MPS product were studied in order to assess the reliability of the synthesis..139
xxiii
3.9 Visualization of the electron density map obtained via the refinement of MPS powder X-ray diffraction data. Yellow denotes Pt atoms, red denotes localized areas of electron density associated with Pt ligands. . . 142
3.10 Proposed structural model of MPS, based on SSNMR and pXRD data. Yellow denotes Pt atoms, blue denotes electron density assigned to -NH3 ligands, and green denotes electron density assigned to -Cl ligands. . . 143
3.11 Molecular clusters used in the NMR calculations. The numbers listed correspond to calculated (experimental) geometric parameters. . . 145
3.12 Graphical representations of the direction-dependent platinum shielding in (a) MGS and (b) K2PtCl4, with the corresponding principal components (in ppm) from SO ZORA calculations. Blue and orange indicate positive and negative shielding,
respectively. Polar plots of the shielding tensors are scaled by 0.025 pm/ppm.. . . 148
Chapter 4: Applications of 195Pt Solid-State NMR
4.1 (a)31P MAS NMR spectrum of 1, with 1J
P-Pt shown; spinning sidebands are denoted with asterisks. (b) Static 1H-195Pt CP/CPMG NMR spectrum of 1 (bottom trace). The slightly rolling baseline in (b) is an artifact of the co-addition of the
sub-spectra. . . 169
4.2 (a)31P CP/MAS NMR spectrum of 2, with 1J
P-Pt shown; spinning sidebands are denoted with asterisks. (b) Static 195Pt CP/CPMG NMR spectrum of 2 (bottom trace), numerical simulation of the CPMG pattern using SIMPSON (middle trace), and
analytical simulation of the corresponding static pattern using WSOLIDS (top trace) . 174
4.3 (a)195Pt MAS (ν
rot = 15.5 kHz) NMR spectrum of (cod)PtI2 (bottom trace) and simulation (top trace, using experimental parameters extracted via Herzfeld-Berger analysis). (b)195Pt MAS (ν
rot = 15.5 kHz) NMR spectrum of (cod)PtCl2 (bottom trace) and numerical simulation (top trace, using SIMPSON). In each case, the isotropic peak is denoted with an asterisk. . . 175
4.4 (a)31P CP/MAS NMR spectrum of 3; spinning sidebands are denoted with asterisks. (b) Static 1H-195Pt CP/CPMG NMR spectrum of 3 (bottom trace), numerical SIMPSON simulation (middle trace), and analytical WSOLIDS simulation (top trace). . . 176
4.6 195Pt WURST-CPMG spectra of: a) K
2PtCN4•xH2O, (b) PtCN2•xH2O,
(c) Pt(bpy)CN2, (d) Pt(bpy)CN2•H2O . . . 190
4.7 195Pt WURST-CPMG spectra and simulations of (a) Pt(bpy)CN
2 and (b)
Pt(bpy)CN2•H2O. Inset left: δ11 region of the powder patterns . . . 192
4.8 195Pt MAS NMR spectra of: (a) K
2PtCN4•xH2O, (b) Pt(bpy)CN2, and (c)
Pt(bpy)CN2•H2O. Isotropic chemical shifts are marked with an asterisk (*). . . 194
Chapter 5: Multinuclear Solid-State NMR of (H3O)Y3F10•xH2O Nanoparticles
5.1 TEM images of octahedrally-shaped (H3O)Y3F10 • xH2O nanoparticles. (a) 67 nm nanoparticles, demonstrating octahedral crystallinity of individual nanoparticles (red octahedron edges used for size measurements). (b) 37 nm nanoparticles, exhibiting limited long-range order within the nanoparticle sample. . . 214
5.2 pXRD patterns collected for bulk YF3 (space group Pnma) and (H3O)Y3F10 • xH2O nanoparticles, (space group Fd-3m), with nanoparticle diameters listed in nm. A
simulated pXRD pattern for bulk YF3 is displayed at the bottom. . . 219
5.3 Rietveld profile for the 67 nm diameter (H3O)Y3F10 • xH2O nanoparticles using the space group Fd-3m. . . 220
5.4 Schematic representation of the (H3O)Y3F10·xH2O diamond-like structure where (a) represents the YF8 coordination polyhedra, (b) represents the [Y6F32]14!UOA
octahedral-like building units, (c) and (d) represent the cage like structure exhibited by the nanoparticles. Fluorine ions are denoted by blue spheres and the yttrium polyhedra are denoted in grey. In (c) the red spheres denote the oxygen ions associated with the H3O+ moiety and in (d) the purple spheres indicate the void spaces. The positions of the water molecules within the cages are not shown. . . . 224
5.5 1H MAS spectra of 67 nm (H
3O)Y3F10 • xH2O nanoparticles at a spinning speed of 25 kHz. The red trace corresponds to a fully hydrated (x = 1) sample, and the blue trace corresponds to a partially hydrated (x < 1) sample. Inset left: (H3O)Y3F10 • xH2O crystal structure. . . 225
xxv
5.7 19F MAS NMR spectra of (a) bulk YF
3 and hydrated (H3O)Y3F10 • xH2O nanoparticles of size (b) 132 nm, (c) 67 nm, (d) 49 nm, (e) 37 nm, and (f) 21 nm. Spectra recorded at a spinning speed of 25 kHz. F1 and F2 in (a) denote isotropic chemical shifts in bulk YF3, A, B, and C for (b)-(f) denote isotropic chemical shifts in (H3O)Y3F10 • xH2O, while asterisks (*) denote spinning sidebands. . . 229
5.8 19F MAS NMR spectra for 67 nm (H
3O)Y3F10 • xH2O nanoparticles (a) as received (hydrated), (b) after prolonged air exposure (hydrated), (c) after 12 hours of heating at 120EC (partially hydrated). Spectra were recorded at a spinning speed of 25 kHz. Peak labels indicate resonance assignment and integration ratios (including spinning
sidebands). Asterisks (*) denote spinning sidebands. . . 232
5.9 Deconvoluted 19F MAS NMR spectra of hydrated 37 nm (H
3O)Y3F10 • xH2O nanoparticles. Spinning sidebands are labeled according to the corresponding isotropic peak. Spectra were recorded at a spinning speed of 25 kHz. . . . 236
5.10 Change in δiso of resonance A correlated with nanoparticle size in 19F MAS NMR spectra of hydrated (H3O)Y3F10 • xH2O nanoparticles of size (b) 132 nm, (c) 67 nm, (d) 49 nm, (e) 37 nm, and (f) 21 nm. Bulk YF3 is shown in (a) for comparison.
Spectra recorded at a spinning speed of 25 kHz. A, B, and C denote isotropic chemical shifts in hydrated (H3O)Y3F10 • xH2O. . . 237
5.11 19F-89Y VACP/MAS NMR spectra of bulk YF
3 (a) and hydrated
(H3O)Y3F10 • xH2O nanoparticles of size (b) 132 nm, (c) 67 nm, (d) 49 nm, (e) 37 nm, and (f) 21 nm. Spectra recorded at a spinning speed of 5 kHz. Inset left: The dashed grey line indicates traces of bulk YF3 exist as various degrees of impurity in the
(H3O)Y3F10 • xH2O nanoparticle samples. . . 240 5.12 The graph depicts the relationship between the ratio of the integrated areas of W
and X peaks and (H3O)Y3F10 • xH2O NP size in 19F-89Y VACP/MAS spectra of hydrated samples. Blue data points represent experimental ratios, red data points represent surface area/volume ratios of ideal octahedra (see Table 5.6). The green outlier
represents the 49 nm Sc-doped (H3O)Y3F10 • xH2O nanoparticles. . . 241
5.13 19F-89Y VACP/MAS NMR spectra of 83 nm (H
3O)Y3F10 • xH2O nanoparticles, where (a) is a fully hydrated sample, and (b) is only partially hydrated. Spectra were recorded at a spinning speed of 5 kHz. . . 244
5.14 Static 19F-89Y VACP NMR spectra of (a) bulk YF
3 and hydrated (H3O)Y3F10 • xH2O nanoparticles of size (b) 132 nm, (c) 67 nm, (d) 49 nm,
5.15 Static 19F-89Y VACP NMR spectra and simulation of (a) bulk YF 3 and
(b) hydrated (H3O)Y3F10 • xH2O 37 nm nanoparticles. See Table 5.7. . . . 247 5.16 Overlaid static 19F-89Y VACP NMR spectra of fully (black) and partially (orange) hydrated 83 nm (H3O)Y3F10 • xH2O nanoparticles are shown in (a). Simulations of spectra of the fully ((b), inset left), and partiallly ((c), inset right) hydrated NPs are
also shown. See Table 5.7. . . 248
Chapter 6: Solid-State 65Cu and 31P NMR Spectroscopy of Bis(triphenylphosphine)
Copper Species
6.1 Static 65Cu QCPMG NMR spectra (bottom traces) and simulations (top traces) of (a) [(PPh3)2CuO2CCH3], (b) [(PPh3)2CuO2CCH2F], (c) [(PPh3)2CuO2CCHF2], and (d) [(PPh3)2CuO2CCF3]. The asterisk (*) denotes background signal arising from
residual copper metal. . . 271
6.2 Static 65Cu QCPMG NMR spectra (bottom traces) and simulations (top traces) of (a) [(PPh3)2CuO2N], (b) [(PPh3)2CuO2NO], (c) [(PPh3)2CuO2CH], and
(d) [(PPh3)2CuO2CPh]. The asterisk (*) denotes background signal arising from
residual copper metal. . . 274
6.3 Static 65Cu WURST-QCPMG NMR spectra (bottom traces), QCPMG (middle traces), and simulations (top traces) of (a) [(PPh3)2CuO2N] and (b) [(PPh3)2CuO2CPh]. The asterisk (*) denotes background signal arising from residual copper metal. . . 277
6.4 Static 65Cu WURST-QCPMG NMR spectra (bottom traces), QCPMG (middle traces), and simulations (top traces) of (a) [(PPh3)2CuO2CCH3] and
(b) [(PPh3)2CuO2CCH2F]. The asterisk (*) denotes background signal arising from
residual copper metal. . . 278
6.5 1H-31P CP/MAS NMR spectra (bottom traces) and simulations (top traces) of (a) [(PPh3)2CuO2CCH3], (b) [(PPh3)2CuO2CCH2F], (c) [(PPh3)2CuO2CCHF2], and
(d) [(PPh3)2CuO2CCF3] . . . 282
6.6 1H-31P CP/MAS NMR spectra (bottom traces) and simulations (top traces) of (a) [(PPh3)2CuO2N], (b) [(PPh3)2CuO2NO], (c) [(PPh3)2CuO2CH], and
(d) [(PPh3)2CuO2CPh] . . . 283
xxvii
6.8 Calculated EFG tensor orientation of [(PPh3)2CuBH4] (left) and [(PPh3)2CuO2NO] (right) using the RHF method and 6-311G** basis set. V33 in both cases is oriented
perpendicular to the page. Phenyl protons are omitted for clarity . . . 288
6.9 65Cu simulations of [(PPh
List of Schemes
Chapter 2: Multinuclear Solid-State NMR of Square-Planar Platinum Complexes: Cisplatin and Related Systems
2.1 Structures of compounds studied . . . 57
Chapter 3: Solid-State NMR of Magnus' Green and Pink Salts
3.1 Schematic representation of (a) K2PtCl4, (b) Pt(NH3)4Cl2•H2O, (c) Magnus’ Green Salt ([Pt(NH3)4][PtCl4]) and (d) Magnus’ Pink Salt ([Pt(NH3)4][PtCl4]). Depictions are based on experimentally-determined crystal structures, except for Magnus’ Pink Salt, which has been postulated to adopt the shown arrangement, but has no reported crystal structure to date. . . 105
Chapter 4: Applications of 195Pt SSNMR
4.1 The series of compounds studied via 31P and 195Pt SSNMR. Compounds are based on the hexadentate ligands cis,cis- C6H9(N=CHC6H4(PPh2))3 and
cis,cis-C6H9(NHCH2C6H4(PPh2))3, and numbered for in-text reference. . . . 167
4.2 The compounds under study, from left: (a) K2PtCN4•xH2O, (b) PtCN2•xH2O,
(c) Pt(bpy)CN2, (d) Pt(bpy)CN2•H2O. . . 188
Chapter 6: Solid-State 65Cu and 31P NMR Spectroscopy of Bis(triphenylphosphine)
Copper Species
6.1 Structures of compounds. (a) [(PPh3)2CuO2CCH3], (b) [(PPh3)2CuO2CCH2F], (c) [(PPh3)2CuO2CCHF2], (d) [(PPh3)2CuO2CCF3], (e) [(PPh3)2CuO2N],
(f) [(PPh3)2CuO2NO], (g) [(PPh3)2CuO2CH], (h) [PPh3)2CuO2CPh],
(i) [(PPh3)2CuBH4]. Phenyl protons are omitted for clarity . . . 264
6.2 Bidentate (left) and monodentate (right) coordination of oxyanion ligand to the
xxix
List of Abbreviations
AO Atomic orbital
ADF Amsterdam Density Functional (DFT software package)
(bpy) (bis)pyridine ligand
(bipy) 2,2' - bipyridine
B3LYP Becke's three parameter exchange functional with the
correlation function of Lee, Yang, and Parr
BRAIN BRoadband Adiabatic INversion
BRAIN-CP BRoadband Adiabatic INversion for Cross-Polarization
BRAIN-CP/WCPMG BRAIN-CP with WURST-CPMG
CP Cross-polarization
CP/MAS Cross-polarization magic angle spinning
CPMG Carr-Purcell Meiboom-Gill
CS Chemical shift
CSA Chemical shift anisotropy
CT Central transition
DFT Density functional theory
DNA Deoxyribonucleic acid
DZP Double-ζ polarized
EA Elemental analysis
EFG Electric field gradient
EPR Electron paramagnetic resonance
FID Free induction decay
FOQI First-order quadrupolar interaction
FT Fourier transformation
G03 Gaussian 03 software
GGA Generalized gradient approximation
GIAO Gauge-including atomic orbitals
GIPAW Gauge-including projector augmented wave algorithm
GSAS General Structure Analysis System
HB Herzfeld-Berger
HBA Herzfeld-Berger Analysis
HE Hahn-echo
HF Hartree Fock
IR Infrared (spectroscopy)
MAS Magic angle spinning
MGS Magnus' Green Salt
MPS Magnus' Pink Salt
MO Molecular orbital
MS Magnetic shielding
n.a. Natural abundance
NBO Natural bond order
xxxi
NMR Nuclear magnetic resonance
NP Nanoparticle
NQM Nuclear quadrupole moment
NQR Nuclear quadrupole resonance
NS Nuclear shielding
o.d. Outer diameter
PAS Principal axis system
PBE Perdew, Burke, and Ernzerhof
ppm Parts per million
PW Plane-wave
pXRD Powder X-ray diffraction
QCPMG Quadrupolar Carr-Purcell Meiboom-Gill
QZ4P Quadrupule-ζ quadruple-polarized functional
QI Quadrupolar interaction
RDC Residual dipolar coupling
rf Radiofrequency
RHF Restricted Hartree-Fock
rPBE Revised Perdew, Burke, and Ernzerhof
SCF Self-consistent field
S/N Signal-to-noise ratio
SOQI Second-order quadrupolar interaction
SSNMR Solid-state nuclear magnetic resonance
ST Satellite transition
TEM Transmission electron microscopy
TGA Thermal gravimetric analysis
TMS Tetramethylsilane
TPPM Two-pulse phase-modulation
TZP Triple-ζ singly-polarized functional
TZ2P Triple-ζ double-polarized functional
UHF Unrestricted Hartree-Fock
UOA Octahedral unit of antiprisms
UV-Vis Ultraviolet to visible light spectroscopy
UW Ultra-wideline
UWNMR Ultra-wideline nuclear magnetic resonance
VACP Variable-amplitude cross-polarization
VACP/MAS Variable-amplitude cross-polarization magic angle spinning
VOCS Variable offset cumulative spectra
WURST Wideband Uniform Rate Smooth Truncation
XRD X-ray diffraction
xxxiii
List of Symbols
α Spin-up state
β Spin-down state
B0 Static external magnetic field
B1 Applied oscillating magnetic field
Bind Induced magnetic field
CQ Quadrupolar coupling constant of the EFG tensor
d Residual dipolar coupling constant
σ Chemical shielding/magnetic shielding
δ Chemical shift
Δσ Chemical/magnetic shielding anisotropy
Δδ Chemical shift anisotropy
σ11, σ22, σ33 Principal components of the magnetic shielding tensor
δ11, δ22, δ33 Principal components of the chemical shift tensor
δiso Isotropic chemical shift
σiso Isotropic chemical shielding
σ Chemical/magnetic shielding tensor
e Elementary charge
γ Gyromagnetic ratio
µ Nuclear spin magnetic moment
µ0 Vacuum permeability constant
h Planck constant,
ћ Planck constant / 2π
RDD Dipolar coupling constant
Reff Effective dipole-dipole coupling
κ Skew of the chemical shift/magnetic shielding tensor
Ω Span of the chemical shift/magnetic shielding tensor
I Nuclear spin angular momentum
I Nuclear spin number
J Indirect spin-spin coupling constant
ΔJ Anisotropy of the indirect spin-spin coupling
M0 Net nuclear spin magnetization
Nα Spin population of the α state
Nβ Spin population of the β state
θp Tip angle
rAB Internuclear distance between atoms A and B
T1 Longitudinal relaxation time constant
T2 Transverse relaxation time constant
T2* Effective transverse relaxation time constant
τp Pulse width
τa Acquisition time
υ0 Larmor frequency
xxxv
ω0 Larmor frequency
ω1 Oscillation frequency of applied field
ωrf Oscillation frequency of rf pulse
V EFG tensor
µ ' γћI (1)
γ ' e
2mg (2)
Chapter 1 - Introduction to Nuclear Magnetic Resonance
1.1 - Phenomenon of Nuclear Magnetic Resonance
A majority of the isotopes in the periodic table have a nuclear spin. Generally, in
order to possess nuclear spin, a nucleus must be composed of an odd number of either
protons or neutrons. Nuclear spin arises from the intrinsic non-zero spin angular momentum
of the nucleus and is associated with a nuclear spin quantum number, I. A direct consequence of nuclear spin is the nuclear spin magnetic moment (µ), which is formulated
as the product of the vector representation of the total nuclear spin angular momentum (I)
with the gyromagnetic ratio of the nucleus (γ):
where ћ is Planck's constant (h) divided by 2π. The gyromagnetic ratio is unique to each nucleus and is related to the charge (e) and mass (m) of a proton, and the nuclear g-factor:
The nuclear g-factor is unique for each nuclear isotope.
A nucleus possessing a spin magnetic moment can interact with magnetic fields
originating from sources related to atomic surroundings (e.g., chemical bonds) or external
environment (e.g., the Earth's magnetic field). NMR spectroscopy relies on a large external
static applied magnetic field (B0). The nuclear spin magnetic moment of an NMR-active
2
ω0 ' &γB0 (3)
ˆ
,NMR ' ,ˆZ % ,ˆrf % ,ˆD % ,ˆQ % ,ˆJ % ,ˆMS (4) γ and the magnitude of B0:
where ω0 is known as the Larmor frequency. The Larmor frequency typically ranges from
1-1000 MHz on conventional NMR spectrometers. The NMR experiment also involves the
application of one or several electrical radiofrequency (rf) pulses which oscillate, or resonate,
at or near the Larmor frequency.
1.2 - Overview of NMR Interactions
The NMR phenomenon is dependent primarily upon the external static magnetic field,
B0, smaller oscillating applied fields (e.g., B1), as well as numerous sample-dependent
perturbations. The total Hamiltonian describing the NMR interaction for diamagnetic
samples can be written as:1-4
where the Hamiltonian subscripts Z, rf, D, Q, J, and MS represent the Zeeman, radio frequency, dipolar coupling, quadrupolar, J-coupling, and magnetic shielding interactions, respectively. The Zeeman and rf interactions can be classified as external interactions, since
they arise from external applied magnetic fields. The remaining interactions are internal
interactions which originate from within the sample. The discussion that follows attempts
to briefly summarize these interactions; the reader is referred to other, more comprehensive,
ˆ
,Z ' &γћIZB0 ' ω0ћIZ (5) 1.3 - Zeeman Interaction
The Zeeman interaction describes the interaction of an NMR-active nucleus with an
external magnetic field B0, normally generated via a superconducting magnet. The Zeeman
interaction can be described in quantum mechanical terms through its Hamiltonian:1,6
Upon the application of B0, the axis of quantization is defined and directed along the +z-axis of the laboratory frame (we are using a right-handed xyz coordinate system). In equation (5),
IZ is the projection of the nuclear spin angular momentum I along the z-axis, in either the same or opposite direction of B0. The magnitude of the energy of the Zeeman interaction is
normally much larger than all of the other NMR interactions; as a result, they are often
treated as perturbations on the Zeeman interaction. This assumption is known as the high
field approximation.
In the absence of B0, all nuclear spin states possess the same amount of energy and
are therefore degenerate. When the nucleus is introduced to B0, the degeneracy of its spin
states is broken and split into (2I + 1) possible energy levels (Figure 1.1). These energy levels correspond to all possible magnetic quantum numbers, mI, for spin I. For simplicity, we will consider a spin-1/2 nucleus with two possible eigenstates: mI = +1/2 (α, spin-up) and
mI = -1/2 (β, spin-down). These states are separated by an energy difference which is directly proportional to the Larmor frequency:1,7
4
Nβ Nα ' e
&ΔE/kT ' eћω0/kT
(7)
Figure 1.1 - The splitting of degenerate energy levels of a spin-1/2 nucleus in an external magnetic field, B0, due to the Zeeman interaction.
NMR experiments are not conducted on a single nucleus; rather, they are performed
upon a sample which contains a large ensemble of nuclear spins. At thermodynamic
equilibrium, the non-degenerate energy levels (i.e., α and β) are not populated in equal
amounts, as described by the Boltzmann distribution of an ensemble of N spins:7,10
where Nβis the population of the higher level energy state, Nα is the population of the lower level energy state, k is the Boltzmann constant, and T is the temperature in Kelvin. The Boltzmann distribution predicts that higher-energy states are less populated than
lower-energy spin states at thermal equilibrium. Classically, this difference between spin
state populations results in the formation of a bulk magnetization vector, M0, which is
directed along B0. Equation (7) demonstrates the fundamental problem associated with NMR
spectroscopy: it is an inherently insensitive spectroscopic technique due to the small energy
differences between the non-degenerate energy levels, which in turn give rise to tiny
ˆ
,rf ' &B1(t) cos[ωrft % φ(t)] j i
γniIxi (8)
may be improved by increasing the population difference between spin states. The use of
large sample sizes, ultra-high magnetic fields, cryogenic temperatures, and specialized
radiofrequency pulses serve to increase the sensitivity of the NMR experiment.
1.4- Radio Frequency Interaction
The NMR experiment involves the use of electrical radiofrequency (rf) pulses at or
near the Larmor frequency of the nucleus of interest. These pulses travel through a solenoidal
coil and generate an oscillating magnetic field (B1) oriented along the axis of the coil, which
is perpendicular to the external field B0. When B1 is of the proper frequency, it can induce
transitions between spin states by interacting with the nuclear spins in the sample. The
Hamiltonian for the radio frequency interaction is:
where ωrf is the transmitter frequency and φ is the phase of the applied rf field. Generally,
NMR experiments require that ωrf.ω0, for reasons detailed below.
In the lab frame, the nuclear spins precess about B0 at the Larmor frequency ω0. If we
enter a reference frame that rotates about the z-axis at a frequency of ωrf, the nuclear spins appear stationary. Subsequently, a net magnetization along the z-axis remains. In this rotating frame, when an on-resonance pulse (i.e., a pulse fulfilling the condition ωrf.ω0) is
applied, effects of the static B0 are reduced by a factor of ωrf/ω0, and B1 appears as the
6
θp ' τpγB1 ' ω1τp (9)
Figure 1.2 - The magnetic fields present in the rotating frame. The static field is reduced by a factor of ωrf/ω0, so in the case of an on-resonance pulse (ωrf = ω0), only B1
remains.
B0(1-ωrf/ω0) (Figure 1.2).
For a pulse applied along the +y' direction of the rotating frame, the spin magnetization will rotate in the xz plane. Spin magnetization will tip through some angle θp from +z in a counterclockwise direction about +y', as it precesses about the B1 field (Figure 1.3). The angle θp is known as the tip angle, and is described by:
The tip angle is related to ω1, the nutation frequency (ω1 = -γB1), and τp, the length of time that the rf pulse is applied. A 90E pulse is commonly employed in NMR experiments, and
Figure 1.3 - Orientation of bulk magnetization (top) and illustration of spin state populations (bottom) (a) at the instant an on-resonance pulse B1 is applied along the
y-axis, (b) as B1 tips M0 counterclockwise into the xy plane, and (c) in the xy plane (θ = 90E) at the conclusion of 90E pulse B1.
transitions between spin states. The allowed spin transitions are defined by the selection rule
ΔmI = ± 1. In the context of an ensemble of a single type of spin-1/2 nucleus, the 90E NMR pulse applied allows for equalization, or saturation, of the populations between the
low-energy mI = +1/2 (α, spin-up) and high-energy mI = -1/2 (β, spin-down) spin state (Figure 1.3). An rf pulse serves to manipulate unobservable, longitudinal spin polarization
by rotating it into the transverse (i.e., xy) plane, where detection is possible. When the pulse ceases, the only magnetic field present is B0, and precession about the z-axis resumes. If a tip angle of sufficient magnitude is used (i.e., θp = 90E), the free, undisturbed precession of
magnetization in the xy plane induces a weak oscillating electric current in the NMR coil, which is then amplified by a receiver and sent to an ADC for digitization. The induced NMR
8
1.5 - Relaxation Processes
Once the rf pulse is shut off in the NMR experiment, the equalized spin system
population reverts to thermal equilibrium, with populations described by equation (7). This
population transfer occurs as high-energy β spin states transition, or relax, to low-energy α
spin states via exchange of energy with the surroundings. NMR relaxation is usually
described by two separate processes: the relaxation of the bulk magnetization back to thermal
equilibrium along the z-axis, and the loss of coherence of spin magnetization precessing in the xy-plane. The former is known as longitudinal, or T1, relaxation; the latter is transverse, or T2, relaxation.
T1 relaxation determines the pulse delay, or how long one must wait before the system reaches thermal equilibrium (i.e., often, recycle delays of 5×T1 are employed). T2 relaxation manifests itself as the exponential decay in signal of the obtained FID with time (Figure 1.4).
In practice, an effective T2 relaxation time (T2*) is normally observed in the FID. In solid-state NMR, T2* arises from inhomogeneous line broadening of broad anisotropic patterns, owing to sources such as chemical shift anisotropy or the quadrupolar interaction
Figure 1.4 -T1 relaxation is depicted in (a) and T2 relaxation is shown in (b). M0 denotes the net spin magnetization vector, MZ is the
z-component of M0.
ω0 ' &γ(B0 % Bind) (10)
1.6 - Magnetic Shielding/Chemical Shift Interaction
An external magnetic field, B0, can induce the circulation of electrons in
molecular/atomic orbitals, which in turn can produce relatively weak, local induced magnetic
fields (Bind). With respect to B0, these induced fields contribute to slightly shield (BindïB0)
or deshield (Bind 2 B0) nuclei, leading to small deviations in Larmor frequency. This
interaction is known as nuclear magnetic shielding (MS). Equation (3) can be modified as:
The specific sign and magnitude of shielding associated with Bind is dependent on the
10 ˆ
,CS ' γћIZσ¨B0 (11)
¨
σ '
σxx σxy σxz
σyx σyy σyz
σzx σzy σzz
(12)
¨
σ '
σ11 0 0
0 σ22 0
0 0 σ33
(13)
The Hamiltonian for MS is:3
where is the magnetic shielding tensor. The MS tensor is a second-rank tensor describedσ¨
by a 3×3 matrix.
The MS tensor is asymmetric (i.e., σij…σji ),but can be expressed as a sum of a symmetric and
antisymmetric tensors. Both the asymmetric and symmetric portions of the MS tensor
contribute to nuclear spin relaxation, however, only the symmetric component of the MS
tensor makes observable contributions to NMR spectra.11 The symmetric portion of the MS
tensor has a non-zero trace and is normally expressed in its own principal axis system (PAS)
as:
Along the diagonal are the three principal components of the MS tensor: σ11, σ22, and σ33.
These components describe the degree of magnetic shielding, and are defined such that
σ11#σ22#σ33. The three components are orthogonal to one another and represent magnetic
Figure 1.5 - Visual representation of the magnetic shielding tensor. An ellipsoid is used as a pictorial aid.
ˆ
,MS(θ,φ) ' γB0(σ11sin2θ cos2φ % σ
22sin2θ sin2φ % σ33cos2θ) IZ (14)
For any orientation of the MS tensor with respect to B0, the magnetic shielding is
given by:
In the above equation, θ and φ are polar angles which define the orientation of B0 in the PAS
of the MS tensor. θ represents the tip angle and φ is the azimuthal angle. Magnetic shielding
strongly depends on the orientation of the MS tensor, and by extension, the orientation of the
molecules themselves, with respect to B0. The MS tensor is said to be anisotropic (i.e.,
directionally dependent). In a powder sample, all possible crystallite orientations with respect
to B0 exist; hence, every possible combination of θ and φ will be present. Therefore, each
crystallite will possess a slightly different resonant frequency according to equation (14). This
anisotropy may give rise to broad powder patterns.
12
Figure 1.6 - Averaging of the CSA demonstrated via a comparison of simulated (a) solid-state and (b) solution-state NMR spectra for a spin-1/2 nucleus. Intensity of solid-state spectrum enhanced by ca. 10 x for clarity.
of 10-12 s-1, which rapidly reorients the MS tensor through all possible orientations of θ and
φ on the NMR timescale. The result is a sharp resonance, which represents an averaged value
of the anisotropic MS interaction (Figure 1.6).
The averaging of the anisotropic MS interaction provides a very sharp peak of high
S/N, which in most cases, can be easily resolved from neighbouring peaks. By contrast,
anisotropic powder patterns feature dispersed integrated signal intensity, resulting in lower
S/N and severe overlap with neighbouring patterns. Nonetheless, these anisotropic patterns
are rich in information concerning local structure, bonding, and electronic environment. In
solution or gas phase, the isotropic magnetic shielding (σiso) is observed as the average of all
three individual magnetic shielding components:
σiso ' σ11 % σ22 % σ33