Effect of invasive species removal on the understory of an urban forest
By Patrick Chess
Submitted to the Graduate Faculty of North Carolina State University
in partial fulfillment of the requirements for the Degree of
Master of Natural Resources Ecological Restoration
Raleigh, North Carolina
2011
Approved by advisory committee: Dr. Theodore Shear (Chair)
Dr. Joseph Neal Dr. Christopher Moorman
Abstract
Chess, Patrick. Master of Natural Resources Ecological Restoration. Effect of invasive species removal on the understory of an urban forest
In 2002, a 5-acre section of forest at the North Carolina Museum of Art Park underwent an invasive species removal treatment to prevent ecological damage caused by these invasive species and to aesthetically improve the park. Treatment was targeted
specifically at non-native woody shrubs, especially Elaeagnus umbellata and Ligustrum sinense. This forested area was used as a case study to examine the effects of invasive
species removal on the understory of the forest. When compared to an adjacent nontreated area of forest, the treatment was effective at decreasing the cover of both Elaeagnus umbellata and Ligustrum sinense. The reduction in invasive shrub cover also
increased park sightlines, accomplishing the aesthetic goal. Despite the success of the treatment in removing the target invasive species, eight years later the total cover of invasive species was not different between the two areas. This was largely due to a much higher average cover of Microstegium vimineum in the treated area. Possible
explanations for this difference include competitive release and the introduction of disturbance. There was no observed difference between the understory communities of the nontreated and treated areas. Also, invasive shrub cover was correlated with both canopy cover and proximity to the forest edge. This study shows that successful invasive species removal can lead to further invasion by other species. Furthermore, removal of invasive species may not lead to an increase in native species cover or richness. Finally, this study supports the observation that forest edges and open canopies are often
Acknowledgements
Table of Contents
Introduction………..5
Methods………....6
Site Characteristics………...6
Data Collection………7
Data Analyses………..8
Results………10
Growth Form………..12
Ordination………..13
Canopy Cover………13
Edge Effect……….14
Discussion………..15
Treatment Success……….15
Effects on the Vegetative Community………..16
Canopy and Edge………..19
Conclusions………20
Tables and Figures……….22
Table 1: Comparison of cover values between years……….22
Table 2: Average percent cover per plot of native species………22
Table 3: Average percent cover per plot of exotic species………22
Table 4: Average percent cover per plot of vegetative growth forms…………...23
Table 5: Correlations between canopy cover and species……….23
Table 6: Average percent cover per plot in edge plots………..23
Figure 1: NMS of 2010 community data………...24
Figure 2: Relationship between canopy cover and photon irradiance…………...25
Introduction
Invasive species removal is often used in ecological restoration. It is frequently assumed that the eradication of an exotic species will lead to the recovery of the natural community. However, few studies examine the vegetative community after eradication and there is little consensus among those that have. Treatment method and timing can have a profound impact on the community response (Flory and Clay, 2009). Invasive species removal has been reported to either increase or have no effect on native species richness (DeMeester and Richter, 2010; Swab et al., 2008; Stinson et al., 2007). In some cases, the removal of one exotic species promoted the invasion of a second species. For example, the removal of dame’s rocket (Hesperis matronalis) has resulted in the
proliferation of multiflora rose (Rosa multiflora) and burning bush (Euonymus alatus) (Pavlovic et al., 2009). Similarly, the control of an invasive fennel (Foeniculum vulgare) resulted in the proliferation of a suite of exotic Mediterranean grasses (Ogden and
Rejmanek, 2005).
The lack of consensus among the aforementioned studies makes case studies an important tool for discovering the effect of invasive species removal on the resulting vegetative community. Invasive species removal at the North Carolina Museum of Art (NCMA) properties offers an opportunity for such a case study. The NCMA owns a 160 acre Museum Park that is composed of a forest and prairie. The forest is heavily invaded with exotic shrubs, the two most common species being Elaeagnus umbellata (autumn olive) and Ligustrum sinense (Chinese privet).
visibility in the forest and the NCMA was concerned with the visitor experience. Works of art are placed in the forests along a trail system and the thick invasive shrub layer reduced visitor sightlines from the paths and obstructed views of these sculptures.
Invasive species impact the environment in many ways and have been linked to changes in decomposition rates, soil characteristics, forest structure and nutrient cycling (Blair and Stowasser, 2009; Weidenhamer and Callaway, 2010; Asner et al., 2008; Scharfy et al., 2009). Exotic species invasion is also commonly assumed to be one of the leading causes of biodiversity loss (Pavlovic et al., 2009). For example, Ligustrum sinense invasion has been found to reduce the growth and survival of native herbaceous
species (Greene and Blossey, 2011).
In 2011, the NCMA began considering invasive plant removal in other sections of the forest. This expansion would be implemented with the goals of the initial treatment in mind. The previous restoration effort was examined to help answer the following questions to determine (1) if the treatment was successful in accomplishing its goals; and (2) what effects invasive shrub species removal had on the understory community?
Methods
Site Characteristics
A 5-acre section of forest was selected for invasive species removal in late September of 2002. Treatment was conducted through the application of a tank mixture of 1% triclopyr and 1.5% glyphosate. Treatment was targeted specifically at non-native woody invasive species, especially Elaeagnus umbellata and Ligustrum sinense, by trained professionals using back-pack sprayers. All treatments were foliar applications with care to avoid non-target species.
A 9.5-acre section of adjacent forest was chosen to serve as an approximation of a non-treated area for comparison. Both areas are bordered by the Reedy Creek Greenway along their western edges and are located on a north facing slope. Slopes range from 0-45% in the nontreated area and from 0-20% in the treated area. Soils in the nontreated area are Worsham sandy loams, Pacolet sandy loams and Cecil sandy loams. In the treated area the soils are Worsham sandy loams, Pacolet clay loams and Cecil clay loams. (Soil Survey Staff, NRCS, 2011).
Data Collection
15-meters forests retain characteristics of the interior and lose any edge effect (Yates et al., 2003). All plot locations were marked by the placement of a single pin flag.
Plots were created by placing a 2x2m PVC pipe frame at each location. The initial pin flag was used as the northwest corner and the plots were aligned in a north-south direction. A second pin flag was placed in the north-southwest corner for re-sampling purposes in the second year.
Data were collected from July to September of 2010. At each plot, the absolute percent cover of each species present in the plot was estimated. Species were identified according to the nomenclature provided by Radford et al. (1968). Cover values were estimated to the nearest percent below fifteen percent. Values over fifteen percent were estimated in five percent intervals. Overhanging vegetation (vegetation not rooted in the plot) was included in this measurement. Additionally, a visual estimation of the canopy cover at each plot location was recorded by the same observer. Canopy cover was defined as the relative percent cover of all trees above three meters in height. Re-sampling occurred in May of 2011 to determine if any species were missed in the prior sample due to the sampling period occurring very close to the end of the growing season.
Photon irradiance was measured during July of 2011. Data were collected using a LI-COR model LI-1400 Data Logger. This was attached to a LI-COR model Quantum light sensor. Three measurements of irradiance were taken across each plot. These measurements were used to find the average irradiance of each plot to account for the effects of sunflecks.
Analyses of community data were performed in PC-ORD version 5.32 (McCune and Mefford, 2006). Ordination was used to determine if the treated and nontreated plots were a part of the same community. Three dimensional non-metric multidimensional scaling (NMS) was performed on both the 2010 and 2011 data.
Multi-response permutation procedures (MRPP) were then used to test for
differences in community composition between the treatments. MRPP were also used to compare the edge plots with the interior plots. MRPP results in the derivation of a test statistic (t) that “is the difference between the observed and expected deltas divided by the square root of the variance in delta” and “describes the separation between the groups” (McCune and Mefford, 2006). It also generates a statistic that describes the within-group homogeneity (A). This value equals one when there is no variation among members of a single group. It equals zero when “heterogeneity within groups equals expectation by chance” and can be negative if there is more heterogeneity within groups than predicted by chance (McCune and Mefford, 2006). Statistical significance can occur even when dealing with a low A statistic due to a large enough sample size. Therefore, one must “carefully consider the ecological significance of the result, not just the statistical significance” (McCune and Mefford, 2006). Significance for this, and all following tests, was determined as having a p-value of 0.05 or less.
to determine statistical significance compared to the frequency and abundance expected by chance alone.
Correlation between canopy cover and average vegetative cover per plot was performed in Microsoft Excel (Microsoft Corporation, 2003) using a linear regression approach. Additional correlations were performed between canopy cover and the average cover per plot of individual species as well as with photon irradiance. The relationship between canopy cover and photon irradiance was also examined.
Data taken in 2010 was compared to the 2011 data using paired t-tests in Microsoft Excel (Microsoft Corporation, 2003). T-tests were also used to compare values that used plots as the sample. This includes comparisons of average light levels and canopy cover. T-tests could not be performed to test the difference between
treatments because there was a sample size of one. Equivalence of variance was assumed and all tests were conducted with two tails.
Average cover per plot was also examined by grouping the species into growth forms. These growth forms included trees, shrubs, graminoids, vines and forbs. Growth form selection followed the growth habit designation in the United States Department of Agriculture PLANTS Database (NRCS, 2011). The PLANTS Database was also used to determine the status of each species as exotic or native to the state of North Carolina.
Results
combined for an average cover per plot of 0.02 percent. In 2011, three new species were measured that combined for an average cover per plot of 0.46 percent. These values are negligible when compared to the average total cover per plot in 2010 (37%) and 2011 (39%). There was no significant difference in total cover between years (t110 = 0.81, p =
0.42).
Examination of the cover by treatment yielded many significant differences between the two years (Table 1). The cover of treated plots was lower in 2011 than in 2010 (t39 = -2.48, p = 0.02) while the cover in the nontreated plots was higher (t70 = 3.46,
p = 0.001). The cover of native species in the treated plots remained the same between the two years but was greater in the untreated plots in 2011 than 2010 (t70 = -3.76, p <
0.001). The cover of exotic species was greater in 2010 than 2011 in the treated plots (t39
= 2.74, p = 0.009) but was the same between years in the untreated plots.
An indicator species analysis was run for both the 2010 and 2011 data. The 2010 data contained three significant indicators of the nontreated plots and seventeen
indicators of the treated plots. The nontreated plots were indicated by Elaeagnus umbellata, Lonicera japonica (Japanese honeysuckle) and Carya tomentosa (mockernut
hickory). The indicators of the treated plots that contained higher than 0.4% cover per plot were Hedera helix (English ivy), Microstegium vimineum (Nepalese
2010 list. The indicator species with large amounts of cover were chosen for further examination in order to discover any differences that might exist between the two treatments.
The differences in cover between treatments of four native indicator species were about 9% in 2010 and 7% in 2011 (Table 2). This corresponds to the total differences in all native cover observed between treatments. It is also apparent that even though the total average cover of exotic species remained constant between treatments in 2010, the composition of that cover did not. There was much less cover in the nontreated plots than the treated plots of Elaeagnus umbellata, Ligustrum sinense, and Lonicera japonica (Table 3). This difference in exotic woody cover was also observed in 2011. However, in 2010, the average cover of Microstegium vimineum in the treated plots was much greater than in the nontreated plots. This difference in cover of Microstegium vimineum was not observed in May 2011 because of Microstegium’s life cycle. This species continues to grow throughout the growing season and can flower as late as September (Mehrhoff, 2000; Gibson et al., 2002).
Due to the similarity between the 2010 and 2011 data, further analyses were only performed on the 2010 data.
Growth Form
quinquefolia, Toxicodendron radicans, and Vitis rotundifolia). Shrub cover, especially
Elaeagnus umbellata and Ligustrum sinense, was higher in the nontreated area than the
treated area.
Ordination
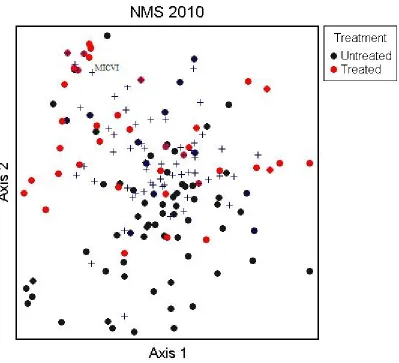
Three dimensional NMS ordination revealed no clear separation between the treated and nontreated plots in either 2010 (Fig. 1). The results of the MRPP when grouped by treatment also showed there to be no difference in community between the nontreated and treated areas. The low A values derived (t = -10.21, A = 0.0399, p <0.0001) suggest that there is a strong likelihood that the homogeneity observed within the groups is due to chance. The significance of the test was likely a result of the large sample size, rather than any true separation of the data.
Canopy Cover
There was more canopy cover in the treated area (60%) than the nontreated area (51%) (t109 = -2.98, p = 0.004). Canopy cover was correlated to total understory cover (F1,
109 = 25.05, p<0.001). While the relationship was significant, it was not that strong
(r=0.43). This correlation was observed in both the treated area (F1, 38 = 10.47, p=0.003)
and nontreated areas (F1, 69 = 28.92, p<0.001).
The data were then examined for relationships between canopy cover and growth form. Shrubs were the only growth form to be significantly correlated to canopy cover (F1, 109 = 67.48, p<0.0001). This relationship was then examined by treatment. While
p<0.001) they were not correlated in the treated area (F1, 38 = 1.85, p=0.182). Individual
species were then examined to discover if the difference in canopy could be the reason for any difference in cover (Table 5). The exotic shrubs Elaeagnus umbellata and Ligustrum sinense were significantly correlated to canopy cover. This corresponded to
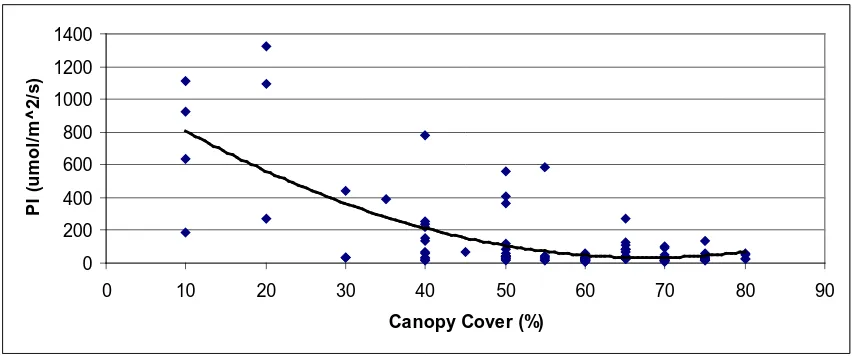
the relationship observed with the shrub growth form. However, none of the other species tested, except Lonicera japonica, were significantly correlated to canopy cover. Canopy cover was also correlated to photon irradiance (F1, 109 = 71.62, p<0.0001). This
correlation was observed in both the treated (F1, 38 = 6.40, p=0.016) and nontreated
areas(F1, 69 = 28.03, p<0.001). The regression that best described the relationship
between light and canopy cover was a second order polynomial (R2 = 0.51) (Fig. 2). Additionally, photon irradiance was correlated to total shrub cover (F1, 109 = 91.13,
p<0.0001) and to the shrub cover in the nontreated area (F1, 69 = 81.54, p<0.001). Photon
irradiance was not correlated to the shrub cover in the treated area (F1, 38 = 0.82,
p=0.371). There were also strong correlations between photon irradiance and Elaeagnus umbellata (r = 0.60) and Ligustrum sinense (r = 0.48).
Edge Effect
There was greater vegetative cover in edge plots (50%) than interior plots (31%) (t109 = -3.82, p < 0.001). A MRPP grouping of the plots by location found that this
An indicator species analysis found no significant indicators of interior plots in 2010. There were seven indicators of edge plots including Elaeagnus umbellata, Ligustrum sinense, Rosa multiflora (multiflora rose), and Rubus argutus. Analyses of
these four species by average cover value did display this preference for an edge position in the landscape (Table 6). Of these species, Elaeagnus umbellata and Ligustrum sinense had been shown to be correlated to canopy cover and photon irradiance.
The canopy cover in the edge plots (47%) was significantly lower than the interior plots (57%) (t109 = 3.19, p = 0.002). Similarly, the photon irradiance was significantly
lower in the interior plots (51 μmol/m2/s) than the edge plots (286 μmol/m2/s) (t109 =
-5.43, p < 0.001).
Discussion
Treatment Success
The first question posed was whether or not invasive shrub removal successfully achieved the goals established by the NCMA. First, herbicide treatment did reduce cover of woody exotic vegetation. Percent cover of Elaeagnus umbellata and Ligustrum sinense was less in the treated area compared to the nontreated area. However, removal
Second, sightlines in the forest were improved by the removal of Elaeagnus umbellata and Ligustrum sinense. Although the cover of Microstegium vimineum had
increased, this plant is short in stature and does not impede sightlines. Therefore, if success is measured based on the aesthetic of sightline, then the treatment would be deemed successful.
Effects on the Vegetative Community
The native community may not have suffered much from the invasion of exotic shrubs. Native species were still present and regenerating under this shrub layer and the removal of these exotic species had little impact on the native cover. The foliar
application of the herbicide put these non-target species at risk, but the forb and tree cover remained constant between the two areas. The equal cover of these native species suggests that they may not have been adversely impacted by the treatment application or the presence of the invasive shrubs. This explanation is unlikely however, because the cover of native vines was higher in the treated area, indicating some treatment effect.
The native community may have been impacted by the exotic shrub cover, but had not recovered due to the introduction of a new competitor. The effective replacement of Elaeagnus umbellata and Ligustrum sinense cover with Microstegium vimineum cover suggests that the competitive pressure from exotic species may be equal in the two areas. Native vines may have increased their cover in the treated area due to some form of competitive release following the removal of the exotic shrubs.
between native and exotic species is often due to the influence of invader control over resources, rather than propagule pressure (Yurkonis et al., 2005). This places a limit on species establishment but does not result in an increase in species extinction (Yurkonis et al., 2005), which would explain the similar richness and cover values recorded between
the treatments. It is possible that this proposed resource domination by Microstegium is a direct replacement of the control over resources that the invasive shrubs may have
exhibited.
In addition to competitive pressure, it is also possible that the community has not recovered due to the surrounding area being heavily invaded. If the entire forest had suffered a decrease in native species, there may have been no available corridor for new seeds to migrate into the area. This would signify that the area had passed an ecological barrier to restoration and that more intensive methods of restoration must be applied.
The origin of the Microstegium vimineum was unknown. Studies have shown that Microstegium cover decreases dramatically under the cover of midstory trees due to the
decrease in light levels (Cole and Weltzin, 2005). Elaeagnus umbellata has also been demonstrated to produce a large amount of shade in the understory (Brantley and Young, 2010). Therefore, it is possible that the loss of light competition, due to the removal of the invasive shrub layer, resulted in the large increase in Microstegium cover in the treated area.
However, Microstegium was not present in the interior of the nontreated area where the cover of the invasive shrubs was already low. Some studies have shown that Microstegium was absent from many suitable sites and that determining good indicators
the difference in cover between the two areas was the presence of site disturbance. Microstegium invasions often rely upon disturbed soils and vegetation as it is a poor
invader on its own (Barden, 1987; Nord et al., 2010; Rauschert et al., 2010). It is possible that Microstegium was unable to compete with the vegetation present on the nontreated side. It has been demonstrated that Microstegium does not establish
successful populations in extant populations of Lonicera japonica, a significant indicator of the nontreated area (Barden, 1987). In addition to vegetative disturbance,
Microstegium has been associated with soil disturbance (Mortensen et al., 2009; Christen and Matlack, 2009). The soils in the treated area may have been disturbed during the construction of the trail system present in that area. The soil series present in the treated area were the same as in the nontreated area, but they differed in surface texture. It is possible that the surface texture was changed during trail creation or subsequent erosion, providing enough disturbance for Microstegium to invade. Additionally, it is possible that the trail system provided a means for human dispersal of Microstegium seeds into the treated area. Human dispersal is considered the most important catalyst of Microstegium invasion (Mortensen et al., 2009) and Microstegium has been documented as ubiquitous along trails (Cole and Weltzin, 2004; Christen and Matlack, 2009).
Microstegium. Therefore, treatment expansion likely depends on the NCMA’s
preference for the invasive shrubs over the invasive grass.
Canopy and Edge
Invasion processes often occur along forest edges (McDonald and Urban, 2006; Mortensen et al., 2009) as urban forests are often bordered by a system of paved trails or roads. The NCMA forest is bisected by the Reedy Creek Greenway. These kinds of transportation grids act as a network for invasion (Nemec et al., 2011). The long linear paths promote the movement of people and have been theorized to receive greater seed inputs. Additionally, these trails break open the canopy of the forest. Canopy opening is one of the strongest factors influencing invasion (Gurevitch et al., 2008) and may be an influencing factor in the edge effect. It is also possible that these edge areas foster invasions due to soil disturbance caused by the construction of the pathways. Soil bulk density, texture, structure, and pH could all be influenced by the construction of a paved greenway system.
Edge plots were found to have much lower canopy cover and much higher photon irradiance than interior plots. These relationships are very intuitive since the edge plots are bordered by the open canopy over the paths on one side. One obvious effect of canopy was on the average total cover of vegetation. As the canopy cover decreased, the total understory cover increased. However, only three species, all exotic, were found to have significant correlations with canopy cover. Of these three species, Elaeagnus umbellata and Ligustrum sinense were also significant indicators of edge plots. Other
a significant indicator of forest edges in the North Carolina Piedmont (McDonald and Urban, 2006).
Previous research has found Elaeagnus umbellata to exhibit a significant edge effect and an association with site disturbance (Ibáñez et al., 2009). Another survey found both Elaeagnus umbellata and Ligustrum sinense to be associated with edges (Drake et al., 2003). This corroborates the preference of this species for edges in the NCMA Park. One study found Elaeagnus umbellata to have no significant difference in density between edge and interior areas (Yates et al., 2003). However, the density was still higher at the edges. It is possible that Elaeagnus umbellata establishes itself along the edges of forests and then has the ability to invade to the interior. This process may be happening at the NCMA, but the interior population was not yet significant.
Conclusions
Exotic species removal has had several interesting effects on the North Carolina Museum of Art Park forest. The treatment was effective at removing the target species, and they have not regenerated in large abundances in the eight years since treatment. The museum also accomplished one of their primary goals in clearing out the understory shrubs to improve sightlines. This will provide visitors with a better view of the works of art placed along the paths. However, the treatment was not successful at decreasing the total cover of exotic species. Rather the species composition was shifted from a tall shrub layer to a lower-growing layer of graminoids.
paved greenways creates strips of land that can harbor invasive species and should be avoided or reduced in impact. It is also possible that maintaining a closed canopy above the path could reduce the invasibility of these edges. For the NCMA, the edge areas of the forest present a logical location for invasive species removal treatments in the future. These areas contained the largest cover of exotic species and their location near the greenway means that clearing the shrub layer would increase sightlines the most.
Tables and Figures
Table1: Comparison of cover values between years
2010 2011
Cover Treated Nontreated Treated Nontreated
Total 44 33 36* 40*
Native 18 9 19 12*
Exotic 24 24 14* 28
Values presented are the average percent cover of all plant species per plot. Significant differences observed between the two years (p < 0.05) are marked by an asterisk (*) by the 2011 value.
Table 2: Average percent cover per plot of native species
2010 2011
Species Treated Nontreated Treated Nontreated
Toxicodendron radicans 5 1 7 3
Vitis rotundifolia 4 1 3 1
Parthenocissus quinquefolia 2 1 3 2
Acer rubrum 1 trace 1 trace
Total native cover 18 9 19 12
Species listed were significant indicators of treatment and were present in the largest average cover among all indicator species. Trace values are those that are less than one percent. The common trend was a higher cover in the treated area when compared to the nontreated area.
Table 3: Average percent cover per plot of exotic species
2010 2011
Species Treated Nontreated Treated Nontreated
Elaeagnus umbellata 4 13 4 16
Ligustrum sinense 1 4 1 3
Lonicera japonica 1 2 3 5
Microstegium vimineum 17 3 4 trace
Total invasive cover 24 24 14 27
Table 4: Average percent cover per plot of vegetative growth forms Growth Form Treated Nontreated
Graminoid 18 4
Vine 14 5
Shrub 7 18
Tree 3 2
Forb 3 4
Tree and forb cover remained the same between treatments while large differences were observed in shrub, vine and graminoid cover. All values are from 2010 data.
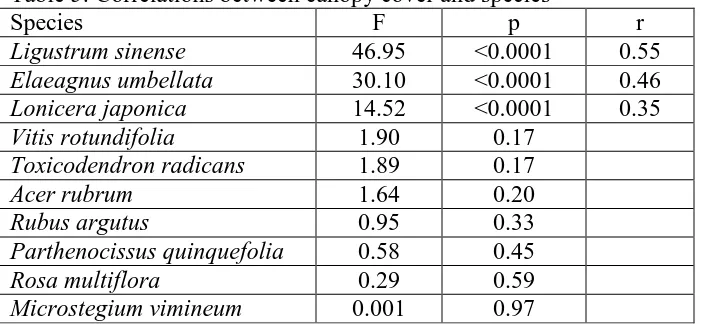
Table 5: Correlations between canopy cover and species
Species F p r
Ligustrum sinense 46.95 <0.0001 0.55 Elaeagnus umbellata 30.10 <0.0001 0.46 Lonicera japonica 14.52 <0.0001 0.35
Vitis rotundifolia 1.90 0.17
Toxicodendron radicans 1.89 0.17
Acer rubrum 1.64 0.20
Rubus argutus 0.95 0.33
Parthenocissus quinquefolia 0.58 0.45
Rosa multiflora 0.29 0.59
Microstegium vimineum 0.001 0.97
Species listed are those that had the largest average cover values among all species. Degrees of freedom of the F statistic are 1 and 109. Significance is determined as p < 0.05. The r values are only given for significant relationships. All values were taken from 2010 data.
Table 6: Average percent cover per plot in edge plots
Species Edge Interior
Elaeagnus umbellata 17 6
Ligustrum sinense 7 1
Rosa multflora 2 trace
Rubus argutus 1 trace
Figure 1: NMS of 2010 community data
Figure 2: Relationship between canopy cover and photon irradiance
0 200 400 600 800 1000 1200 1400
0 10 20 30 40 50 60 70 80 90
Canopy Cover (%)
P
I (
u
m
o
l/m
^
2
/s
)
Canopy cover is related to photon irradiance by the following expression: PI =
Works Cited
Asner, G.P., R.F. Hughes, P.M. Vitousek, D.E. Knapp, T. Kennedy-Bowdoin, J. Boardman, R.E. Martin, M. Eastwood, and R.O. Green. 2008. Invasive plants transform the three-dimensional structure of rain forests. Proceedings of the National Academy of Sciences of the United States of America, 105(11): 4519-4523.
Barden, L.S. 1987. Invasion of Microstegium vimineum (Poaceae), an exotic, annual, shade-tolerant, C4 grass, into a North Carolina floodplain. The American Midland Naturalist, 118: 40-45.
Blair, B.C. and A. Stowasser. 2009. Impact of Lonicera maackii on decomposition rates of native leaf litter in a southwestern Ohio woodland. Ohio Journal of Science, 109(3): 43-47.
Brantley, S.T. and D.R. Young. 2010. Linking light attenuation, sunflecks, and canopy architecture in mesic shrub thickets. Plant Ecology, 206: 225-236.
Christen, D.C. and G.R. Matlack. 2009. The habitat and conduit functions of roads in the spread of three invasive plant species. Biological Invasions, 11: 453-465. Cole, P.G. and J.F. Weltzin. 2004. Environmental correlates of the distribution and
abundance of Microstegium vimineum, in east Tennessee. Southeastern Naturalist, 3(3): 545-562.
---. 2005. Light limitation creates patchy distribution of an invasive grass in eastern deciduous forests. Biological Invasions, 7: 477-488.
DeMeester, J.E. and D.deB. Richter. 2010. Restoring restoration: removal of the invasive plant Microstegium vimineum from a North Carolina Wetland. Biological Invasions, 12: 781-793.
Drake, S.J., J.F. Weltzin and P.D. Parr. 2003. Assessment of non-native invasive plant species on the United States Department of Energy Oak Ridge National
Environmental Research Park. Castanea, 68(1): 15-30.
Flory, S.L. and K. Clay. 2010. Non-native grass invasion suppresses forest succession. Oecologia, 164: 1029-1038.
---. 2009. Invasive plant removal method determines native plant community responses. Journal of Applied Ecology, 46: 434-442.
Greene, B.T. and B. Blossey. 2011. Lost in the weeds: Ligustrum sinense reduces native plant growth and survival. Biological Invasions, published online 13 April 2011. Gurevitch, J., T.G. Howard, I.W. Ashton, E.A. Leger, K.M. Howe, E. Woo, and M.
Lerdau. 2008. Effects of experimental manipulation of light and nutrients on establishment of seedlings of native and invasive woody species in Long Island, NY forests. Biological Invasions, 10:821-831.
Hanula, J.L., S. Horn and J.W. Taylor. 2009. Chinese privet (Ligustrum sinense) removal and its effect on native plant communities of riparian forests. Invasive Plant Science and Management, 2(4): 292-300.
Ibáñez, I., J.A. Silander Jr., J.M. Allen, S.A. Treanor and A. Wilson. 2009. Identifying hotspots for plant invasions and forecasting focal points of further spread. Journal of Applied Ecology, 46: 1219-1228.
McCune, B. and M.J. Mefford. 2006. PC-ORD. Multivariate Analysis of Ecological Data. Version 5.32. MjM Software, Glenedon Beach, Oregon, U.S.A.
McDonald, R.I. and D.L. Urban. 2006. Edge effects on species composition and exotic species abundance in the North Carolina Piedmont. Biological Invasions, 8: 1049-1060.
Mehrhoff, L.J. 2000. Perennial Microstegium vimineum (Poaceae): an apparent misidentification? Journal of the Torrey Botanical Society, 127(3): 251-254. Microsoft Corporation. 2003. Microsoft Office Excel 2003. Microsoft Office Standard
Edition 2003 for Students and Teachers.
Mortensen, D.A., E.S.J. Rauschert, A.N. Nord and B.P. Jones. 2009. Forest roads facilitate the spread of invasive plants. Invasive Plant Science and Management, 2(3): 191-199.
Nemec, K.T., C.R. Allen, A. Alai, G. Clements, A.C. Kessler, T. Kinsell, A. Major, and B.J. Stephen. Woody invasions of urban trails and the changing face of urban forests in the Great Plains, USA. The American Midland Naturalist, 165(2): 241-256.
Nord, A., D.A. Mortensen and E.S.J. Rauschert. 2010. Environmental factors influence early population growth of Japanese stiltgrass (Microstegium vimineum).
Invasive Plant Science and Management, 3(1): 17-25.
Pavlovic, N.B., S.A. Leicht-Young, K.J. Frohnapple, and R. Grundel. 2009. Effect of removal of Hesperis matronalis (dame’s rocket) on species cover of forest
understory vegetation in NW Indiana. The American Midland Naturalist, 161(1): 165-176.
Radford, A.E., H.E. Ahles and C.R. Bell. 1968. Manual of the vascular flora of the Carolinas. Chapel Hill: University of North Carolina Press.
Rauschert, E.S.J., D.A. Mortensen, O.N. Bjørnstad, A.N. Nord and N. Peskin. 2010. Slow spread of the aggressive invader, Microstegium vimineum (Japanese stiltgrass). Biological Invasions, 12: 563-579.
Scharfy, D., H. Eggenschwiler, H. Olde Venterink, P.J. Edwards, and S. Gusewell. 2009. The invasive alien plant species Solidago gigantea alters ecosystem properties across habitats with differing fertility. Journal of Vegetation Science, 20: 1072-1085.
Soil Survey Staff, Natural Resources Conservation Service, United States Department of Agriculture. Web Soil Survey. Available online at
http://websoilsurvey.nrcs.usda.gov/ accessed July 26, 2011.
Stinson, K., S. Kaufman, L. Durbin, and F. Lowenstein. 2007. Impacts of garlic mustard invasion on a forest understory community. Northeastern Naturalist, 14(1): 73-88.
Swab, R.M., L. Zhang, and W.J. Mitsch. 2008. Effect of hydrologic restoration and Lonicera maackii removal on herbaceous understory vegetation in a bottomland hardwood forest. Restoration Ecology, 16(3): 453-463.
USDA, NRCS. 2011. The PLANTS Database (http://plants.usda.gov, 28 June 2011). National Plant Data Team, Greensboro, NC 27401-4901 USA.
Weidenhamer, J.D. and R.M. Callaway. 2010. Direct and indirect effects of invasive plants on soil chemistry and ecosystem function. Journal of Chemical Ecology, 36: 59-69.
Yates, E.D., D.F. Levia Jr. and C.L. Williams. 2003. Recruitment of three non-native invasive plants into a fragmented forest in southern Illinois. Forest Ecology and Management, 190: 119-130.