WANG, LIBING. Experimental Investigation of Spray and Combustion of Gasoline Direct Injection under Different Ambient Conditions. (Under the direction of Dr. Tiegang Fang).
Liquid fuels, with the advantages of high energy density and easy transportability, have
been playing an irreplaceable role in industrial and commercial applications. With the increasing
stringent emission standards and the limited fossil fuel resources, improving spray atomization and
optimizing the combustion process are becoming more and more important for enhancing engine
performance, reducing fuel consumption and pollutant emissions.
Experimental investigation of spray and combustion of gasoline direct injection was carried
out in a constant volume combustion chamber. Different ambient pressures, system temperatures,
ambient gas compositions and spark conditions were used to create a multitude of environments
for the spray and combustion from a hollow cone GDI injector.
Firstly, the flash boiling spray of an outwardly opening hollow cone GDI piezoelectric
injector can cause the cone shaped spray to expand, both in-wards and outwards. The axisymmetric
inward expansion of hollow cone spray would merge together and form a fast developing plume
along the axis of the spray, and the transition point for the plume to appear is around 0.5 for ambient
to saturation pressure ratio (Pa/Ps). When Pa/Ps ratio is over 0.5, the spray penetration is mostly
determined by the initial spray momentum. When Pa/Ps ratio is smaller than 0.5, the flash boiling
and spray plume front becomes dominant factor affecting the spray penetration velocity. Under
same conditions, ethanol has higher superheated degree comparing to isooctane, but much higher
heat of vaporization. Less boiling is observed in ethanol spray, and ethanol penetration is longer.
For multi-component fuels, mixture 50/50 shows a good average data of isooctane and
ethanol. Gasoline, due to its low initial boiling point and wide range of components, has the widest
facilitate flash boiling, fuel vaporization, and mixing.
Compression ignition (CI) and spark assisted compression ignition combustion (SACI)
developments were investigated using PRF95 (high octane fuel) and PRF65 (low octane fuel). The
cumulative heat release (CHR) decreases with the increase of ambient temperatures and decrease
of oxygen levels. The peak heat release rate (HHR) first increases then decreases with the increase
of the ambient temperature, For PRF95, the peak HRR appears at about 750K to 800K, while for
PRF65 it is about 700K to 650K. The peak heat release rate timing always decreases with the
increase of the ambient temperature or oxygen level. Under a low ambient temperature, the oxygen
level plays a major role in affecting the peak heat release rate. Under lower oxygen levels, the
flame becomes darker, the ignition delay becomes longer, and the combustion process takes more
time to complete. Proper spark timing can help advance the peak HRR and shorten ignition delay,
but this effect becomes minor when the temperature increases. The added spark has less effect on
PRF65 than on PRF95.
Under flash boiling spark ignition condition, the flame appears with low luminosity and
cloud-like shape. These cloud-like flame region is where the fuel is distributed well into the whole
volume of the chamber. The peak pressure to initial pressure ratio can be more than 10 times under
0.2 bar absolute ambient pressure. The more weight of added mass and higher peak temperature
are major factors contributing to the very high peak pressure to initial pressure ratio. The flash
boiling spark ignition combustion can lead to better distributed mixtures and less locally fuel rich
spots, resulting in very clean combustion and greatly reduced particulate matter production, which
© Copyright 2019 by Libing Wang
Different Ambient Conditions
by Libing Wang
A dissertation submitted to the Graduate Faculty of North Carolina State University
in partial fulfillment of the requirements for the degree of
Doctor of Philosophy
Mechanical Engineering
Raleigh, North Carolina
2019
APPROVED BY:
_______________________________ _______________________________ Dr. Tiegang Fang Dr. Alexei V.Saveliev
Committee Chair
ii
DEDICATION
To my wife, Jing Li
iii
BIOGRAPHY
Libing Wang was born in Pucheng, Shaanxi, China, a small rural town. His mother is a
teacher, and his father is a doctor. During his childhood, his parents did not put too much pressure
on him to make him study harder and get good grades, but instead tried to make sure he has a
childhood with happy laughs and colorful memories.
In 2007, Libing graduated from Yaoshan middle school at his hometown and went to Xi’an
Jiaotong University for undergraduate study. His major was power engineering and he developed
great interest and enthusiastic in thermal science research and study. He graduated in 2011 and continued his Master study in Xi’an Jiaotong University, until 2014 when he decided to further
pursue higher degree and study overseas.
In 2014, Libing started his PhD study in North Carolina State University under the
supervision of Dr. Tiegang Fang. His research interest mainly lies in spray and combustion of
different fuels (gasoline and diesel) under various ambient conditions. He conducted series of
study with high pressure diesel spray and gasoline spray under low ambient pressure conditions.
During the time at NC State, he developed good problem-solving skills and hands-on experience.
His horizon was also broadened, not only about research and technology, but also about life.
After graduation, Libing will try to start a research and development career in engineering
iv
ACKNOWLEDGMENTS
I have been deeply honored to spend the several years of my PhD life working and
interacting with many wonderful people. First of all, I would like to thank my advisor, Dr. Tiegang
Fang, who has given great amount of support and supervision during my PhD period at North
Carolina State University. He not only shared with me his extensive knowledge and experience on
spray and combustion specifically, but also taught me a lot about research methodology and life
experience. He sets a good example for me and other students to be a good researcher, and more
importantly, a good man. Without his support and encouragement, my PhD research would not be
possible.
I would also like to thank my committee members: Dr. William L. Roberts, Dr. Tarek
Echekki, Dr. Alexei V. Saveliev and Dr. Fanxing Li. I want to thank Dr. Roberts for his advice
on research method and how to better describe the research topic, which are very helpful. Dr.
Alexei Saveliev has helped me several times in the equipment sharing and experimental
suggestions, which is greatly appreciated. Dr. Echekki offered a lot of suggestions about how to
describe the physical model behind the observed data trend, which helps me to dig deeper into the
explanation of my research. Dr. Fanxing Li provided me with a lot of new and different aspects on
how to look at my research and how it is connected to the real word problem. The effort and help
from all committee members are very important to me and greatly appreciated.
During the time in NC State University, I am blessed to be working and interacting with
many wonderful colleagues. I want to thank Dr. Zengyang Wu, who gave me a lot of help and
advice on both conducting experiment on the chamber system and how to proceed with research.
I appreciate the help from Fujun Wang and Kuashik Vinod, who provided me with many different
v Dr. Bo Gao, Aaron McCullough, Subash Sriram, Ashutosh Dharap, Reuven Gomes, Akash,
Abhijit, are all amazing people and I enjoyed the time with you all.
I want to thank my family for their support all the time. Your love provides the endless
vi
TABLE OF CONTENTS
LIST OF TABLES ... viii
LIST OF FIGURES ... ix
1. Introduction ... 1
1.1. Motivation ... 1
1.2. Research objectives ... 3
1.3. Outline ... 4
1.4. Tables and Figures ... 6
2. Flash Boiling Hollow Cone Spray from a GDI Injector under Different Conditions ... 9
2.1. Introduction ... 9
2.2. Setup and diagnostics ... 12
2.3. Results and discussions ... 16
2.3.1. Spray images... 16
2.3.2. Spray penetration development ... 17
2.3.3. Peak penetration velocity... 18
2.3.4. Spray axial penetration length ... 19
2.3.5. Shock wave speed ... 21
2.3.6. Spray plume ratio... 21
2.3.7. Spray shape analysis ... 22
2.4. Summary ... 24
2.5. Tables and figures ... 26
3. Flash Boiling Cone Spray from a GDI Injector with Different Fuels ... 43
3.1. Introduction ... 43
3.2. Setup and diagnostics ... 47
3.3. Results and discussions ... 50
3.3.1. Spray images... 51
3.3.2. Spray penetration development ... 52
3.3.3. Spray images at the same time frame ... 53
3.3.4. Heat of vaporization discussion ... 54
3.3.5. Comparison between different fuels ... 55
3.3.6. Pure substance and multicomponent fuels ... 58
3.4. Summary ... 59
vii
4. Compression Ignition and Spark Assisted Compression Ignition of GDI sprays ... 85
4.1. Introduction ... 85
4.2. Setup and diagnostics ... 88
4.3. PRF95 Results and discussions ... 90
4.3.1. High speed video data... 91
4.3.2. Heat release analysis ... 92
4.3.3. Comparison between different ambient oxygen concentration ... 94
4.3.4. Summary ... 96
4.4. PRF65 Results and discussions ... 97
4.4.1. High speed video data... 98
4.4.2. Heat release analysis ... 99
4.4.3. Summary ... 101
4.5. Tables and figures ... 102
5. Spark Ignition of Direct Injection Flash Boiling Spray ... 147
5.1. Introduction ... 147
5.2. Setup and diagnostics ... 151
5.3. Results and discussion ... 153
5.3.1 High speed video ... 153
5.3.2 Pressure data analysis ... 157
5.4. Summary ... 158
5.5. Tables and figures ... 160
6. Conclusion ... 183
6.1. Conclusions ... 183
6.2. Future work ... 187
viii
LIST OF TABLES
Table 1-1. The evolution of Euro emission standards. ... 6
Table 2-1. All experimental settings and conditions and the vapor pressure value of isooctane. 26 Table 2-2. Parameters for isooctane in the Antoine equation. ... 26
Table 2-3. Ambient-to-saturation pressure ratio (Pa/Ps) of all experimental conditions. ... 61
Table 3-2. Parameters for isooctane and ethanol in Antoine equation. ... 61
Table 3-3. Isooctane ambient-to-saturation pressure ratio (Pa/Ps) of all conditions. ... 62
Table 3-4. Ethanol ambient-to-saturation pressure ratio (Pa/Ps) of all conditions. ... 62
Table 4-1. ND filter used in each condition for PRF95. ... 102
Table 4-2. ND filter used in each condition for PRF65. ... 102
ix
LIST OF FIGURES
Figure 1-1. 2016 USA Transportation Energy Source/Fuel ... 7
Figure 1-2. The evolution of EPA emission standards. ... 8
Figure 2-1. Schematic of the optical setup (1, point light source; 2, parabolic mirror; 3, constant volume chamber; 4, parabolic mirror; 5, knife edge; 6, high-speed camera; 7, injector). ... 27
Figure 2-3. Ambient-to-saturation ratio (Pa/Ps) of all experimental conditions. ... 28
Figure 2-4. Relationship between ambient-to-saturation ratio (Pa/Ps) and superheated degree (Tf-Tb). ... 29
Figure 2-5. Selected typical spray development under certain cases with different superheated degree. ... 30
Figure 2-6. Spray axial penetration development with time. ... 31
Figure 2-7. Peak penetration velocity of axial development under different conditions. ... 34
Figure 2-8. Relationship between peak penetration velocity and ambient-to-saturation pressure ratio. ... 35
Figure 2-9. Spray images at the same time frame under all conditions. ... 35
Figure 2-10. Spray penetration comparison at same time frame under all conditions. ... 36
Figure 2-11. Relationship between spray axial penetration and ambient-to-saturation pressure ratio. ... 37
Figure 2-12. Spray images with produced shock waves (top row: 75°C, 3kPa; middle row: 100°C, 3kPa; bottom row: 125°C, 3kPa) ... 37
Figure 2-13. Observed shock wave speed... 38
Figure 2-14. Schematic of spray plume front ... 39
Figure 2-15. Spray plume ratio comparison at same time frame under all conditions. ... 40
Figure 2-16. Relationship between spray plume ratio and ambient-to-saturation pressure ratio. ... 41
x axisymmetric with respect to the centreline. b. Schematic under extreme
superheated condition. ... 42
Figure 2-19. Schematic of P-v state along the flash boiling process. ... 42
Figure 3-1. Schematic of the optical setup (1, point light source; 2, parabolic mirror; 3, constant volume chamber; 4, parabolic mirror; 5, knife edge; 6, high-speed camera; 7, injector). ... 62
Figure 3-2. All experimental conditions and the vapor pressure curve of isooctane and ethanol. ... 63
Figure 3-3. Ambient-to-saturation ratio (Pa/Ps) for isooctane and ethanol under all experimental conditions. ... 64
Figure 3-4. Selected typical isooctane spray development under certain cases with different superheated degree. ... 65
Figure 3-5. Spray axial penetration development with time for ethanol. ... 66
Figure 3-6. Spray axial penetration development with time for mixture 50/50. ... 69
Figure 3-7. Spray axial penetration development with time for commercial gasoline. ... 72
Figure 3-8. Isooctane spray images at the same time frame under all conditions. ... 75
Figure 3-9. Ethanol spray images at the same time frame under all conditions. ... 76
Figure 3-10. Mixture 50/50 spray images at the same time frame under all conditions. ... 77
Figure 3-11. Commercial gasoline spray images at the same time frame under all conditions. ... 78
Figure 3-12. Heat of vaporization for the four fuels ... 79
Figure 3-13. State change of one single droplet during flash boiling: (a) ideal (b) reality. ... 80
Figure 3-14. Schematic of spray plume front ... 81
Figure 3-15. Peak penetration velocity comparison between different fuels. ... 81
Figure 3-16. Spray axial penetration (at the same time frame) comparison between different fuels. ... 83
xi Figure 4-1. Spray combustion images of PRF95 under ambient condition of 21% oxygen
concentration, 650K, no spark. ... 103 Figure 4-2. Spray combustion images of PRF95 under ambient condition of 21% oxygen
concentration, 700K, no spark. ... 104 Figure 4-3. Spray combustion images of PRF95 under ambient condition of 21% oxygen
concentration, 750K, no spark. ... 105 Figure 4-4. Spray combustion images of PRF95 under ambient condition of 21% oxygen
concentration, 800K, no spark. ... 106 Figure 4-5. Spray combustion images of PRF95 under ambient condition of 21% oxygen
concentration, 850K, no spark. ... 107 Figure 4-6. Spray combustion images of PRF95 under ambient condition of 21% oxygen
concentration, 900K, no spark. ... 108 Figure 4-7. Spray combustion images of PRF95 under ambient condition of 21% oxygen
concentration, 950K, no spark. ... 109 Figure 4-8. Spray combustion images of PRF95 under ambient condition of 21% oxygen
concentration, 650K, spark timing T3. ... 110 Figure 4-9. Spray combustion images of PRF95 under ambient condition of 10% oxygen
concentration, 800K, no spark. ... 111 Figure 4-10. Luminosity comparison and peak luminosity timing under 21% oxygen
condition. ... 112 Figure 4-11. Peak cumulative heat release (CHR) and peak CHR timing under 21% oxygen
condition. ... 113 Figure 4-12. Peak heat release rate (HRR) and peak HHR timing under 21% oxygen
condition. ... 114 Figure 4-13. Start of pressure rise and observed flame delay under 21% oxygen condition. ... 115 Figure 4-14. Luminosity comparison and peak luminosity timing under 15% oxygen
condition. ... 116 Figure 4-15. Peak cumulative heat release (CHR) and peak CHR timing under 15% oxygen
condition. ... 117 Figure 4-16. Peak heat release rate (HRR) and peak HHR timing under 15% oxygen
xii
condition. ... 120
Figure 4-19. Peak cumulative heat release (CHR) and peak CHR timing under 10% oxygen condition. ... 121
Figure 4-20. Peak heat release rate (HRR) and peak HHR timing under 10% oxygen condition. ... 122
Figure 4-21. Start of pressure rise and observed flame delay under 10% oxygen condition. ... 123
Figure 4-22. Flame luminosity and flame area development comparison between different oxygen levels under 950K, no spark condition. ... 124
Figure 4-23. Peak integrated luminosity comparison between different oxygen levels. ... 125
Figure 4-24. Peak heat release rate comparison between different oxygen levels. ... 126
Figure 4-25. Peak luminosity timing comparison between different oxygen levels. ... 127
Figure 4-26. Peak heat release rate timing comparison between different oxygen levels. ... 128
Figure 4-27. Peak cumulative heat release comparison between different oxygen levels. ... 129
Figure 4-28. Start of pressure rise timing comparison between different oxygen levels. ... 130
Figure 4-29. Spray combustion images of PRF65 under ambient condition of 21% oxygen concentration, 650K, no spark. ... 131
Figure 4-30. Spray combustion images of PRF65 under ambient condition of 21% oxygen concentration, 700K, no spark. ... 132
Figure 4-31. Spray combustion images of PRF65 under ambient condition of 21% oxygen concentration, 750K, no spark. ... 133
Figure 4-32. Spray combustion images of PRF65 under ambient condition of 21% oxygen concentration, 800K, no spark. ... 134
Figure 4-33. Spray combustion images of PRF65 under ambient condition of 21% oxygen concentration, 850K, no spark. ... 135
Figure 4-34. Spray combustion images of PRF65 under ambient condition of 21% oxygen concentration, 900K, no spark. ... 136
Figure 4-35. Spray combustion images of PRF65 under ambient condition of 21% oxygen concentration, 950K, no spark. ... 137
xiii
Figure 4-37. Average luminosity comparison between different conditions. ... 139
Figure 4-38. Peak integrated luminosity timing comparison between different conditions. ... 140
Figure 4-39. Peak cumulative heat release comparison between different conditions. ... 141
Figure 4-40. Peak cumulative heat release timing comparison between different conditions. .. 142
Figure 4-41. Peak heat release rate comparison between different conditions. ... 143
Figure 4-42. Peak heat release rate timing comparison between different conditions. ... 144
Figure 4-43. Start of pressure rise timing comparison between different conditions. ... 145
Figure 4-44. Pressure rise duration comparison between different conditions. ... 146
Figure 5-1. Spray combustion images of isooctane under 0.2 bar (20kPa) absolute pressure, 50°C. ... 161
Figure 5-2. Spray combustion images of isooctane under 0.2 bar (20kPa) absolute pressure, 90°C. ... 162
Figure 5-3. Spray combustion images of isooctane under 0.2 bar (20kPa) absolute pressure, 125°C. ... 163
Figure 5-4. Spray combustion images of isooctane under 0.3 bar (30kPa) absolute pressure, 50°C. ... 164
Figure 5-5. Spray combustion images of isooctane under 0.3 bar (30kPa) absolute pressure, 90°C. ... 165
Figure 5-6. Spray combustion images of isooctane under 0.3 bar (30kPa) absolute pressure, 125°C. ... 166
Figure 5-7. Spray combustion images of isooctane under 0.5 bar (50kPa) absolute pressure, 50°C. ... 167
Figure 5-8. Spray combustion images of isooctane under 0.5 bar (50kPa) absolute pressure, 90°C. ... 168
Figure 5-9. Spray combustion images of isooctane under 0.5 bar (50kPa) absolute pressure, 125°C. ... 169
Figure 5-10. Spray combustion images of isooctane under 1 bar (100kPa) absolute pressure, 90°C. ... 170
xiv
50°C. ... 172
Figure 5-13. Ignition and flame development under 0.2 bar (20kPa) absolute pressure, 90°C. ... 173
Figure 5-14. Ignition and flame development under 0.2 bar (20kPa) absolute pressure, 125°C. ... 173
Figure 5-15. Ignition and flame development under 0.3 bar (30kPa) absolute pressure, 50°C. ... 174
Figure 5-16. Ignition and flame development under 0.3 bar (30kPa) absolute pressure, 90°C. ... 175
Figure 5-17. Ignition and flame development under 0.3 bar (30kPa) absolute pressure, 125°C. ... 175
Figure 5-18. Ignition and flame development under 0.5 bar (50kPa) absolute pressure, 50°C. ... 176
Figure 5-19. Ignition and flame development under 0.5 bar (50kPa) absolute pressure, 90°C. ... 176
Figure 5-20. Ignition and flame development under 0.5 bar (50kPa) absolute pressure, 125°C. ... 177
Figure 5-21. Ignition and flame development under 1 bar (100kPa) absolute pressure, 90°C. ... 178
Figure 5-22. Ignition and flame development under 1 bar (100kPa) absolute pressure, 125°C. ... 179
Figure 5-23. Flame left front propagation velocity under different conditions. ... 179
Figure 5-24. Flame peak integrated luminosity and peak luminosity timing under different conditions. ... 180
Figure 5-25. Observed flame delay under different conditions. ... 181
Figure 5-26. Peak pressure value (absolute pressure) under different conditions. ... 181
Figure 5-27. Peak pressure timing under different conditions. ... 182
1
1.
Introduction
1.1.
Motivation
Gasoline engines have been playing an irreplaceable role in ground transportation and
commercial applications, with the advantages of gasoline fuels: high energy density and easy
transportability. Gasoline (excluding fuel ethanol) accounted for 55% of total U.S. transportation
energy use in 2017[1], as shown in Figure 1-1. Total gasoline consumption (including fuel ethanol
added to gasoline) for transportation averaged about 9 million barrels (1.427 ×10⁶ m3) per day.
With the wide popularity, gasoline engines have been a major contributor to the air
pollutant emissions, including carbon monoxide (CO), unburned hydrocarbon (UHC), oxides of
nitrogen (NOx), particulate matter (PM), and greenhouse gases. This continues to be a matter of
great concern, especially in large crowded metropolis cities, where the air condition is greatly
affected by the large number of running engines. This issue has been drawing more and more
attention and extensive research activities have been carried out in recent years to reduce fuel
consumption and pollutant emissions of automobile engines[2].
Gasoline direct injection (GDI), has been considered to have the potential to satisfy the
stringent emission requirements and becomes more popular in recent markets of spark-ignition
(SI) engines. GDI engines have been rapidly adopted by the automotive industry over the recent
years, from 2.3 percent of production for model year 2008 vehicles to over 45 percent production
for model year 2015[3]. In a GDI engine, the fuel is pressurized and injected via a common rail
fuel injection system directly into the combustion chamber of each cylinder as opposed to the more
conventional multi-point port fuel injection (PFI) technique. The incorporation of direct injection
strategy into a spark-ignition engine offers several improvements including enhanced fuel
2 engines is about 5%~10% higher than those using port fuel injection (PFI) engines [5,6]. Most
recently, Toyota has developed GDI engines with 40% thermal efficiency[7]. In spite of these
advantages, some studies have indicated that the mixture schemes and combustion mechanisms of
the GDI engine result in higher amounts of particulate matter (PM), especially during the
cold-start phase and at high acceleration operation conditions[8,9]. However, the particulate matter
emission from engine now only contribute 10 to 15 percent of the total from modern GDI vehicles.
Non-exhaust sources (tires, brakes, and dust kicked up from road surfaces) account for more than
90% of PM10 and 85% of PM2.5 emissions from passenger cars[10]. The latest GDI engine cars
are so advanced that they have similar total PM emission comparing to the modern electric cars
which have no exhaust PM emissions.
On the other hand, the emission regulation is becoming more and more stringent, which
forces the in-cylinder combustion process to be cleaner. The evolution of EPA emission standards
is shown in Figure 1-2, featuring substantial reductions of NOx and PM as well as more stringent
HC limits. The evolution of Euro emission standards is shown in Table 1-1. In order to meet those
requirements, researchers have been putting efforts into further increasing the spray quality,
reducing the droplet size, improving the combustion efficiency, thus developing cleaner and more
efficient spray and combustion.
Meantime, in order to achieve higher efficiency, Researchers have been introducing more
advanced combustion modes: Homogeneous charge compression ignition (HCCI), gasoline
compression ignition (GCI), spark assisted compression ignition (SACI). Mazda has been the early
adopter in using HCCI on passenger vehicles, and their next generation of ‘skyactiv-3’ engine
3 compression ignition engines can handle much higher load on gasoline-like fuels at given engine
parameters, and maintain low soot and NOx emission at the same time [12]. Hence running
compression ignition combustion modes with gasoline offers the potential for developing engines
of high efficiency and low emissions at lower cost and complexity. Additionally, NOx levels can
be reduced by reducing combustion temperature by either running lean, pre-mixed or using
EGR[13].
While gasolines with higher octane numbers can enable more efficient future spark ignition
(SI) engines, low octane gasoline-like fuels might be desirable in compression ignition (CI)
engines. Generally, low octane refinery fuel, such as Naphtha, is composed of C5 to C11
hydrocarbons and has a low research octane number (RON) value. Since these fuels requires much
less processing in the refinery than either gasoline or diesel, there is an additional benefit in terms
of well-to-wheel CO2 emissions and overall energy consumed[14]. Compared to commercial
gasoline and diesel fuels, blends of various refinery streams with low octane fuels have been
considered attractive alternatives to provide suitable chemical characteristics (longer ignition delay
than diesel) in GCI engines at lower production cost and well-to-tank CO2 emissions. Hao et
al.[15] found that compared with the conventional pathway, the low-octane gasoline-GCI pathway
leads to a 24.6% reduction in energy consumption and a 22.8% reduction in GHG emissions. It is
attracting research interest to have a deeper understanding on the spray and combustion
characteristics of gasoline and gasoline surrogate fuels.
1.2.
Research objectives
The objective of this study is mainly focused on the experimental investigation of spray
4 are as follows will be organized as follows:
Investigation of flash boiling spray of isooctane under different ambient pressure condition
and temperature. Study the effect of different superheated degree on the gasoline direct injection
hollow cone spray and how it improves the spray mixing process.
Investigation and comparison of flash boiling spray among different fuels. Study the
difference introduced by using fuel with different boiling point and superheated degree. Compare
the spray characteristics when using pure substance fuels and multicomponent mixture fuels. Give
insight about how to facilitate and utilize flash boiling for better spray mixing.
Investigation and comparison of compression auto-ignition (CI) and spark assisted
compression ignition (SACI) of two primary reference fuels (PRF) under spray G condition. Study
the effect of different added spark time on the combustion development. Compare the difference
in compression ignition process between high octane fuel and low octane fuel.
Investigation of spark ignition of direct injection flash boiling spray. Study the effects of
different superheated conditions on the spray and spark ignition combustion development. Try to
achieve better spray mixing and cleaner combustion process by combining flash boiling and spark
ignition.
1.3.
Outline
Chapter 2 focuses on the flash boiling spray of a hollow cone GDI piezoelectric injector
using pure isooctane. Different sets of heating devices were used to ensure that the fuel, injector
and ambient temperature are all kept at same value, eliminating the possible variations introduced
by temperature difference between the fuel and the environment inside the chamber. By the
5 different superheated degrees and different ambient-to-saturation pressure ratios (Pa/Ps) can be
achieved. The effects of superheated degree and flash boiling on the spray shape and spray
penetration development are analyzed and discussed. The characteristics of non-flash boiling and
flash boiling sprays are compared.
Chapter 3 characterizes the spray of both pure substance fuels and multicomponent fuels
under conditions involving flash boiling and no flash boiling under various parameters like
different temperature and ambient pressure, thus different superheated degrees. The effects of
superheated degree and flash boiling on the spray development and macroscopic features of
different fuels are analyzed and compared. The different between using pure substance fuel and
multicomponent fuel are also discussed.
Chapter 4 presents the study of compression auto-ignition and spark assisted compression
ignition experiments of PRF95 and PRF65 in a constant volume combustion chamber (CVCC)
under a given ambient gas density condition. Different oxygen levels were used to simulate
different exhaust gas recirculation (EGR) levels. Both the pressure data and high-speed video of
the combustion process were recorded and analyzed to study the effect of ambient temperature and
EGR levels on the combustion development. The effects of ambient temperature and EGR levels
on the combustion development are investigated and analyzed in the experiments. The heat release
rate and accumulative heat release under each condition are compared.
Chapter 5 provides experimental data to visualize combustion events under low ambient
pressure conditions inside a constant volume combustion chamber. This chapter focuses on
characterizing the spark assisted combustion following a spray event under different ambient
pressure and temperature combination under which the flash boiling can occur. In this section, by
6 development features are measured and analyzed. The characteristics of non-flash boiling spark
ignition and flash boiling spark ignition are compared. High-speed videos of the flame transient
development under low ambient pressure are studied and compared.
Chapter 6 summarizes the important conclusions and all the studies discussed in previous
sections. On the other hand, future work is also presented in the end.
1.4.
Tables and Figures
Table 1-1. The evolution of Euro emission standards.
Stage Date CO HC HC+NOx NOx PM PN
g/km #/km
Positive Ignition (Gasoline)
Euro 1† 1992.07 2.72 (3.16) - 0.97 (1.13) - - -
Euro 2 1996.01 2.2 - 0.5 - - -
Euro 3 2000.01 2.30 0.20 - 0.15 - -
Euro 4 2005.01 1.0 0.10 - 0.08 - -
Euro 5 2009.09b 1.0 0.10d - 0.06 0.005e,f -
Euro 6 2014.09 1.0 0.10d - 0.06 0.005e,f 6.0×10¹¹e,g
Compression Ignition (Diesel)
Euro 1† 1992.07 2.72 (3.16) - 0.97 (1.13) - 0.14 (0.18) - Euro 2, IDI 1996.01 1.0 - 0.7 - 0.08 - Euro 2, DI 1996.01a 1.0 - 0.9 - 0.10 -
Euro 3 2000.01 0.64 - 0.56 0.50 0.05 - Euro 4 2005.01 0.50 - 0.30 0.25 0.025 - Euro 5a 2009.09b 0.50 - 0.23 0.18 0.005f -
Euro 5b 2011.09c 0.50 - 0.23 0.18 0.005f 6.0×10¹¹
Euro 6 2014.09 0.50 - 0.17 0.08 0.005f 6.0×10¹¹
* At the Euro 1..4 stages, passenger vehicles > 2,500 kg were type approved as Category N1 vehicles † Values in brackets are conformity of production (COP) limits
a. until 1999.09.30 (after that date DI engines must meet the IDI limits) b. 2011.01 for all models
c. 2013.01 for all models d. and NMHC = 0.068 g/km
7
8
9
2.
Flash Boiling Hollow Cone Spray from a GDI Injector under Different
Conditions
2.1.
Introduction
Gasoline direct injection (GDI) technology has been considered to have the potential to
satisfy the stringent emission requirements and becomes more popular in recent spark-ignition (SI)
engines. The major advantages of a GDI engine are its increased fuel efficiency and high power
output [5,6,16]. The spray characteristics and droplet breakup have always been an important topic
of further improving liquid fuel atomization [17], which is critical to combustion and emissions in
GDI engines. The atomized small droplets can greatly enhance the fuel vaporization and fuel-air
mixing.
High pressure injection systems are widely used in GDI engines to atomize liquid fuel to
small droplets. High injection pressure and smaller droplets enable fast engine transient response,
good efficiency and reduce emissions[4,18] . But there is also limitation with using a high injection
pressure to atomize liquid fuel. Firstly, the liquid momentum is usually high under a high injection
pressure, and the liquid fuel could over penetrate and impinge on the cylinder wall and/or piston
surface. This could cause abnormal combustion (such as pool fires), leaving a high level of
unburned hydrocarbon and soot emissions [19–21]. On the other hand, the effects of injection
pressure on droplet size reduction decline or even diminish as the injection pressure further
increases[22]. Researchers have tried different approaches, such as injecting the fuel with pressure
and temperature beyond its critical points [23]. However, it is very hard to maintain the fuel beyond
its critical points under normal engine operation conditions. Superheated injection and flash
boiling are relatively easier to achieve in GDI engines and it can facilitate spray atomization and
10 under a certain ambient pressure, or if it is being put into an environment with an ambient pressure
lower than the saturation pressure at the corresponding temperature. This process is typically
associated with very fast timescales due to the sudden pressure drop [24]. The rapid reduction in
pressure and simultaneous increase in superheat extent cause the fuel to enter a metastable state
with significant superheat thermal energy, which is consumed via the rapid flash boiling process
[25]. Flash-boiling of fuel sprays can have a significant effect on spray formation and its
characteristics, due to bubble nucleation, growth, and phase change, producing explosive-like
atomization and complex spray structures [26], by undergoing flash boiling the fluid regains
equilibrium [27]. Sher et al. [28] summarized the stages of the flash boiling mechanisms. It was
found that there were three stages to flash boiling: bubble nucleation, bubble growth, and
two-phase flow. Bubble nucleation is classified into two groups: 1) homogeneous, in which nucleation
sites form within the liquid itself in the absence of any bubble nuclei, and 2) heterogeneous
nucleation in which gas and solid phases appear at an interface or a boundary rather than in the
liquid [29]. The stages of bubble growth were further discussed by Plesset et al. [30] and Kawano
et al. [31]. VanDerWege [32] identified two regimes of flash boiling: internal flashing and external
flashing. Internal flashing occurs when bubbles are formed inside an injector orifice leading to the
ejection of a two-phase flow consisting of both liquid and vapor. The spray expands rapidly when
exiting the injector. External flashing occurs when the liquid jet is intact as it exits the injector
orifice but is then shattered by rapid bubble growth as it moves downstream of the orifice. Vieria
and Simoes-Moreira [33] examined isooctane flashing regime and found that flashing takes place
at the surface of the liquid core through an evaporation wave, which results from a sudden liquid
11 Flash boiling spray can occur in GDI engines under part load conditions, particularly when
operating in late inlet valve opening strategies. Flash boiling has been observed by several
researchers in gasoline engines [32,35,36]. In today's GDI engines, the temperature of fuel in the
injector is normally high due to the heat transfer from the engine coolant and combustion gases.
When such a hot fuel is injected during the intake stroke with low in-cylinder pressure, the fuel
temperature could exceed its boiling point and trigger flash boiling. It has been reported that up to 99% of injections during the ‘New European Driving Cycle’ are superheated in mid-range cars
[37]. The intensity of flash boiling increases with superheat degree. Flash-boiling of gasoline fuel
sprays in direct-injection engine applications can have a positive effect on air–fuel mixing, due to
the increased evaporation rate and smaller droplet sizes [38,39]. However, depending on the exact
plume orientation and injector nozzle type, flashing and spray collapse may lead to decreased liner
wall wetting but increased piston wall wetting due to increased axial momentum of the spray [40].
Studies have been carried out to investigate the influential factors on the flash boiling of
GDI injection. Xu et al. [41] studied the flash boiling sprays from a multi-hole direct injection
injector using various optical diagnostic techniques. They found that the ratio between the ambient
pressure and the liquid saturation pressure (Pa/Ps) plays an important role during the spray flash
boiling with good correlations to the spray characteristics. Wood et al. [42] made drop size
measurements and showed that under flash boiling conditions the large droplets within the spray
were all broken down into smaller droplets by the flash boiling process, a Sauter mean diameter
(SMD, namely D32) reduction of 42% for a superheat degree of 36°C. Yang et al. [43] studied the
effect of flash boiling sprays on the combustion characteristics of a GDI optical engine under cold
start. Their results show an improvement of indicated mean effective pressure and a reduction of
12 were conducted on fuel flashing boiling with a multi-hole injector and the ambient environment
temperature is not controlled or monitored. Few works were done on the flash boiling sprays from
hollow cone piezoelectric GDI fuel injectors. In this study, experiments were carried out to study
the flash boiling spray of a hollow cone GDI piezoelectric injector. Different sets of heating
devices were used to ensure that the fuel, injector and ambient temperature are all kept at same
value, eliminating the possible variations introduced by temperature difference between the fuel
and the environment inside the chamber. By the combination of different temperature (25 °C to
125 °C) and ambient pressure (1 kPa to 100 kPa), different superheated degrees and different
ambient-to-saturation pressure ratios (Pa/Ps) can be achieved. The effects of superheated degree
and flash boiling on the spray shape and spray penetration development are analyzed and
discussed.
2.2.
Setup and diagnostics
The experimental setup consists of a constant volume chamber (CVC), a fuel injection
system, a Schlieren imaging system and a high-speed imaging system. The CVC used is a chamber
with six ports. The optical access was enabled by two quartz windows mounted on two ports
opposite to each other. Other ports were sealed by solid stainless steel plugs with accessory
components. The inner diameter of the quartz window is 100 mm, and the internal volume of the
chamber is 0.95 L. More details of the chamber can be found in the previous publications [44,45].
During the experiment, the chamber is vacuumed to a certain pressure. The fuel injection system
consists of a low-pressure fuel supply pump, a high-pressure pump, a fuel rail, and a piezoelectric
outwardly opening hollow cone fuel injector. The high-pressure pump is driven by a 2 horsepower
13 scheme. More details of the injector and fuel injection system can be found in previous publications
[46]. The injection pressure was maintained at 8 MPa. The uncertainty of injection pressure from
data acquisition is about 0.015 bar (0.0015MPa). The injection duration was kept as 1 ms by an
external pulse generator (Stanford DG535) and the measured injected fuel mass was 34.13 mg per
injection. The temperature of the chamber body, fuel injector body and gasoline common rail were
all monitored by multiple thermocouple and were governed by close-loop controlled heaters,
ensuring that they have the same temperature. This eliminates the possible variations introduced
by temperature difference for fuel from common rail to inside the chamber, which may introduce
more unquantifiable parameters.
The Schlieren photography method is an effective way to record the flow of fluids with a
varying density. In this study, the Schlieren method enables us to see the boiling of the spray and
the gaseous region, which is originally transparent and not necessarily visible. The Schlieren
imaging system consists of a point light source, two parabolic mirrors and a knife edge, as shown
in Figure 2-1. A high-speed camera (Phantom V4.3 from Vision Research Inc.) was used to capture
the images. A 50 mm fixed focal length lens was used to collect the signal. The F number (F#)
was set at 5.6 and the exposure time was 2 μs. The camera was set at 8113 frames per second (fps)
with a resolution of 240×240 pixels. The corresponding physical image resolution was
approximately 0.416 mm/pixel. The uncertainty in the spray penetration length measurement is
about 0.416 mm and the velocity uncertainty is approximately 4.16 m/s. Five sets of high-speed
videos were taken for each condition and saved for processing. In each experiment case, 50 images
(4 pre-trigger and 46 post-trigger) were captured, and 20 images with spray were used for the spray
analysis. The camera was triggered simultaneously with fuel injection by the same pulse delay
14 by frame. After each spray image was extracted from the video, a digital filter was applied to the
image for noise reduction. The original background before injection was subtracted from all of the
images, then a background intensity level was added to all the images. In this study the pixel value
of background intensity level was set at 140 (out of 255), in order to show both the darker region
(liquid) and the brighter region (vapor) than the background. The image quality was further
enhanced by adjusting the contrast. The next operation was to use an edge detection algorithm
(based on a given intensity threshold) to find the spray penetration front near the axis location. The
spray front edge was then recognized. The averaged value of the spray penetration front was
defined as the spray axial penetration length. The shock wave detection used a similar algorithm
but with different threshold values.
Table 2-1 shows all the experiment settings and conditions, as well as the vapor pressure
value of isooctane. Vapor pressure curve under different temperature is also shown in Figure 2-2.
There are six different temperatures used: 25°C, 50°C, 75°C, 90°C, 100°C and 125°C. Seven
different ambient pressures were used: 1 kPa, 3 kPa, 5 kPa, 7 kPa, 10 kPa, 30 kPa and 100 kPa.
The vapor pressure curve of a pure substance denotes the saturation pressure (Ps) at the
corresponding temperature, or the boiling point temperature (Tb) at the corresponding pressure.
The equation used to calculate the vapor pressure of a pure substance is the Antoine equation:
𝑃 = 10𝐴−𝐶+𝑇𝐵 (1)
or
𝑙𝑜𝑔𝑃 = 𝐴 − 𝐵
15 The parameters for isooctane in the Antoine equation are shown in Table 2-2. With this
vapor data, we can calculate the superheated degree (SD), as well as the ambient-to-saturation
pressure ratio. Superheat degree (SD) is defined as the difference between liquid temperature and
boiling point (Tf-Tb) under a given pressure. It is an intuitive expression of superheating and
widely used to indicate the superheat state of a liquid. However, this parameter is a dimensional
value. On the other hand, another way to indicate the superheat state is to use the
ambient-to-saturation pressure ratio (Pa/Ps). This definition of superheat degree is dimensionless and easier
to use for dimensional analysis. Table 2-3 shows the Pa/Ps values of all experiment conditions.
For a state above boiling point (super-heated), Pa/Ps <1. For a state below boiling point
(subcooled), Pa/Ps>1. The non-dimensional ambient-to-saturation pressure ratio value can
facilitate comparing the experimental results under different pressure/temperature combinations,
as shown in Figure 2-3.
Though the two definitions (Pa/Ps and SD) are closely correlated, their relationship is not
linear. This is due to the fact that the vapor pressure curve is not linear.
𝑙𝑜𝑔𝑃𝑎 = 𝐴 − 𝐵
𝐶+𝑇𝑏 (3)
𝑙𝑜𝑔𝑃𝑠 = 𝐴 − 𝐵
𝐶+𝑇𝑓 (4)
log (𝑃𝑎 𝑃𝑠) =
𝐵 𝐶+𝑇𝑓−
𝐵 𝐶+𝑇𝑏=
𝐵(𝑇𝑏−𝑇𝑓)
(𝐶+𝑇𝑓)(𝐶+𝑇𝑏) (5)
Also, the definition of superheated degree (SD) is:
𝑆𝐷 = 𝑇𝑓− 𝑇𝑏 (6)
𝑇𝑓 = 𝑆𝐷 + 𝑇𝑏 (7)
log (𝑃𝑎 𝑃𝑠) =
𝐵∗(−𝑆𝐷) (𝐶+𝑇𝑏+𝑆𝐷)(𝐶+𝑇𝑏) =
𝐵 𝑆𝐷+𝐶+𝑇𝑏−
𝐵
16 not linear. Figure 2-4 shows the Pa/Ps vs SD (Tf-Tb) plots of isooctane at the six temperatures
used in this study. In Figure 4a where the y-axis value of Pa/Ps is shown in linear scale, we can
notice that the lines are very close to each other when Pa/Ps is in 0 to 1 range. In Figure 4b where
the y-axis value of Pa/Ps is shown in logarithmic scale, the curves are shown in a better and clearer
way. This is because it is actually log(Pa/Ps) which has a direct relationship with SD, as shown
above, and it is better to differentiate the superheated condition using log(Pa/Ps) instead of Pa/Ps.
Consequently, in this paper all the Pa/Ps axis will be shown in a logarithmic scale, in order to
better indicate the effect of different superheated conditions.
2.3.
Results and discussions
In this section, by the combination of different temperature (25 °C to 125 °C) and ambient
pressure (1 kPa to 100 kPa), the effects of different superheated conditions on the spray
development and macroscopic features are measured and analyzed. The characteristics of
non-flash boiling and non-flash boiling sprays are compared.
2.3.1. Spray images
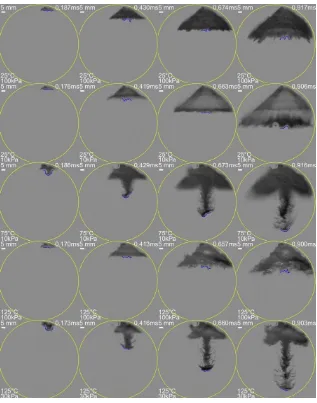
Figure 2-5 shows the images of typical spray development under certain given conditions:
25°C 100kPa, 25°C 10kPa, 75°C 10kPa, 125°C 100kPa, and 25°C 30kPa. It is noticed that under
room condition (25°C, 100kPa) the spray maintains a hollow cone umbrella shape when it develops
with time. Under high superheated conditions, the flash boiling of the hollow cone spray is
believed to cause the spray to expand both inwards and outwards. The inward expansion of the
axisymmetric spray forms a plume shape front which is being pushed out (Row 3 and Row 5 of
spray development pictures in Figure 2-5). This phenomenon becomes stronger as the superheated
17 and vapor area next to the plume. Due to blockage of light, the liquid zone in the observation area
is often darker than the background. However, in Rows 3-5 in Figure 2-5, there are some regions
with higher/brighter than the background pixel value (which is kept at 140 during image
processing). This indicates that there is boiling/vapor generated at this region, which indicates that
the Schlieren method can enable us to observe the change in gas density.
Under low superheat condition (room condition), flash boiling does not occur and the spray
develops as the originally designed hollow cone shape. Some minor evaporation occurs at the
spray edges but it has no obvious effects on the spray shape development. When the superheated
degree is increased and the ambient-to-saturation pressure ratio is smaller than 1, boiling occurs at
the spray edge and the inward expansion begins to converge together near the axis. Then the plume
is gradually pushed out. When the superheated degree is further increased (Pa/Ps<0.1), flare flash
boiling happens (very strong inward and outward expansion and boiling, spray plume is nearly as
wide as the original spray). The spray plume also develops much faster in this case.
2.3.2. Spray penetration development
In order to compare the spray development with time, the spray axial penetration length
was analyzed. The spray axial penetration developments with time under different conditions are
shown in Figure 2-6. All the cases with the same temperature and different ambient pressures are
grouped in the same graph. It is seen that under 25°C, all the penetration lengths except for 1 kPa
are very close to each other, while the 1 kPa case clearly has longer penetration than other pressure
cases. As the temperature increases, the majority of penetration development under different
pressure cases gradually become longer. Two interesting cases are the 30 kPa and 100 kPa cases.
For the 100 kPa cases, the axial penetration development does not change much with different
18 case becomes faster than that of 100 kPa. Another interesting thing to note is that under low
superheated degree conditions (the condition is slightly below the vapour pressure curve), the weak
phase change process can slightly disturb and slow down the spray penetration development.
Under the 25°C and 50°C conditions, both the 100 kPa and the 30 kPa cases are above the vapor
pressure curve (Figure 2). The penetration development of 30 kPa is slightly faster than 100 kPa.
When the temperature is increased to above 75 °C, the 30 kPa condition is below the vapor pressure
curve (Figure 2), which means that there exists weak phase change during the spray development.
As seen in the 90 °C condition, the penetration development of 30 kPa is slightly slower than 100
kPa (the 100 kPa case is still above the vapor pressure curve and thus no phase change). When the
temperature is further increased to 100 °C, it is seen that in the early stage, the penetration
development of 30 kPa is slightly slower than 100 kPa. In the later stage strong boiling occurs and
a spray plume front is formed, causing the penetration to increase rapidly. Similarly, at 50°C, for
the cases of 10 kPa, 30 kPa and 100 kPa, there is no strong flash boiling. However, the 10 kPa case
is already below the vapor pressure curve (Figure 2), and there exists weak phase change. This
slightly disturbs and reduces the penetration, which explains why the 10 kPa case is slightly slower
than the 30 kPa case. Generally speaking, with the increase of the superheated degree, the spray
plume front gradually appears and the spray axial penetration becomes longer.
2.3.3. Peak penetration velocity
Using the non-dimensional ambient-to-saturation pressure ratio, we can combine the
information of temperature and ambient pressure into one parameter, enabling us to put all data of
different conditions in one graph. Here, the peak penetration velocity is used as a characteristic
19 Figure 2-7 shows the peak penetration velocity for different cases. The two graphs show
the same data. In the left graph points with same temperature are connected, while in the right
graph points with same pressure are connected. It is noticed that when Pa/Ps>0.5, the peak
penetration velocity does not change much for different conditions. In this range, the spray
penetration is determined by the initial spray momentum, and the effect of flash boiling is minor.
When Pa/Ps<0.5 the peak penetration velocity increases with the increase of superheated degree,
until it reaches around 200 m/s. In this range, the flash boiling and spray plume front becomes the
dominant factor affecting the spray axial penetration. When Pa/Ps <0.1, the increase of velocity
slows down. Figure 2-8 shows the trend of peak velocity increase of different superheated
conditions.
2.3.4. Spray axial penetration length
In order to compare the spray penetration and spray plume development under different
cases, spray images at the same frame with similar time after the start of fuel injection are selected
and compared for all the fuel injection conditions. Figure 2-9 shows the spray images at the same
frame under certain experimental conditions. The temperature increases from the top to the bottom
and the ambient pressure increases from the left to the right. It is seen that on the top right corner
(low superheated degree) the spray remains its original hollow cone shape and the plume does not
appear. As the superheated degree is increased, the plume gradually appears and the width of the
plume becomes wider with higher superheated degree. In the bottom left corner (highest
superheated degree), strong flash boiling takes place and the original hollow cone shape is
deformed. For most of the high temperature cases, boiling phenomenon at the periphery of the
20 saturation pressure ratio as a non-dimensional parameter. Figure 2-10 shows the spray penetration
at the same time frame under different conditions. Here the graph on the left uses
ambient-to-saturation ratio (Pa/Ps) as the x-axis, while the graph on the right use superheated degree (Tf-Tb)
as the x-axis. Three regimes are noticed in the Pa/Ps graph. When Pa/Ps>0.5, the spray penetration
stays almost the same for different temperature and ambient pressure conditions. In this regime,
the effect of superheating on spray development can be negligible. When 0.1<Pa/Ps<0.5, spray
penetration quickly increases with the decrease of Pa/Ps value (increase of superheated degree),
and there is an obvious correlation between the spray penetration and log(Pa/Ps). In this regime,
the effect of superheating starts taking place. When Pa/Ps<0.1, the spray penetration continues to
increase with the decrease of Pa/Ps, but the rate of increase slows down. In this regime, flare flash
boiling occurs and the spray hollow cone shape is hardly maintained, while the spray penetration
further increases. It can also be seen that the Tf-Tb graph shows a similar trend, but the lines of
data are more dispersed in the penetration increasing region. This corresponds to the earlier
discussions of the relationship between the superheated degree (SD) and the ambient-to-saturation
pressure ratio (Pa/Ps). This also indicates that while two cases with similar Pa/Ps value can exhibit
similar penetration length character, two cases with similar Tf-Tb value can show some difference
in the axial penetration length. Overall, the ambient-to-saturation ratio is a better flash boiling
indicating parameter than the superheated degree (SD), in regard of the penetration discussion.
A better way to show the three regimes as well as the relationship between spray axial
penetration and ambient-to-saturation pressure ratio, is to remove the temperature condition lines
and add correlation trend-lines to different regimes, as it is shown in Figure 2-11. Here the
21 In the regime of 0.1<Pa/Ps<0.5:
𝐿𝑝𝑒𝑛 = −32.8 ln (𝑃𝑎
𝑃𝑠) + 2.9413 (9) when Pa/Ps<0.1:
𝐿𝑝𝑒𝑛 = −6.916 ln (𝑃𝑎
𝑃𝑠) + 56.509 (10)
2.3.5. Shock wave speed
Another benefit of using Schlieren method is that it enables us to observe the shock wave
produced by fast developing spray front. The shock wave front is usually observed under high
superheated (low Pa/Ps) conditions. Figure 12 shows some conditions with the observable shock
wave front under 3 kPa ambient pressure. Here the generated shock wave is a compression shock
wave, and the shock wave is moving forward with time. At the shock wave interface the upstream
pressure is higher than the downstream, and the pressure difference is pushing the shock wave
forward. As the ambient pressure goes lower, it becomes better to treat the ambient gas as ideal
gas, due to the low density and less interaction between gas molecules. Figure 2-13 shows the
observed shock wave front speed. In Figure 2-13a, data points with same temperature are
connected, while in Figure 2-13b conditions with same ambient pressure are connected. Generally,
the shock wave front speed increases with the increase of superheated degree. It can also be noticed
that the observed shock wave front speed is usually higher than the peak penetration velocity from
the observed spray front.
2.3.6. Spray plume ratio
In order to compare the spray plume front condition between different experiment
conditions, spray plume ratio is used in this study. The spray plume radius is not selected as the
key parameter here, because plume radius value is usually dependent on the spray cone radius and
22 the extent of flash boiling, and here we are using the plume ratio value of each experiment
condition at the same time frame with the spray axial penetration discussion in the last part. Figure
2-14 shows a schematic of the spray plume front, as well as the plume radius and spray cone radius.
Figure 2-15 shows the spray plume ratio at the same time frame under all conditions. Here
the graph on the left uses ambient-to-saturation ratio (Pa/Ps) as the x-axis, while the graph on the
right use superheated degree (Tf-Tb) as the x-axis. It is noticed that when Pa/Ps is larger than 0.5,
the plume does not appear and the plume ratio is zero. When Pa/Ps is smaller than 0.5, there is a
good linear relationship between plume ratio at a certain time frame and the log(Pa/Ps), across all
the experiment conditions. However, when looking at the superheated degree (Tf-Tb) figure, the
6 temperature lines does not overlap with each other. For two cases with the same superheated
degree (Tf-Tb), for example Tf-Tb=75°C, the case with lower temperature will have higher plume
ratio value. This shows that a similar superheated degree value (Tf-Tb) can have more impact and
cause greater extent of flash boiling on a lower temperature condition.
On the other hand, ambient-to-saturation pressure ratio is proved to be a good parameter
across different temperature conditions to indicate the extent of flash boiling. Figure 2-16 shows
the correlation between spray plume ratio and ambient-to-saturation ratio. It can be seen that with
Pa/Ps value further reduced to an extreme low condition (extremely superheated), the spray plume
ratio is approaching 1. When Pa/Ps<0.5,
𝑅𝑝𝑙𝑢𝑚𝑒 = −0.216 ln (𝑃𝑎
𝑃𝑠) − 0.1177 (11)
2.3.7. Spray shape analysis
Figure 2-17 shows the schematics of hollow cone spray under different superheated
23 flash boiling condition. The spray remains normal hollow cone shape. There is some evaporation
on the edge of the spray, but it is minor and does not affect the spray shape. Flash boiling happens
in the graph in the middle, and leads to inward expansion. Inward expansion is being pushed
together and spray plume gradually appears. The graph on the right shows a case with even higher
superheated degree. In this case strong flash boiling and micro-explosion takes place at the spray.
The original spray cone shape is hardly maintained.
Because the spray in this study is a hollow cone spray and is axisymmetric, we can treat it
using a 2D model with an axis condition in the middle, as in Figure 2-18a. For the initially
compressed fluid inside the injector nozzle, state 0, has the same pressure with the injection
pressure. Then the fluid undergoes a process from state 0 to state 1, while we assume that the liquid
state 1 is uniform and constant along the pure liquid surface. The pressure at state 1is the saturation
pressure at the interface between fluid and two-phase mixture flow. The sudden phase change from
state 1 to state 2, happens on the liquid surface through an evaporation wave, a phenomenon well
studied by Simoes-Moreira et al. [57]. The main characteristics of an evaporation wave are: 1) the
evaporation wave is a narrow and observable region that envelopes the evaporation front; 2) in an
evaporation wave, the metastable liquid is transformed into a high-speed two-phase flow; 3) across
the evaporation wave, the fluid pressure and the temperature decrease as a consequence of the
sudden evaporation process. Then the two-phase flow undergoes an expansion process from state
2 to state 3, with the vapor percentage increasing and the liquid percentage decreasing. With the
phase changing and expansion, this 2-to-3 process will be moving in the direction towards larger
specific volume on the P/v diagram. Meantime, with the two-phase mixture further evaporating
and absorbing heat, the local temperature is also further decreased. The two-phase flow gradually
24 the distance from state 2 to state 4 is greatly lengthened, due to the higher velocity of the
two-phase flow. The inward 2-D high-velocity two-two-phase flow will then get close to the axis boundary
and have to move downwards because of the axis boundary condition and the converging nature
when developing towards the axis (the circumference becomes smaller and the two-phase flow in
each plane starts to converge). Thus, the plume is formed, as is shown in Figure 2-18b. In the study
[57], after high degrees of expansion, state 3 pressure P3 is already lower than state 4 pressure P4.
Due to this pressure difference, the shock wave in their case is actually moving towards the liquid
core, while the vapor/mixture is moving away from the liquid core and crossing the shock wave
interface. This leads to an equilibrium and causing the shock wave to be stationary in the absolute
coordinate system. In our case, the spray evaporation and shock wave generation are different from
the above. The upstream pressure is higher than the downstream pressure at the shock wave
interface. The shock wave is a compression shock wave and is being pushed forward by the
pressure difference, thus moving forward with time.
2.4.
Summary
In this study, experiments were carried out to study the flash boiling isooctane spray of an
outwardly opening hollow cone GDI piezoelectric injector. By the combination of different
temperature and ambient pressure, different superheat degrees (SD, or Tf-Tb) and different
ambient-to-saturation ratios (Pa/Ps) can be achieved. The effects of superheated degree and flash
boiling on the spray shape and spray penetration development are analyzed and discussed. Some
key findings are as follows:
1. For a hollow cone injector, the flash boiling spray can cause the cone shape spray to
25 would merge together and form a fast developing plume along the axis of the spray, and the
transition point for the plume to appear is around 0.5 for Pa/Ps ratio. The plume radius to spray
cone radius ratio, as a non-dimensional value, can be a good indicator of the extent of flash boiling.
When Pa/Ps is smaller than 0.5, a good linear relationship exists between plume ratio and the
log(Pa/Ps);
2. When Pa/Ps ratio is larger 0.5, the spray penetration is mostly determined by the initial
spray momentum, and the effect of flash boiling is minor. When Pa/Ps ratio is smaller than 0.5,
the peak penetration velocity increases with the increase of superheated degree, until it reaches
around 200 m/s. In this range, the flash boiling and spray plume front becomes the dominant factor
affecting the spray penetration velocity;
3. The spray axial penetration result at a certain time frame shows three regimes: When
Pa/Ps ratio is larger than 0.5, the effect of superheating on spray development can be negligible,
and spray penetration stays the same; When Pa/Ps ratio is between 0.1 and 0.5, spray penetration
quickly increases with the decrease of Pa/Ps value (increase of superheated degree), and there is
an obvious correlation between the spray penetration and log(Pa/Ps); When Pa/Ps is smaller than
0.1, flare flash boiling happens and the spray shape is hardly maintained due to the
micro-explosion, while the spray penetration further increases. The SD (Tf-Tb) graph shows similar
trend, but the lines of data are more dispersed with each other in the penetration increasing zone;
4. The relationship between Pa/Ps and SD is usually not linear, thus there will be minor
difference between using SD and Pa/Ps as the reference or abscissa to analyze the data trend. While
two cases with similar Pa/Ps value can exhibit similar penetration characteristic, two cases with
26 penetration discussion.
2.5.
Tables and figures
Table 2-1. All experimental settings and conditions and the vapor pressure value of isooctane.
Camera frame rate 8113 fps
Resolution 240×240
F # 5.6
Exposure time 2 μs
Injection pressure 8 MPa
Injection duration 1 ms
Injected mass 34.13 mg
Temperature(°C) Corresponding vapor
pressure(kPa) Ambient pressure (kPa)
25 6.58 1 3 5 7 10 30 100
50 19.53 1 3 5 7 10 30 100
75 48.25 1 3 5 7 10 30 100
90 77.42 1 3 5 7 10 30 100
100 103.53 1 3 5 7 10 30 100
125 198.90 1 3 5 7 10 30 100
Table 2-2. Parameters for isooctane in the Antoine equation.
Temperature (K) A B C
194.64 - 298.44 3.94736 1282.332 -48.444 297.51 - 373.28 3.93679 1257.840 -52.415
Table 2-3. Ambient-to-saturation pressure ratio (Pa/Ps) of all experimental conditions.
25 °C 50 °C 75 °C 90 °C 100 °C 125 °C
1 kPa 0.15 0.05 0.02 0.01 0.01 0.01
3 kPa 0.46 0.15 0.06 0.04 0.03 0.02
5 kPa 0.76 0.26 0.10 0.06 0.05 0.03
7 kPa 1.06 0.36 0.15 0.09 0.07 0.04
10 kPa 1.52 0.51 0.21 0.13 0.10 0.05
30 kPa 4.56 1.54 0.62 0.39 0.29 0.15
27
Figure 2-1. Schematic of the optical setup (1, point light source; 2, parabolic mirror; 3, constant volume chamber; 4, parabolic mirror; 5, knife edge; 6, high-speed camera; 7, injector).
Figure 2-2. All experimental conditions and the vapor pressure curve of isooctane.
1 10 100
-10 10 30 50 70 90 110 130
Vap
or
pr
essur
e(kPa)
Temperature(°C)
25 °C
50 °C
75 °C
90 °C
100 °C