University of Windsor University of Windsor
Scholarship at UWindsor
Scholarship at UWindsor
Electronic Theses and Dissertations Theses, Dissertations, and Major Papers
1-1-2011
Lower Extremity Isometric Training and its Effect on Type 2
Lower Extremity Isometric Training and its Effect on Type 2
Diabetic Claudication.
Diabetic Claudication.
Martina Kovacevic
University of Windsor
Follow this and additional works at: https://scholar.uwindsor.ca/etd
Recommended Citation Recommended Citation
Kovacevic, Martina, "Lower Extremity Isometric Training and its Effect on Type 2 Diabetic Claudication." (2011). Electronic Theses and Dissertations. 7178.
https://scholar.uwindsor.ca/etd/7178
This online database contains the full-text of PhD dissertations and Masters’ theses of University of Windsor students from 1954 forward. These documents are made available for personal study and research purposes only, in accordance with the Canadian Copyright Act and the Creative Commons license—CC BY-NC-ND (Attribution, Non-Commercial, No Derivative Works). Under this license, works must always be attributed to the copyright holder (original author), cannot be used for any commercial purposes, and may not be altered. Any other use would require the permission of the copyright holder. Students may inquire about withdrawing their dissertation and/or thesis from this database. For additional inquiries, please contact the repository administrator via email
Lower Extremity Isometric Training and its Effect on Type 2 Diabetic Claudication
by
Martina Kovacevic
A Thesis
Submitted to the Faculty of Graduate Studies through Kinesiology
in Partial Fulfillment of the Requirements for the Degree of Master of Human Kinetics at the
University of Windsor
Windsor, Ontario, Canada 2011
1*1
Library and Archives CanadaPublished Heritage Branch
395 Wellington Street OttawaONK1A0N4 Canada
Bibliotheque et Archives Canada
Direction du
Patrimoine de I'edition
395, rue Wellington OttawaONK1A0N4 Canada
Your file Votre r6f6rence ISBN: 978-0-494-81740-7 Our file Notre reference ISBN: 978-0-494-81740-7
NOTICE: AVIS:
The author has granted a
non-exclusive license allowing Library and Archives Canada to reproduce, publish, archive, preserve, conserve, communicate to the public by
telecommunication or on the Internet, loan, distribute and sell theses
worldwide, for commercial or non-commercial purposes, in microform, paper, electronic and/or any other formats.
L'auteur a accorde une licence non exclusive permettant a la Bibliotheque et Archives Canada de reproduire, publier, archiver, sauvegarder, conserver, transmettre au public par telecommunication ou par I'lnternet, preter, distribuer et vendre des theses partout dans le monde, a des fins commerciales ou autres, sur support microforme, papier, electronique et/ou autres formats.
The author retains copyright ownership and moral rights in this thesis. Neither the thesis nor substantial extracts from it may be printed or otherwise reproduced without the author's permission.
L'auteur conserve la propriete du droit d'auteur et des droits moraux qui protege cette these. Ni la these ni des extraits substantiels de celle-ci ne doivent etre imprimes ou autrement
reproduits sans son autorisation.
In compliance with the Canadian Privacy Act some supporting forms may have been removed from this thesis.
Conformement a la loi canadienne sur la protection de la vie privee, quelques formulaires secondaires ont ete enleves de cette these.
While these forms may be included in the document page count, their removal does not represent any loss of content from the thesis.
Bien que ces formulaires aient inclus dans la pagination, il n'y aura aucun contenu manquant.
Author's Declaration of Originality
I hereby certify that I am the sole author of this thesis and that no part of this thesis has been published or submitted for publication.
I certify that, to the best of my knowledge, my thesis does not infringe upon anyone's copyright nor violate any proprietary rights and that any ideas, techniques, quotations, or any other material from the work of other people included in my thesis, published or otherwise, are fully acknowledged in accordance with the standard referencing practices. Furthermore, to the extent that I have included copyrighted material that surpasses the bounds of fair dealing within the meaning of the Canada Copyright Act, I certify that I have obtained a written permission from the copyright owner(s) to include such material(s) in my thesis and have included copies of such copyright clearances to my appendix.
Abstract
Individuals with type 2 diabetes (T2D) are prescribed aerobic exercise as treatment, however, peripheral arterial disease (PAD), a complication of T2D, restricts lower extremity blood flow causing claudication during the activity. Isometric exercise has been shown to increase local blood flow in other populations. This thesis tested the hypothesis that bilateral lower extremity isometric training would increase both initial (ICD) and absolute claudication distances (ACD) by increasing blood flow. Four males with T2D and PAD performed 4, 2-minute bilateral lower extremity isometric
contractions at 30% of their maximal effort, 3X/week for 6-8 weeks. Pre and post-exercise ICD, ACD and blood flow were measured before and after the intervention. ICD and ACD increased 116.3+26.3% and 47.5±34.1%, respectively (Z=2.475; p=.008) with bilateral lower extremity isometric training, however, pre and post-exercise blood flow remained unchanged. These findings suggest that bilateral lower extremity isometric training increases ICD and ACD by a mechanism other than increased blood flow.
Acknowledgements
I would like to thank the participants who took part in this study. Thank you for taking time out of your schedules to help me with this project. Furthermore, thank you for the companionship, great stories and life lessons shared throughout the study. Without you, this project would not have been possible.
I would also like to thank the institutions which supported me by opening their doors for participant recruitment: Windsor-Essex Chronic Disease Management Program, Windsor-Essex Cardiac Wellness Program, and the Windsor Regional Hospital
Endocrinology, Nutrition and Diabetes Clinics. To Windsor Vascular Lab, thank you for not only allowing me to recruit participants, but also for inspiring this study's research and supporting me throughout this process in so many ways.
To the members of the PACR Lab, thank you for filling my years in grad school with countless laughs, smiles and experiences that will never be forgotten. A special thanks goes to Mike Gregory for being an excellent research assistant and sacrificing so much time to aid with data collection.
Thank you to the ladies at the Kinesiology front office, Pat Mctaggart, Cathy Greenwell and Diane Dupuis. I very much appreciate the numerous times you
accommodated all of my needs into your very busy schedules. Also, a much deserved thank you to Don Clarke for developing and building the materials and equipment which were integral to this study.
I also would like to acknowledge all of the members of my thesis committee: Dr. Kevin Milne, Dr. Karen Williamson and Dr. Neil McCartney. Your support, guidance, advice and time made this project the success it has become.
Table of Contents
Title Page
Author's Declaration of Originality iii
Abstract iv
Acknowledgements v
List of Tables viii
List of Figures ix
List of Appendices x
List of Abbreviations xi
Chapter 1: Introduction and Literature Review 1
1.1 Diabetes Mellitus (DM) 2
1.1.1 Introduction 2
1.1.2 Blood Glucose Regulation 2
1.1.3 DM- A Closer Look: Types, Pathophysiology and Risk Factors 6
1.1.4 Complications of DM 12
1.1.5 Recommendations for the Treatment of DM 23
1.2 Peripheral Arterial Disease in DM 29
1.2.1 Peripheral Arterial Disease (PAD) 29
1.2.2 Methods of Assessing PAD 30
1.2.3 Treatment Recommendations for PAD 33
1.3 Summary of Background 42
1.4 Thesis Objectives 44
1.6 Clinical Relevance 44
Reference List 46
Chapter 2: Lower Extremity Isometric Training and its Effect on Type 2 Diabetic 62
Claudication: Manuscript
2.1 Introduction 63
2.2 Purposes and Hypotheses 67
2.3 Methods 67
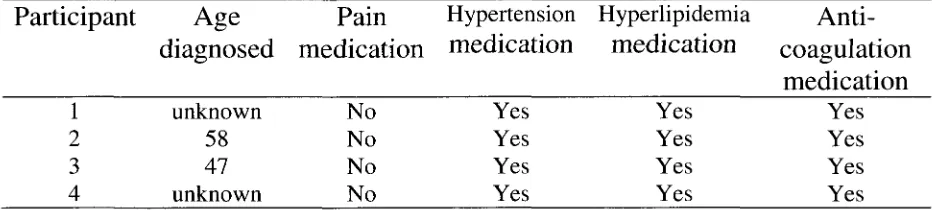
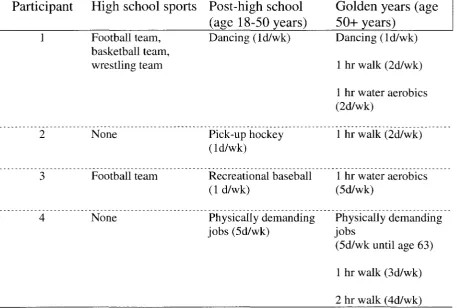
2.3.1 Participants 67
2.3.2 Study Design 68
2.4 Results 74
2.5 Discussion 76
2.6 Limitations 78
2.7 Conclusion 80
2.8 Clinical Relevance 81
Reference List 82
Tables 90
Figures 97
Appendices 117
List of Tables
Table Page
1. Summary of the Differences Between Type 1, Type 2 and Gestational Diabetes.. 91
2.1 Participant Characteristics: Age, Sex and Race 92
2.2. Participant Characteristics: Peripheral Arterial Disease-Related 92
2.3 Participant Characteristics: Type 2 Diabetes-Related 92
2.4 Participant Characteristics: Physical Activity History 93
3.1 Raw Data: Popliteal Artery Diameters 94
3.2 Raw Data: Popliteal Artery Timed-Average Mean Velocity 94
3.3 Raw Data: Resting Ankle-Brachial Index 94
3.4 Raw Data: Pre & Post-Exercise Session Blood Glucose Measurements 95
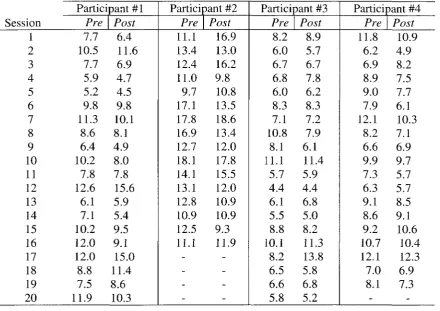
4.1 Results Table: Initial Claudication Distance (ICD)/Absolute Claudication
Distance (ACD) 96
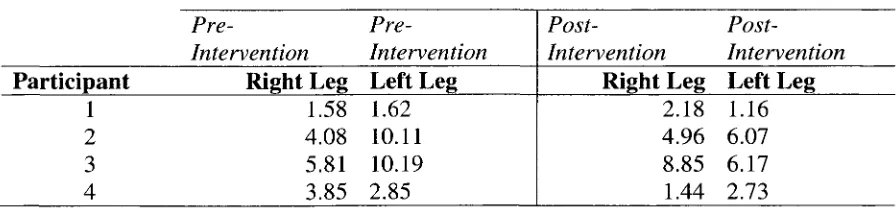
4.2 Results Table: Pre-Exercise Blood Flow 96
List of Figures
Figure Page
1. The Negative Feedback System of Control for Blood Glucose 98
2. Glycolysis in the Sarcoplasm of the Beta Cell 99
3. The Kreb's Cycle in a Mitochondrion of the Cell 100
4. The Electron Transport Chain in a Mitochondrion 101
5. Beta Cell Glucose Uptake and Insulin Release 102
6. Insulin-Stimulated GLUT4 Translocation in a Muscle Cell 103
7. Glycogenesis in Skeletal Muscle and Liver Cells 104
8. Ketone Body Formation in the Liver and Breakdown in Skeletal Muscle 105
9. Vasodilation Caused by the Effect of Nitric Oxide in a Smooth Muscle Cell 106
10. Formation of Nitric Oxide in an Endothelial Cell 107
11. Formation of Reactive Oxygen Species instead of Nitric Oxide in the Presence
of Dyslipidemia/Hyperglycemia 108
12. Foam Cell Formation from Low-Density Lipoproteins in an Endothelial Cells.. 109
13. Conversion of Dihyroxyacetone Phosphate into Diacylglycerol 110
14. Protein Kinase C and Smooth Muscle Contraction I l l
15. Smooth Muscle Cell Proliferation Caused by Hyperinsulinemia 112
16. ATP Production in the Phosphagen Energy System 113
17. GLUT4 Translocation caused by AMP Protein Kinase 114
18. Lipolysis: The Breakdown of Triacylglycerol into Glycerol and 3 Fatty Acids... 115
List of Appendices
Appendix Page
A. University of Windsor Review Ethics Board Consent 118
B. Windsor Regional Hospital Research Ethics Board Consent 119
C. Poster Advertisement 120
D. Letter of Information for Consent to Participate in Research 121
E. Consent to Participate in Research 124
F. Medical Questionnaire 127
G. Physical Activity Readiness Medical Examination (PARmed-X) 128
H. Personal Medical History Questionnaire 132
I. Release of Medical Information 133
J. Automated Arterial Oscillometry Device 134
K. Duplex Ultrasound Machine 135
L. Gardner Protocol 136
M. Blood Glucose Monitoring System 137
N. Spring-Loaded Lancet 138
Abbreviations
ABC ABI aCoA ACE ADMA ADP AMP AMPK APOA-1 ATP BP cAMP cmadenosine triphosphate binding GD cassette
ankle-brachial index GLUT2
acetyl Coenzyme A GLUT4
angiotensin converting enzyme H+
asymmetrical dimethylarginine H2O
adenosine diphosphate adenosine monophosphate adenosine monophosphate kinase apolipoprotein Al hr HDL IP3 K+ Kg LCAT adenosine triphosphate blood pressure
cyclic adenosine monophosphate LDL
Centimeter LoLITA gestational diabetes
glucose transporter protein 2 (beta cell)
glucose transporter protein 4 (muscle cell)
hydrogen ion
2 hydrogen ions and an oxygen ion (water) hour high-density lipoprotein inositol-1,2,5-triphosphate potassium ion kilogram
lecithin cholesterol acyl transferase
low-density lipoprotein
lower leg isometric training apparatu
d DHAP DM ECG eNOS ET-1 FAD day dihydroxyacetone phosphate diabetes mellitus electrocardiogram
enzyme nitric oxide synthase
endothelin 1
flavin adenine dinucleotide
m MAPK mg mi min ml mM meter
mitogen activated protein kinase
milligram
mile
minute
milliliter
millimol
FADH2 flavin adenine dinucleotide and 2 mmHg hydrogen ions
mph
MVC
NAD
miles per hour
maximum voluntary contraction ROS
nicotinamide adenine dinucleotide
NADH+H nicotinamide adenine
dinucleotide and 2 hydrogen ions P Phosphate
PACRLab physical activity &
cardiovascular research lab PAD peripheral arterial disease
PARMed-X physical activity readiness medical questionnaire
PIP2
phosphotidylinositol-4,5-biphosphate
PPi Pyrophosphate
xl
ROS
sec
SOLES
T1D
T2D
V
VSMC
wk
radius squared
reactive oxygen species
second
sustained optimal load exercise software
type 1 diabetes
type 2 diabetes
velocity
vascular smooth muscle cell
1.1 Diabetes Mellitus (DM)
1.1.1 Introduction
Diabetes mellitus (DM) is a disease characterized by elevated blood glucose
(hyperglycemia) due to inadequate insulin secretion or action (Centers for Disease
Control and Prevention, 2010). It affects over 180 million people worldwide, a figure
that will likely double by 2030 (World Health Organization, 2008). DM is a prominent
risk factor for the world's leading cause of death, cardiovascular disease, and over half of
the individuals diagnosed with diabetes die before the age of 70 (World Health
Organization, 2009a; Grundy et al., 1999). The only non-infectious disease classified as
an epidemic, DM is not the result of genetic factors alone, as both the environment and/or
an individual's behaviour (such as a sedentary lifestyle and high calorie diet) often play a
major role in its development (World Health Organization, 2008; Zimmet, Alberti, &
Shaw, 2001).
Before discussing, in detail, the different types of DM, it is important to first
understand blood glucose and its regulation in a healthy population.
1.1.2 Blood Glucose Regulation
Blood Glucose
Glucose, a monosaccharide or simple sugar, is a type of carbohydrate (molecules
composed of atoms of carbon, hydrogen and oxygen), a fuel that can rapidly provide the
refers to the amount of glucose present in blood (Candian Diabetes Association, 2008).
The normal fasting blood glucose level in humans is 4.0 mM-6.0 mM (Canadian Diabetes
Association, 2008). With the ingestion of food or drink composed of this simple sugar,
the blood glucose level will rise and alter the body's internal environment (National
Diabetes Information Clearinghouse, 2008).
Negative Feedback and Blood Glucose Regulation Mechanisms
One of the goals of the human body is to maintain a constant internal environment
or homeostasis. The regulation of blood glucose is accomplished through a negative
feedback system. In general terms, this negative feedback system is composed of three
elements: a sensor, a control center and effectors. A change in the internal environment
acts as a stimulus that is detected by the sensor. The sensor sends a signal to the control
center which assesses the amount of change that has occurred in the internal environment,
then the control center sends the appropriate signal to the effectors. The effectors
produce a response to correct the change in the internal environment that was detected.
This feedback system is considered a negative feedback system because the response it
produces is negative or opposite of the stimulus. (Powers & Howley, 2009)
In relation to blood glucose regulation, a blood glucose concentration that is
elevated above normal (a change in the internal environment) is the stimulus detected by
the sensor (the pancreas) and the signal sent to the effector (also the pancreas) from the
control center is to increase insulin secretion (insulin is responsible for increased glucose
uptake by cells) which, in turn, decreases the blood glucose concentration (see Figure 1)
Blood glucose regulation mechanisms are responsible for the success of this
negative feedback system. After the digestion of a meal or drink containing
carbohydrates blood glucose levels can increase to levels as high as 8 mM (Jewell, Oh, &
Thurmond, 2010; Canadian Diabetes Association, 2008). The glucose molecules (which
have increased in number) travel through the bloodstream to pancreatic beta-cells (Jewell,
Oh, & Thurmond, 2010). These molecules then attach to the membrane spanning glucose
transporter proteins (GLUT2) of the beta-cell and enter via facilitated diffusion (Inagaki
et al., 1992). While in the beta-cell, glucose is acted on by the enzyme glucokinase to
produce glucose-6-phosphate and it undergoes the processes of glycolysis (see Figure 2),
the Kreb's cycle (see Figure 3) and the electron transport chain (see Figure 4) to produce
molecules of the energy compound adenosine triphosphate (ATP) (Inagaki et al., 1992).
The resultant increase in ATP is responsible for closing the ATP-sensitive
potassium channels located on the beta-cell membrane and this leads to the depolarization
(membrane potential is dependent on potassium flux) of the membrane, thus opening the
voltage-gated calcium channels and allowing calcium to enter the cell (Atwater, Dawson,
Eddlestone, & Rojas, 1981). This increase in calcium in the cell induces the release of
more calcium from the intracellular endoplasmic reticulum by activating phospholipase C
which cleaves phosphotidylinositol-4,5-biphosphate (PJP2) into
inositol-1,4,5-triphosphate (IP3) and diacylglycerol (IP3 binds to a receptor protein in the endoplasmic
reticulum initiating calcium release) (Atwater et al., 1981). The further increase in
calcium causes the release of insulin from the beta-cell by influencing exocytosis (see
The newly released insulin binds to insulin receptors on skeletal and cardiac
muscle cells and this action causes the activation of the enzyme tyrosine kinase which
phosphorylates (activates through the donation of a phosphate ion from adenosine
triphosphate breakdown) insulin receptor substrate proteins (Robinson & Buse 2008).
The activated insulin receptor substrate proteins then bind to and subsequently activate
phosphotidylinositol-3 kinase which in turn activates protein kinase B (Robinson & Buse,
2008). Protein kinase B phosphorylates the protein AS 160 (which is responsible for
converting the Rab protein into its inactive form of guanosine diphosphate) and
dissociates it from the glucose transporter protein located inside the muscle cell (GLUT4)
(Hardie, 2002). Once dissociated, AS 160 no longer promotes the Rab-guanosine
diphosphate conversion and the Rab gets converted into its active form, guanosine
triphosphate which causes the translocation of GLUT4 to the cell membrane (Klip &
Paquet, 1999; Hardie, 2002). It should be noted that at all times there are GLUT4s
located on the cell membrane, but the aforementioned process increases the number of
GLUT4s located on the cell membrane (Klip & Paquet, 1999). Extracellular glucose
molecules enter the cell by binding to the membrane spanning GLUT4s (see Figure 6)
(Klip & Paquet, 1999). Once inside the muscle cell, the glucose can be broken down
during glycolysis (see Figure 2), the Kreb's cycle (see Figure 3) and the electron
transport chain (see Figure 4) to produce energy compounds (such as ATP) or it can be
converted into stored energy in the form of glycogen through glycogenesis (see Figure 7).
As glucose progressively enters the muscle cells, blood glucose levels fall
concurrently, with an eventual return to within a normal range (Jewell, Oh, & Thurmond,
(Powers & Howley, 2009). In a pathology such as DM, some of the mechanisms do not
work properly and blood glucose levels do not return to normal unless a form of therapy
is administered (Canadian Diabetes Association, 2008).
1.1.3 DM- A Closer Look: Types, Pathophysiology and Risk Factors
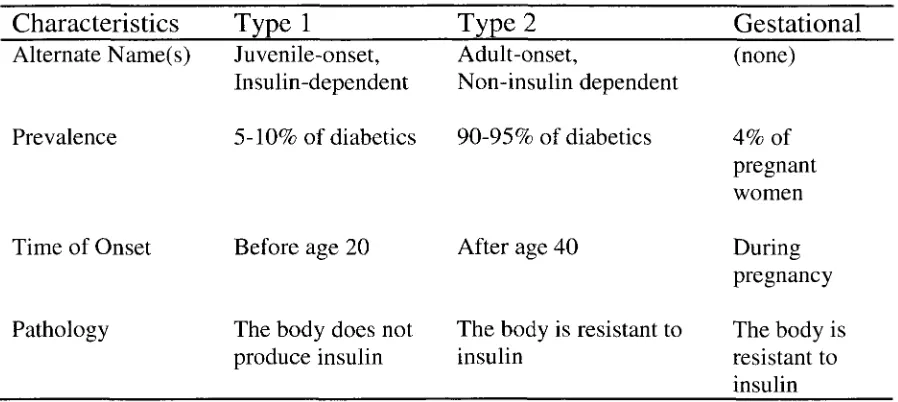
The DM population can be divided into three groups: Those with type 1 diabetes
(T1D; the body lacks insulin), those with type 2 diabetes (T2D; the body is resistant to
insulin) and those with gestational diabetes (GD; affects women during pregnancy) (see
Table 1) (Berg, 1986).
Type 1 DM (T1D)
Pathophysiology of T1D
Although the causes of type 1 DM (T1D) have long been purported to be genetic
and/or environmental another prominent theory in the diabetes literature is that
individuals are insulin-dependent because the beta-cells of the pancreas that produce
insulin are destroyed by the body in an autoimmune attack (Cihakova, 2001).
The trigger and the process for this autoimmune attack are still unknown
(Cihakova, 2001). One theory involves cytotoxic T-cells. Cytotoxic T-cells are
lymphocytes (white blood cells) that destroy viruses, infected cells and cells labeled by
programmed cell death (these cells usually have a bulging or unattached cell membrane)
within the pancreas where the beta-cells are situated) and begin destroying beta-cells
(Ueda et al., 2003).
Whatever the cause, the destruction of beta-cells means that insulin cannot be
produced or secreted by the body. Thus, the negative feedback system fails and
hyperglycemia results (American Heart Association, 2011). As in healthy individuals,
after ingestion of carbohydrates, blood glucose increases in a person with TID (Canadian
Diabetes Association, 2008). Glucose molecules travel through the blood stream and in
healthy individuals, some glucose molecules travel to the pancreatic beta-cells to
stimulate insulin secretion. In contrast, with TID, there are no beta-cells to travel to and
thus no insulin to release (Kloppel, Lhor, Habich, Oberholzer, & Heitz, 1985). Insulin is
responsible for increasing the number of GLUT4s (glucose transporter proteins) on the
muscle cell membrane (Klip & Paquet 1999). Without insulin, the number of GLUT4s
during this state of increased blood glucose concentration remains the same as during the
state of fasting blood glucose concentration (Klip & Paquet, 1999). There are too many
glucose molecules for the GLUT4s to transport into the muscle cell and hyperglycemia
results. The destruction of the beta-cells can progress for many years before it is detected
and this is because symptoms (such as hyperglycemia and ketoacidosis) only develop
when 90% of the cells have been destroyed (Cihakova, 2001).
Risk factors for TID
Individuals with TID may have a genetic predisposition to contracting the
disease. If a female under the age of 25 years with TID gives birth, her child has a 1 in
increases (Permutt, Wasson, & Cox 2005). If a man has T1D, then the chances of his
child developing the disease are 1 in 17, but if both parents have T1D then the risk can
increase to 1 in 4 (Permutt et al., 2005). In addition, there are some environmental
factors associated with T1D disease development. It has been noted that T1D develops
more frequently in children who live in places with cold climates and in children who
were exposed to a viral infection (American Diabetes Association, 2009). Also, children
who were not breastfed and began eating solid foods at an earlier age had a greater
chance of developing T1D (Permutt et al., 2005). Even though individuals may differ in
the method of contracting T1D, they all share the commonality of destroyed or decreased
pancreatic beta-cells (Kloppel et al.,1985).
Type 2 DM (T2D)
Type 2 DM (T2D) is also known as adult-onset, insulin-resistant or
noninsulin-dependent diabetes, and accounts for 90-95% of all the documented DM cases
(University of Virginia Health System, 2007; Berg, 1986). T2D is considered adult-onset
because the disease usually affects individuals after the age of 40 years, although there
has been a recent significant increase in the number of children under the age of 16 years
who develop the disease (Berg, 1986; American Diabetes Association 2009). Individuals
are non-insulin dependent because although the body has the beta-cells to produce
insulin, the muscle cells are resistant to it (Weyer, Bogardus, Mott, & Pratley, 1999).
Hyperglycemia results from the delayed glucose uptake by muscle cells on account of the
insulin resistance, and the negative feedback system fails (Weyer et al., 1999). T2D
occurrence depends on genetic predisposition and environmental influence (Canadian
Pathophysiology of T2D
There are four stages in the development of T2D (Weir & Bonner-Weir, 2004).
These stages are insulin resistance, altered beta-cell function, continuous increase of
fasting blood glucose concentration and disease (Weir & Bonner-Weir, 2004). In the first
stage, the beta-cells produce insulin in response to increased blood glucose levels, but the
muscle cells have a reduced ability to take up glucose at that particular blood insulin
concentration (Weir & Bonner-Weir, 2004). The muscle cells' insulin receptors do not
allow any insulin to bind and the GLUT4s are not translocated to the cell membrane to
increase the transport of glucose into the cell (Klip & Paquet, 1999). The beta-cells, in
turn, produce more insulin in an attempt to increase insulin-insulin receptor binding and
promote increased glucose uptake (Weir & Bonner-Weir, 2004). This increase in insulin
production causes the beta-cells to increase in number and size (Weir & Bonner-Weir,
2004). In some individuals, the beta-cells cannot produce the amount of insulin needed
for adequate insulin-insulin receptor binding and adequate glucose uptake, and
hyperglycemia results (Weir & Bonner-Weir, 2004).
The phenomenon of insulin resistance and its causes are still not fully understood.
It is unknown why the muscle cells become resistant to the insulin that is secreted to
increase glucose uptake. There are, however, some common characteristics among
individuals with insulin resistance such as abdominal obesity (a waist circumference of
greater than 102 cm and 88 cm in men and women, respectively), dyslipidemia (an
abnormal lipid profile of hypertriglyceridemia (increased triglyceride levels of >1.7 mM),
high low-density lipoprotein (LDL) (>3.4 mM) and a low level of high-density
hypertension (sustained elevations in resting arterial blood pressure; BP) and increased
fasting blood glucose concentration. Although the causes of insulin resistance are
unknown, a potential long term outcome is T2D. (Canadian Diabetes Association, 2008)
The second stage of T2D development is altered beta-cell function. With insulin
resistance and decreased glucose uptake, an individual's fasting blood glucose level
increases from the normal ~4.0 mM to >5.6 mM (Brunzell et al., 1976). As fasting blood
glucose levels approach 5.6 mM, beta-cells begin to secrete less insulin (Brunzell et al.,
1976). Combined with insulin resistance, this decrease in insulin secretion contributes to
hyperglycemia because less insulin is available to help promote glucose uptake (Weir &
Bonner-Weir, 2004). Eventually the fasting blood glucose levels are increased beyond
6.7 mM, a level at which insulin secretion almost completely ceases (Brunzell et al.,
1976). The molecular mechanisms behind the loss of insulin secretion are unknown, but
glucose toxicity offers a potential explanation (Brunzell et al., 1976). Beta-cells function
in an optimal range of blood glucose concentration (4.0 mM-6.0 mM) and if the blood
glucose levels increase too high (>6.7 mM), the constant internal environment changes
and the functions of the beta-cells begin to alter and almost cease (Brunzell et al., 1976).
Altered beta-cell function and loss of insulin secretion lead to even less glucose uptake
and a greater degree of hyperglycemia (Weir & Bonner-Weir, 2004).
In the third stage of T2D development, the fasting blood glucose levels continue
to rise above 7.4 mM due to the insulin resistance of muscle cells and the impaired
insulin secretion of the pancreatic beta-cells. From stage three, it can take an individual
several years before they reach stage four, fully developed T2D. In stage four, the body
ketoacidosis (decrease in arterial pH due to the presence of excessive ketones from fat
metabolism in lieu glucose metabolism) (Weir & Bonner-Weir, 2004)
Risk factors for T2D
Environmental factors have a significant influence on T2D development
(American Diabetes Association, 2004). Individuals who are obese or who lead the
"Western" lifestyle (calorie-rich diet, high-fat diet and low physical activity) are at risk
for T2D, especially if they have a family history of the disease (Malecki, 2005). If one
parent has been diagnosed with T2D before the age of 50 years, then the child has a 1 in 7
chance of developing T2D, but the risk does decrease as the parent's age of onset
increases (Malecki, 2005). If both parents have been diagnosed with T2D at any age,
then the child has a 1 in 2 chance of developing T2D (Malecki, 2005).
Gestational Diabetes (GD)
Gestational diabetes (GD) affects approximately 4% of all pregnant women, and
represents new-onset hyperglycemia and T2D during pregnancy (Canadian Diabetes
Association, 2009; Campbell et al., 2009). Women who are above the age of 35 and/or
are obese have an increased risk of developing GD (Canadian Diabetes Association,
2009). Also women who have had GD in the past or have given birth to overgrown
babies increase their chances of developing the condition (Canadian Diabetes
Association, 2009). If an affected woman does not control her GD, not only does she
increase her risk of developing T2D later in life (Canadian Diabetes Association, 2009),
she increases nutrient availability to her fetus which contributes to fetal overgrowth and
Pathophysiology and risk factors for GD
Much like T2D, the exact cause of GD is unknown, but insulin resistance (see
Pathophysiology of type 2 diabetes) is an integral part of the condition (Catalano et al.,
2003). Another potential cause of GD is abnormal beta-cell sensing of glucose (Catalano
et al., 2003). On the pancreatic beta-cell, the glucose sensor and transporter is GLUT2
(Inagaki et al., 1992) and by means unknown, GLUT2 functions become impaired and
beta-cell does not take up glucose or release insulin and the outcome is hyperglycemia
(Inagaki et al., 1992; Catalano et al., 2003).
1.1.4 Complications of DM
DM has many associated complications, some of which are specific to the form of
DM, and some of which are common among all three types (Canadian Diabetes
Association, 2008). One of the most common complications of TID and a leading cause
of hospitalizations is ketoacidosis, which occurs if an individual fails to administer a
sufficient amount of insulin (Berg, 1986). Complications that are common among
individuals with DM regardless of the type are neuropathy (nerve disease), nephropathy
(kidney disease), endothelial dysfunction and hypertension (high systemic arterial blood
pressure) (Canadian Diabetes Association, 2008). No matter the type of complication,
the side effects can be very serious and even deadly (Canadian Diabetes Association,
Ketoacidosis
Ketoacidosis is a condition which affects individuals with T1D, although there
have been rare cases of individuals with T2D with the condition (Berg, 1986). With
inadequate administration of exogenous insulin (a common treatment for T ID discussed
below in the section titled Pharmacological Treatment Options for DM), glucose cannot
be used to produce the energy compounds needed to fuel the body. To review, insulin
increases the number of glucose transporters (GLUT4s) on the muscle cell membrane that
are responsible for glucose entry into the cell (Klip & Paquet, 1999). Without insulin, the
increase in GLUT4s does not occur (Klip & Paquet, 1999) and inadequate glucose is
transported into the cell therefore, the body needs to rely on another source to create
energy compounds (such as ATP) that will be use in bodily processes. The alternative
energy sources are ketone bodies (Fery & Balasse, 1985).
Ketone bodies are created in the liver and are used as a source of fuel when the
muscle cells are unable to use glucose in glycolysis and the Kreb's cycle for fuel (Fery &
Balasse, 1985). Specifically, the liver acquires acetyl coenzyme A (acCoA) from the
oxidation of fatty acids and two molecules of acCoA are acted upon by the enzyme
thiolase to form acetoacetyl coenzyme A which is eventually converted into the ketone
body acetoacetate (Hird & Symons, 1962). Acetoacetate can enter the blood stream as
itself, but it can also undergo reactions to form two other ketone bodies called
beta-hydroxybutyarate and acetone (Lopes-Carodoso et al., 1975). All three ketones enter the
blood stream, acetone travels to the kidneys to be expelled in urine and the former two
bodies are converted into acCoA to be used in the Kreb's cycle to produce ATP, depicted
in Figure 8.
If the ketone bodies are produced faster than they are catabolized or taken up by
the muscle cells, they begin to accumulate in the blood stream (to bring the blood pH
below 7.2) and ketoacidosis occurs (Fery & Balasse, 1985). An individual with
ketoacidosis may feel thirsty and/or nauseous, have abdominal pain, display frequent
urination and have acetone breath (sweet, fruit-like smelling breath) (Chiasson et al.,
2003). Ketone bodies are strong acids and their accumulation can disrupt any
physiological function ultimately leading to death if untreated (Chiasson et al., 2003).
Ketoacidosis can be treated with intravenous insulin administration (Chiasson et al.,
2003).
Neuropathy
Neuropathy is a disorder arising from nerve damage (Canadian Diabetes
Association, 2008). There are four types of diabetic neuropathies: peripheral (affects
legs, feet, toes, arms, hands and fingers), autonomic (affects heart rate, blood pressure,
perspiration, and digestive, bowel, bladder and sexual function), proximal (affects thighs,
hips and buttocks) and focal (affects a single nerve or group of nerves causing localized
muscle weakness) (National Institute of Diabetes and Digestive and Kidney Diseases,
2009). Peripheral neuropathy is the most common type of neuropathy in DM and the
popular sites of nerve damage are the ulnar, peroneal (fibular) and tibial nerves which
lead to loss of sensation and uncomfortable pain in the wrists and feet (Dyck & Thomas,
several years to develop and it is a condition with many pathologies and etiologies
(Vinik, Strotmeyer, Nakave, & Patel, 2008). With respect to the diabetic population, it is
believed that neuropathy is caused by hyperglycemia and dyslipidemia (Vinik et al.,
2008). Hyperglycemia and dyslipidemia cause peripheral arterial disease (PAD), which
itself is a complication of DM (and will be discussed below in Peripheral Arterial
Disease (PAD)), but one which reduces blood flow and increases hypoxia (lack of
oxygen) to the nerves causing damage (Vinik et al., 2008). There is no true treatment for
neuropathy, but affected individuals can wear properly fitted shoes and take analgesics to
reduce pain (National Institute of Neurological Disorders and Stroke, 2008).
Nephropathy
Nephropathy is the term used to describe kidney disease (Canadian Diabetes
Association, 2008). Kidney disease describes a collection of pathologies that prevent the
kidney from performing its filtering and blood pressure regulation functions causing
wastes and excess fluids to remain in the body (The Kidney Foundation of Canada,
2009c). Almost half of all individuals with nephropathy also have DM (Canadian
Diabetes Association, 2008). Although kidney disease has many causes,
glomerulosclerosis (thickening of the tiny blood vessel walls of the kidney) is the most
common cause in DM (Kalant, 1978). In a normal kidney, blood filtering occurs in the
glomerulus (a collection of capillaries) where blood pressure (BP) forces water and small
molecules out of the capillaries, into the nephron tubule and out of the kidneys as urine,
leaving larger and much needed molecules such as red blood cells and protein to continue
circulating throughout the blood (Campbell et al., 2009). Glomerulosclerosis causes
capillaries and into the nephron and it compromises waste filtering (Kalant, 1978).
Along with compromised waste filtering, there is poor resting arterial BP regulation
because the kidney damage creates a situation where excess water that is to be expelled
as urine re-enters blood circulation (Kalant, 1978). The first indication of kidney disease
is proteinuria (excess protein in the urine >30mg/day) (Canadian Diabetes Association,
2008). The damage and thickening of the vessel walls in the glomerulosclerotic
condition is associated with hyperglycemia (Kalant, 1978). The increase in vessel wall
thickening is proportionate to increases in blood glucose concentration (Kalant 1978).
Treatment options for kidney disease include dialysis and transplantation. With
dialysis, a machine withdraws blood from the body and passes it through a dialyzer (an
artificial kidney) (The Kidney Foundation of Canada, 2009a). The dialyzer contains
dialysis fluid that is responsible for removing waste products from the blood (The Kidney
Foundation of Canada, 2009a). A day dialysis treatment session can take up to 5 hours
and most individuals receive 3 treatments per week (The Kidney Foundation of Canada,
2009a). Nocturnal dialysis treatments (offered separately from day dialysis treatments)
take place while the individual is asleep and there are usually 6-7 treatment sessions each
week (Pierratos, 1999). The second treatment option for kidney disease is
transplantation. Transplantation involves removing affected kidneys and replacing them
with healthy kidneys from either a live or recently deceased donor. Kidney transplants
Endothelial Dysfunction
In DM, it is thought that hyperglycemia and dyslipidemia contribute to the
dysfunction of the vascular endothelium (Canadian Diabetes Association, 2008). The
endothelium is a type of simple squamous epithelium that lines the heart and blood
vessels. The endothelium functions to regulate vascular tone (the degree to which a
blood vessel is vasoconstricted or vasodilated), control thrombogenic processes (prevent
the formation of blood clots and influence the degradation of them) and control
inflammatory processes (such as platelet adhesion to blood vessel walls) (Ehrman,
Gordon, Visich, & Keteyian, 2009). In a healthy endothelial cell, nitric oxide is produced
and transported into vascular smooth muscle cells (VSMC) where it acts as the prominent
agent for vasodilation, depicted in Figure 9. The process of nitric oxide formation begins
with a receptor located on the endothelial cell membrane (Boger et al., 1998). The
receptor is coupled with acetylcholine, bradykinin or acted upon by shear stress (from
increased blood flow) and this stimulates an increase of calcium in the cytosolic space
(Hayden & Tyagi, 2002). The increase in calcium activates the enzyme nitric oxide
synthase (eNOS) which reacts with oxygen and this action allows for the co-factor
tetrahydrobiopterin to couple another co-factor, nicotinamide adenine dinucleotide, to
L-arginine to form nitric oxide and L-citruilline (see Figure 10) (Boger et al., 1998). The
effects of nitric oxide are counterbalanced by the production and release of
vasoconstricting substances, the most powerful one of which is endothelin 1 (ET-I)
(Morris & Jardine, 2000). ET-I acts on VSMC to induce vasoconstriction via endothelin
stimulating endothelin B receptors and triggering the release of nitric oxide (Morris &
Jardine, 2000).
Endothelial dysfunction occurs when there are alterations in the expression and/or
release of vasoactive, anti-growth, anti-inflammatory and/or anti-thrombotic substances
(Faulx, Wright, & Hoit, 2003), thus preventing the endothelium from properly carrying
out its function (Avogaro, Fadini, Gallo, Pagnin & de Kreutzenberg, 2006). In DM and
other cardiovascular diseases, endothelial dysfunction is believed to occur as a result of
reduced nitric oxide bioavailability, increased reactive oxygen species (ROS; highly
reactive oxygen ions that can damage cell structures) and/or atherogenesis (formation of
fatty deposits on the inner lining of the arteries) (Ding & Triggle, 2005). With respect to
the former, potential causes of reduced bioavailability include 1) reduced L-arginine
concentrations, 2) the down-regulation of eNOS, 3) impaired eNOS activation, and 4)
increased oxidative stress/ROS-induced nitric oxide degradation (discussed below)
(Faulx et al., 2003).
In addition, hyperglycemia and dyslipidemia cause an increase in protein arginine
N-methyltransferase activity (Nash, 2002). Protein arginine N-methyltransferase is the
enzyme responsible for the formation of assymetrical dimethylarginine (ADMA).
ADMA is an inhibitor of L-arginine (Nash, 2002). With L-arginine deficiency, the
nicotinaminde adenine dinucleotide reacts with oxygen instead of the L-arginine and a
superoxide, instead of nitric oxide, is produced (Hayden & Tyagi, 2002). This form of
dysfunction has the endothelial cell producing less nitric oxide and in turn decreases
vasodilation and blood flow, and increases vasoconstriction and blood pressure (Boger et
cells because superoxides react with transition metals (i.e., iron) to form hydrogen
peroxide and then a hydroxyl radical, or they react with nitric oxide (formed in a separate
cell) to form peroxynitrite (see Figure 11) (Beckman & Koppenol, 1996; Turrens, 2003).
The hydroxyl radical and peroxynitrite are known as (ROS) and they react with nucleic
acids and proteins altering their functions and contributing to endothelial dysfunction
(Beckman & Koppenol, 1996).
Endothelial dysfunction can also be caused by diabetic dyslipidemia itself.
Diabetic dyslipidemia increases the risk of developing atherosclerosis (fatty deposits on
the inner lining of the arteries) by three-fold (Kannel & McGee, 1979). In the diabetic
dyslipidemic condition, readily available and over abundant LDLs are taken up by the
endothelial cells where they are acted upon by ROS and the enzymes sphingomyelinase,
secretory phospholipase and myeloperoxidase to create oxidized LDLs which are
pro-inflammatory lipids that attract certain monocytes (white blood cells) called macrophages
(Rose & Afanasyeva, 2003; Rader & Daugherty, 2008). The macrophages take in
oxidized LDLs through the scavenger receptors CD36 and SR-A to form lipid-laden foam
cells (see Figure 12) (Rader & Daugherty, 2008). The foam cells migrate to the
endothelial wall where they create a pro-inflammatory environment by producing
cytokines that signal intimal (endothelial lining of the blood vessel or lumen)
proliferation and the production of myeloperoxidase, an enzyme that produces ROS,
which leads to more foam cell production and further endothelial damage (as ROS
disrupt nucleic acids and proteins) (Rader & Daugherty, 2008). The foam cells also
lumen and contributes to endothelial dysfunction, hypertension and/or reduced blood
flow (Rader & Daughtery, 2008).
Endothelial cell damage and the resultant dysfunction is thought to be a major
contributor to the development and progression of cardiovascular disease (Ehrman et al.,
2009). The term cardiovascular disease encompasses several disease states that affect the
heart or blood vessels, such as coronary artery disease (including atherosclerosis
(thickening of arterial walls due to fatty deposits), angina and myocardial infarction),
hypertension, PAD (including atherosclerosis), rheumatic heart disease (damage to the
heart muscle and heart valves caused by bacteria), congenital heart disease
(malformations of the heart present at birth) and heart failure (World Health
Organization, 2009b). The first, coronary artery disease is often used interchangeably
with the term cardiovascular disease and/or atherosclerosis, as not only is it the most
prominent form of cardiovascular disease, atherosclerosis predominantly occurs in the
coronary arteries (World Health Organization, 2009b). When the atherosclerosis occurs
in the arteries leading to the brain it is referred to as either carotid artery disease or
cerebrovascular disease, depending on the location of the atherosclerosis, and finally as
PAD when referring to the arteries outside of the heart and brain (American Heart
Association, 2008b). Atherosclerosis is the leading cause of cardiovascular disease
(Canadian Diabetes Association, 2008).
Hypertension
Hypertension, characterized by a sustained elevation in resting BP that is equal to
diabetes (Canadian Diabetes Association, 2008). Systolic BP represents the pressure
acting against the arterial walls as blood is ejected from the heart and its contracting
ventricles, while diastolic BP represents the pressure acting against arterial walls when
the heart's ventricles are relaxing and filling with blood (Powers & Howley, 2009). As
previously discussed, one cause of hypertension in diabetics is the loss of regular kidney
function which regulates BP (Kalant, 1978). As BP is dependent on volume, the
accumulated, excess water re-enters the circulation and increases BP (Kalant, 1978). The
pressure increase also influences the progression of kidney disease because it causes
more force to be exerted on blood vessel walls which contributes to their damage (Kalant,
1978). When the blood vessels of the kidneys are damaged, the kidneys cannot function
properly and their pathology progresses at a faster rate (Kalant, 1978).
Resting BP is also dependent on vascular resistance (resistance to blood flow
provided by blood vessels). In the diabetic condition, increased vasoconstriction is
caused by increased levels of the enzyme protein kinase C due to hyperglycemia (Koya &
King, 1998). An individual with hyperglycemia will still exhibit glucose uptake by cells
using the glucose transporter proteins (Klip & Paquet, 1999), yet it is not sufficient
enough to reduce blood glucose levels. It is, however, sufficient enough to increase
levels of protein kinase C (Koya & King, 1998). Glucose enters the cell and is converted
into dihydroxyacetone phosphate (DHAP) via glycolysis (Koya & King, 1998). DHAP is
acted on by the enzyme glycerol-3-phospate dehydrogenase to form glycerol-3-phosphate
(Koya & King, 1998). Glycerol-3-phophate goes through a series of reactions to form
diacylglycerol (see Figure 13) (Yoshimura, Oshima, & Ogasawara, 2007). After 3-5 days
concentration (Koya & King, 1998). Diacylglycerol activates protein kinase C which is
responsible for increased calcium responsiveness in smooth muscle contraction
(vasoconstriction) (see Figure 14) and increased smooth muscle contraction itself (Koya
& King, 1998).
Another probable cause of increased vascular resistance in the diabetic condition
is smooth muscle cell proliferation due to increased mitogen-activated protein kinase
(MAPK) activation (Bruemmer, 2006). Hyperinsulinemia (in T2D) causes increased
MAPK activity (Bruemmer, 2006). In the healthy condition, insulin binds to the insulin
receptor on the cell membrane and the phophotidylinositol-3 kinase (see Negative
Feedback and Blood Glucose Regulation Mechanisms) pathway is activated (Robinson
& Buse, 2008). In an individual with T2D, the phophotidylinositol-3 kinase pathway is
inhibited and instead the MAPK pathway is activated (see Figure 15) (Bruemmer, 2006).
The insulin binds to the insulin receptor and this action causes the activation of the
enzyme tyrosine kinase which phosphorylates insulin receptor substrate proteins
(Robinson & Buse, 2008). The activated insulin receptor substrate proteins then bind to
the Src homology 2 protein and the two proteins interact with another protein (growth
factor receptor bound protein 2) and all three proteins bind to the Ras guanylnucleotide
exchange factor son of sevenless to create a protein complex (Kusari, Byon,
Bandyopadhyay, Kenner, & Kusari, 1997). The activated protein complex removes
guanosine diphosphate from Ras, after which Ras binds to guanosine triphosphate and
becomes activated (Kusari et al., 1997). Activated Ras activates Raf protein kinase
which activates mitogen-activated protein kinase kinase, after which MAPK is then
proliferation (Bruemmer, 2006). Increased smooth muscle cell mass increases vascular
resistance because more cells are available to induce vasoconstriction (Koya & King,
1998).
The adoption of a healthy lifestyle, including weight loss strategies, sodium
restriction and regular physical activity, is an integral component of hypertension
treatment and management in DM. A decrease of 1 kilogram in body weight has been
proven to decrease mean BP (calculated as [resting diastolic BP + 0.33 x (systolic
BP-diastolic BP)]) by 1 mmHg. Furthermore, reductions in dietary sodium intake to less than
2300 mg per day is associated with systolic BP and diastolic BP reductions of 5 mmHg
and 3 mmHg, respectively. (American Diabetes Association, 2002)
For many individuals, pharmacological therapy is required in addition to lifestyle
modifications to reduce resting BP to values within the target range. Drug therapy for
individuals with DM and hypertension includes a combination of angiotensin converting
enzyme (ACE) inhibitors, beta-blockers, calcium channel blockers and diuretics.
(Canadian Diabetes Association, 2008)
1.1.5 Recommendations for the Treatment of DM
Exercise
Exercise training is a non-pharmacological, non-surgical treatment recommended
for DM (American College of Sports Medicine, 2010). Exercise, and thus the
Exercise is considered aerobic when performed at <70% of maximum heart rate
(Conners, Grymkowski, Kimber, & Reynolds, 1992). Aerobic exercise uses both
carbohydrates and fats as a fuel source (Powers & Howley, 2009), and ATP is created via
the Kreb's cycle (see Figure 3) and the electron transport system (see Figure 4).
In general, anerobic exercise is performed at an intensity of >75% of an
individual's maximum heart rate (Conners et al., 1992), and ATP is produced from
glycolysis (see Figure 2) and the phosphagen energy system (see Figure 16) in the
absence of oxygen (Conners et al., 1992). Although resistance exercise is classified as a
type of anaerobic exercise, it applies a force of resistance against the force of contraction
(Conner et al., 1992), and is, as such, not driven by maximal heart rate. There are three
different types of resistance exercises: concentric (shortening of muscle fibers due to
greater muscle force than resistance force), eccentric (lengthening of muscle fibers due to
greater resistance force than muscle force) and isometric (no change in fiber length due to
the resistance force and muscle force equaling one another) (Heyward, 2006; Hamill &
Knutzen, 2003). Isometric exercise is often distinguished separately from concentric and
eccentric resistance exercise because of its unique resistance force and lack of fiber
length change.
In general, both aerobic and anaerobic exercise training regimens have shown to
improve tissue insulin sensitivity (how well muscle cells respond to insulin) in those with
Improved insulin sensitivity
Although T1D is characterized by insulin inavailability, sensitivity to existing
insulin is increased with chronic, but not acute, exercise exposure in this population. For
example, Jimenez and colleagues (2009) saw no change in pre- to post-exercise insulin
sensitivity in adults with T1D (n=14) who performed 5 sets of 6 repetitions of a
resistance leg exercise at 80% of 1 repetition maximum (Jimenez et al., 2009). In
contrast, 12 weeks of aerobic exercise training (3 times per week for 45 minutes) at
80-75% maximum heart rate intensity increased insulin sensitivity by 25+/- 5% in children
(n=15) with T1D (Landt, Campaigne, James, & Sperling, 1985).
Individuals with T2D have a lower insulin sensitivity than their T1D counterparts
(Weir & Bonner-Weir, 2004) and their reaction to exercise differs as well. The positive
effect of exercise on insulin sensitivity in T2D is noticeable after both acute and chronic
exercise. In a population of T2D (n=9), a single bout of exercise performed for 15
minutes at anaerobic threshold intensity can increase glucose infusion rate (an index of
insulin sensitivity) by 3.2+/-0.8 mg/kg/min (Oguri, Adachi, Ohno, Oshima, &
Kurabayashi, 2009) immediately post-exercise. These findings were further supported by
Winnick and colleagues (2008) who observed increases in whole-body insulin sensitivity
after one week of exercise. Specifically, 18 obese T2D individuals performed 50 minutes
of treadmill aerobic walking (at 70% of maximal oxygen uptake) everyday for 7 days,
and post-training increases in glucose infusion rates of 0.2+/- 0.3 mm/kg/min were noted
The exercise data on GD and insulin sensitivity and resistance are limited and
equivocal. With respect to the effect of acute exercise, a study conducted by
Garcia-Patterson and colleagues (2006) examining 20 non-exercise trained women with GD who
performed a self-paced flat surface walking bout for 1 hour found decreases (0.7+/- 0.9
mM) in 1 hour postprandial blood glucose, when the women served as their own controls
the day prior (Garcia-Patterson et al., 2006). A second study (n=33) comparing women
with GD who exercise trained (30 minutes, 4 days per week, 12 weeks, 70% maximal
oxygen uptake) to those who were sedentary observed no differences in insulin
sensitivity, insulin resistance or blood glucose concentration between the two groups
(Avery, Leon, & Kopher, 1997). The authors did, however, report modest, but not
statistically significant, increases in cardiovascular fitness.
Aerobic and anaerobic (including resistance) exercise not only increases insulin
sensitivity and improves insulin resistance in T1D, T2D and GD, evidence suggests that
individuals with T2D will exhibit improvements in GLUT4-driven glucose regulation
with exercise (Kennedy et al., 1999).
Improved blood glucose regulation in T2D: GLUT4s and their translocation
As previously discussed, glucose transporter proteins (GLUT4s) are needed for
the uptake of glucose by the muscle cells (Klip & Paquet, 1999). GLUT4 translocation
can be insulin-stimulated, but it can also be contraction (or exercise) stimulated (Hardie,
2002). Acute aerobic exercise (one session of cycling at 60-70% maximal oxygen uptake
for 45-60 minutes) performed by adults with T2D elicited a 77% increase in membrane
Exercise-induced increases in GLUT4 have also been noted in individuals with
T2D following resistance exercise training. Holten and colleagues (2004) examined 10
individuals with T2D who served as their own control for a resistance exercise study.
Participants completed 3 different unilateral leg exercises (3 sets, 8-12 repetitions at
70-80% of 3 repetition maximum), 3 times per week for 6 weeks (Holten et al., 2004). After
the intervention, GLUT4 density was increased by approximately 40% in the trained legs
when compared to the untrained (control) legs (Holten et al., 2004). The trained legs also
displayed an increase in thigh circumference (52.5+/-1.5 cm to 54.3+/-1.9 cm) and
muscle fiber diameter (5.4+/-1.7%) (Holten et al., 2004).
The contraction-stimulated GLUT4 translocation mechanism follows a different
pathway than that of the insulin-stimulated GLUT4 translocation (Kruth-Kraczek,
Hirshman, Goodyear, & Windder, 1999). The insulin-stimulated pathway involves the
insulin receptor and protein kinase B, while the contraction-stimulated pathway involves
adenosine monophosphate-activated protein kinase (AMPK) (Robinson & Buse, 2008;
Kruth-Kraczek et al., 1999).
Exercise (aerobic and anaerobic) causes a change in the cellular energy status
recognized by an increase in adenosine monophosphate concentration due to the
breakdown of the fuel adenosine triphosphate (Kruth-Kraczek et al., 1999). The increase
in adenosine monophosphate activates AMPK B which phosphorylates the protein
AS 160, which is responsible for converting the Rab protein into its inactive form of
guanosine diphosphate and inhibiting GLUT4 movement, and dissociates it from GLUT4
located inside the muscle cell (Hardie, 2002). Once dissociated, AS 160 no longer
active form, guanosine triphosphate which causes the translocation GLUT4 to the cell
membrane (see Figure 17) (Klip & Paquet, 1999; Hardie, 2002). Although the activating
mechanisms for GLUT4 translocation differ between insulin-stimulated and
contraction-stimulated situations, both pathways dissociate AS 160 from GLUT4 allowing it to be
transported to the membrane (Hardie, 2002; Klip & Paquet, 1999). The increase in
GLUT4s increases glucose uptake by the muscle cells and this reduces the elevated blood
glucose concentration in T2D reducing the extent of hyperglycemia and its effects
(decreased nitric oxide production and increased ROS production) (Klip & Paquet 1999).
Exercise Recommendations
In light of the above-described benefits of exercise in those with DM, exercise is a
highly recommended treatment option, particularly for those with T2D. The gold
standard exercise prescription guidelines, endorsed by the American College of Sports
Medicine, recommend 20 to 60 minutes (which can be divided into 10 minute bouts for a
total of 150 minutes per week) of dynamic aerobic activity at 50-75% of maximum heart
rate, 3 to 7 times per week, supplemented with light weight training 2 to 4 days per week.
The aerobic activity can include walking, running, swimming or cycling, for example,
and light weight training refers to resistance training focusing on larger muscle groups
with weights ranging between 60-80% of 1 repetition maximum for at least 2 sets of 8-12
repetitions. (American College of Sports Medicine, 2010)
Pharmacological Treatment Options for DM
Those with T1D require exogenous insulin daily to control blood glucose
produced, and can be injected into the body using a syringe (a needle and vial system), an
insulin pen (pre-filled with insulin and dosage-controlled via a dial) or an insulin pump
(delivers short-acting insulin throughout the day using a catheter placed under the skin)
(Canadian Diabetes Association, 2008).
Individuals with T2D can treat or control their decreased insulin sensitivity with
the use of oral medications. Thiazolidinediones and biguanides increase the body's
insulin sensitivity. Sulfonylureas and meglitinides stimulate the pancreas to synthesize
more insulin. These drugs, in turn, help lower blood glucose, and some can be combined
to elicit a greater response, but the risk of side effects increases with their combination
(Canadian Diabetes Association, 2008).
Expectant mothers with GD, when necessary, can be prescribed insulin for
injection without harming the fetus (Canadian Diabetes Association, 2009).
1.2 Peripheral Arterial Disease in DM
1.2.1 Peripheral Arterial Disease (PAD)
As previously discussed, peripheral arterial disease (PAD) is a common
complication of DM and is characterized by structural changes (such as inflammation or
tissue damage) in the blood vessels outside of the heart and brain, and these changes
cause reduced blood flow to the tissues (American Heart Association, 2009b). The most
cramping in the muscles of the lower extremities brought on by walking and relieved by
rest, yet some diabetics are asymptomatic due to their neuropathy-induced loss of
sensation (American Diabetes Association, 2003). PAD affects individuals with DM
mainly in the popliteal and tibial arteries (below the knee) (American Diabetes
Association, 2003). DM-associated hyperglycemia and dyslipidemia are two main causes
of PAD (American Diabetes Association, 2003). PAD is also an underlying cause of
other diabetic conditions such as neuropathy and nephropathy (Kalant, 1978; Vinik et al.,
2008).
1.2.2 Methods of Assessing PAD
There are many ways to measure and assess PAD, including the most widely
employed methods of angiography, ankle-brachial index and duplex ultrasound.
Catheter angiography, also known as conventional angiography, is a minimally
invasive test and the gold standard for PAD assessments (Radiological Society of North
America, 2010; Clifton, 2000). A catheter containing a contrast dye is inserted into an
artery through an incision in the skin after which the artery undergoes an x-ray
(Radiological Society of North America, 2010; Clifton, 2000). Catheter angiography is
the most accurate form of PAD assessment; however, it is associated with several risks
such as infections and kidney damage (Radiological Society of North America, 2010).
Phased-contrast magnetic resonance angiography non-invasively assesses PAD.
Various magnetic fields are applied to the limb or body part in question. Several images
tissues (muscle and bone) leaving only the flowing blood visible on the final image.
Similar to catheter angiography the final image can be used to detect arterial narrowings
and malformations, but unlike the gold standard method, phased-contrast angiography
can also measure blood flow. However, this method of assessment is time consuming
and adversely affected by slight movements made by the individual undergoing the
angiography. (Clifton, 2000)
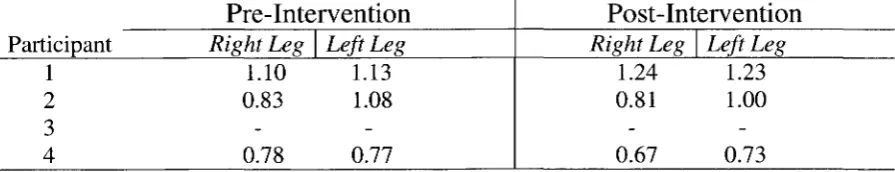
The ankle-brachial index (ABI) is another non-invasive test used to assess PAD,
and involves the measurement of ankle systolic BP (using dorsalis pedis and posterior
tibial arteries) and arm systolic BP (using the brachial artery) to ultimately evaluate the
patency of the arteries of the lower extremities (Bernstein & Fronek, 1982). Specifically,
a ratio (ABI) between the ankle and arm is determined from the measured systolic BPs
(e.g., ankle systolic BP/ brachial artery BP) (Bernstein & Fronek, 1982). For the
calculation, the greater value of the two brachial pressures is used, and both ankle
pressures (on each leg) are used to give a total of 4 ABIs per individual (Bernstein &
Fronek, 1982). A normal, non-diseased lower extremity artery will have an ABI >0.90
while a diseased artery will have an ABI of <0.90 (Carbayo et al., 2007). To further
classify PAD, an ABI of 0.70-0.89 suggests a mild obstruction in the artery, 0.40-0.69
suggests a moderate obstruction, and <0.40 suggests a severe obstruction (American
Diabetes Association, 2004d). The ABI test has been validated against angiographically
confirmed disease (accuracy range: 95-100%) (Bernstein & Fronek, 1982). One
limitation of the ABI is the influence of poorly compressible and calcified vessels. In
such instances, BP measurements cannot be obtained as a result of the arteries' inability
Another limitation is that aortoiliac stenoses (abnormal narrowing of the aorta or iliac
arteries) can reduce BP in the lower extremity (and in turn reduce the ABI) causing the
false belief that the PAD is solely in the lower extremity (American Diabetes
Association, 2004). Even with these limitations, ABI is a highly used, popular and
proven non-invasive method of PAD assessment in clinical settings (American Diabetes
Association, 2004).
Another method of assessing PAD is duplex ultrasound which uses a combination
of two techniques to obtain arterial images and determine the degree of the disease
(Scottish Intercollegiate Guidelines Network, 2006). Images are acquired through both
B-mode ultrasound (using sound frequencies to produce an arterial image) and Doppler
ultrasound (using reflected sound waves to generate an image of blood flow direction and
velocity) and assessed together (Scottish Intercollegiate Guidelines Network, 2006).
B-mode ultrasound provides a visual image of arterial narrowings, while Doppler
ultrasound uses blood flow and velocity to determine the amount (in percent) of
anatomical narrowing (Sensier et al., 1996). Duplex ultrasound has been proven to
92-99% accuracy when compared to angiography (Aly et al., 1998).
In addition to the assessment of PAD itself, the symptoms of the disease can be
evaluated. A common practice is the assessment of intermittent claudication using a
graded-exercise treadmill test (Gardner, Skinner, Cantwell, & Smith, 1999). There are
different protocols for the graded-treadmill test, a popular one of which is the Gardner
protocol (Gardner et al., 1999). Using the Gardner protocol, individuals walk on the
treadmill at a constant 2 mph, beginning at 0% grade, with a 2% increase in grade every 2
16 minutes on the treadmill) (Gardner et al., 1999). During the graded-exercise treadmill
test, the distance at which the individual first notices claudication pain is recorded and
this is referred to as the initial claudication distance (ICD) (Hiatt, Nawaz, Regensteiner,
& Hossack, 1998). The absolute claudication distance (ACD), the distance at which the
individual reaches maximal claudication pain causing the termination of the test, is also
recorded (Hiatt et al., 1998). The graded-exercise treadmill test is used clinically across
all age groups and disease states and has a within-subject variation of 15-25% for the
ICD and 12-13% for the ACD (Hiatt et al., 1998). This test is superior to the previously
popular constant-load treadmill test, where individuals walk at 2 mph at a constant grade
of any value between 0% and 12% for a maximum of 5 minutes, which has a
within-subjects variation of 30% for the ICD and 45% for the ACD (Gardner et al., 1999).
Increases in ICD and ACD with repeated graded-exercise treadmill tests correlate with
improved ambulatory function (Hiatt, Regensteiner, Hargarten, Wolfel, & Brass, 1990).
1.2.3 Treatment recommendations for PAD
The most effective treatment and control methods for PAD are of the surgical
nature, but medications and physical activity can control the prominent risk factors of
PAD (i.e., hypertension and dyslipidemia) and slow or halt the progression of the disease