Catalysis of Nuclear Reactions by Electrons
Matej Lipoglavšek*
Jožef Stefan Institute, Jamova cesta 39, 1000 Ljubljana, Slovenia
Abstract. Electron screening enhances nuclear reaction cross sections at low energies. We studied the nuclear reaction 1H(19F,
αγ)16O in inverse
kinematics in different solid hydrogen targets. Measured resonance strengths differed by up to a factor of 10 in different targets. We also studied the 2H(p,
γ)3He fusion reaction and observed electrons emitted as
reaction products instead of γ rays. In this case electron screening greatly
enhances internal conversion probability.
1 Introduction
The screening of nuclear charges by electrons enhances nuclear reaction cross sections at low energies [1]. The effect is important in astrophysical scenarios, where almost all nuclear reactions happen at low energies and nuclei are not alone in the stellar plasma. The predicted effect was confirmed experimentally, but its measured magnitude was very often way above predictions [2-11]. Although the theory predicts an independence of electron screening on the nuclear surroundings, measurements of the same reactions in different environments gave different magnitudes of electron screening. This called for a new look at the electron screening effect. Our group proposed a new model of electron screening based on the hydrogen molecular ion, where the electron resides primarily between the two protons [11]. We also predicted a dependence of electron screening on the position of hydrogen in the crystal lattice. To test our model we observed 5.6 MeV electrons in the fusion reaction of protons and deuterons [12]. This proves that atomic electrons actively participate in the nuclear reaction and not just merely decrease the Coulomb barrier from an atomic shell.
2 Experiments
To measure the largest electron screening effect we perform nuclear reaction experiments in inverse kinematics. Beams of hydrogen to fluorine ions are accelerated by the 2 MV Tandetron accelerator at Jožef Stefan Institute. We try to use the same hydrogen targets for all experiments. This gives us a unique opportunity to compare electron screening in the same targets for different beams. The targets used are the following. For a standard hydrogen target we use polyimide (Kapton, C22H10N2O5) due to its relative insensitivity to
radiation damage. The second target is titanium hydride pressed from TiH powder into a 1 mm deep hole in a Cu backing which helps to cool the target after heating with the beam.
The third sample is a 250 µm thick graphite foil obtained from Chempur. The fourth target are 250 µm thick palladium foils from Goodfellow, loaded with hydrogen from gas phase. The final target is a tungsten sample, produced by Plansee. The graphite and tungsten samples were implanted with 5 keV hydrogen ions from the ion gun with beam intensity of 0.8 mA/cm2. In the fluorine experiment we also used an amorphous carbon target produced
by plasma discharge in methane gas. This target quickly loses hydrogen upon ion bombardment and was unavailable for other experiments. All targets represent thick hydrogen targets. The Kapton, graphite, amorphous carbon, Pd and TiH targets have uniform hydrogen distribution, while the W target exhibited a surface hydrogen peak and a uniform distribution in the bulk (see below). The beam dose is deduced from the measurement of electric charge deposited inside an electrically insulated target chamber. During the experiment the hydrogen concentration in the sample is controlled by repeatedly measuring at the same beam energy after each measurement at a different energy [11]. The results from the experiment with the fluorine beam are described below. Gamma rays were measured with a Ge detector placed at 135° with respect to the beam direction at a distance of 5.7 cm from the target.
3 Results
The nuclear reaction 1H(19F,
αγ)16O was studied by measuring the yields of the 6129 keV oxygen γ ray around the c.m.s. energy Er=323.4(1) keV resonance [13]. The measured yields are shown in Figs. 1 and 2.
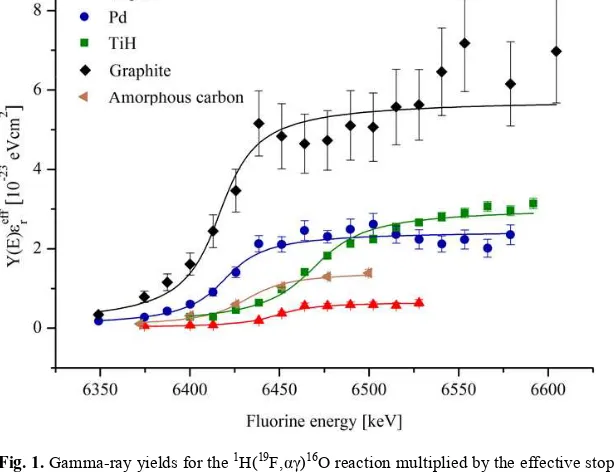
Fig. 1. Gamma-ray yields for the 1H(19F,
αγ)16O reaction multiplied by the effective stopping power as
a function of fluorine beam energy for amorphous carbon, graphite, TiH, Pd and Kapton targets near the resonance energy of 323 keV in c.m.s. (or 6.469 MeV in laboratory system) [14]. The solid lines represent fits with eq. 1. The error bars are roughly proportional to the amount of hydrogen in the target.
The data for Kapton, graphite, amorphous carbon, Pd and TiH targets were fitted with a function describing thick target resonance yields Y [14,15]
2
arctan ,
2 r / 2r 2
E E
Y
λ ωγ
π
π ε
−
⋅
= +
⋅ Γ
(1)
where λ is the de Broglie wavelength of the beam, εr its effective stopping power in the target calculated with the SRIM code [16] and Γ the resonance width. From the fits we deduced resonance strengthsωγand for the first time observed a dependence of resonance strength on the type of hydrogen target. Moreover, the deduced differences are not small, the resonance strengths in graphite and Kapton differ by about a factor of 10.
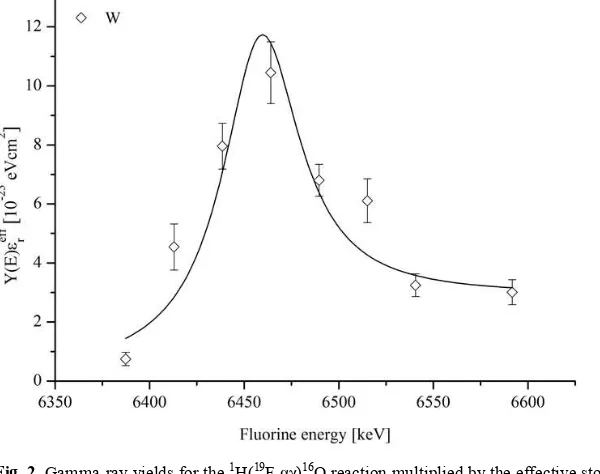
Fig. 2. Gamma-ray yields for the 1H(19F,
αγ)16O reaction multiplied by the effective stopping power as
a function of fluorine beam energy for the tungsten target near the resonance energy of 323 keV in c.m.s. [14]. The solid line represents a fit with a combination of thin and thick target yields.
The data for the W target were fitted with a combination of thin and thick target yield curve with an assumption that the resonance strengths are the same on the surface and in the bulk. The surface peak is not due to impurities on the surface, but rather due to a larger availability of hydrogen trapping sites on the surface than in the bulk. Some fitted parameters are listed in Table 1 for each target. In addition, Table 1 lists the difference between the measured resonance energy in the normal kinematics reaction [13] and our inverse kinematics measurements. Electron screening potentials were deduced from enhancement factor
2 ( )
2 ( )
( )
s s E Ue,
E
b b
e
f E
e
πηπη
σ
ωγ
σ
ωγ
− +
−
=
=
=
(2)The data for Kapton, graphite, amorphous carbon, Pd and TiH targets were fitted with a function describing thick target resonance yields Y [14,15]
2
arctan ,
2 r / 2r 2
E E
Y
λ ωγ
π
π ε
−
⋅
= +
⋅ Γ
(1)
where λ is the de Broglie wavelength of the beam, εr its effective stopping power in the target calculated with the SRIM code [16] and Γ the resonance width. From the fits we deduced resonance strengthsωγand for the first time observed a dependence of resonance strength on the type of hydrogen target. Moreover, the deduced differences are not small, the resonance strengths in graphite and Kapton differ by about a factor of 10.
Fig. 2. Gamma-ray yields for the 1H(19F,
αγ)16O reaction multiplied by the effective stopping power as
a function of fluorine beam energy for the tungsten target near the resonance energy of 323 keV in c.m.s. [14]. The solid line represents a fit with a combination of thin and thick target yields.
The data for the W target were fitted with a combination of thin and thick target yield curve with an assumption that the resonance strengths are the same on the surface and in the bulk. The surface peak is not due to impurities on the surface, but rather due to a larger availability of hydrogen trapping sites on the surface than in the bulk. Some fitted parameters are listed in Table 1 for each target. In addition, Table 1 lists the difference between the measured resonance energy in the normal kinematics reaction [13] and our inverse kinematics measurements. Electron screening potentials were deduced from enhancement factor
2 ( )
2 ( )
( )
s s E Ue,
E
b b
e
f E
e
πηπη
σ
ωγ
σ
ωγ
− +
−
=
=
=
(2)assuming that ωγb is the resonance strength measured for Kapton. This means that our results represent only lower limits on ωγs.
Table 1. Electron screening potentials Ue, resonance energies Er and resonance energy differences Δ
for targets studied in the fluorine reaction.
Target Ue[keV] Er[keV] Δ[keV]
Kapton / 322.4±0.2 1.0±0.2
Amorphous
Carbon 36±6 321.6±0.2 1.8±0.2
TiH 73±6 323.4±0.1 0.0±0.1
Pd 63±6 321.0±0.4 2.4±0.4
W 74±15 322.9±0.3 0.5±0.3
Graphite 115±8 320.8±0.7 2.6±0.7
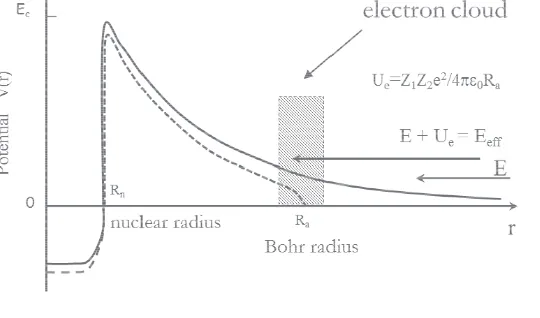
Fig. 3. A schematic picture of static electron screening with electrons on a shell at Bohr radius. A change of nuclear binding energy is indicated.
First of all one notices that the resonance energy shifts have no connection to the measured electron screening potentials, meaning that the two phenomena have a different origin, despite the fact that they have been previously treated together [17]. Secondly, all resonance shifts are towards lower beam energies compared to the normal kinematics reaction. If the resonance shifts were due to impurities on target surfaces, one would expect shifts to higher energies. This means that the shifts are most likely real and not due to some experimental difficulty. All resonance shifts are compatible with the Ue=2.19 keV
maximum prediction for the electron screening potential in the adiabatic limit. It is, therefore, possible that atomic electrons lower the binding energy of the proton captured in 20Ne. This can be inferred from the static electron screening picture of ref. [1], since the Coulomb potential of the electrons has to extend inside the nucleus (see Fig. 3). To confirm this explanation one would need to calculate the equilibrium electron density at the place of the proton in the solid target, where the reaction occurs. However, this is not straight
forward, since proton positions are not precisely known, especially in implanted and radiation damaged targets.
Energy [keV]
3000 4000 5000 6000
N
um
ber
of
C
ount
s
0 50 100 150 200 250 300
Energy [keV]
3000 4000 5000 6000
Num
ber
of
C
ount
s
0 10 20 30 40
Energy [keV]
3000 4000 5000 6000
N
um
ber
of
C
ount
s
0 1 2 3 4 5
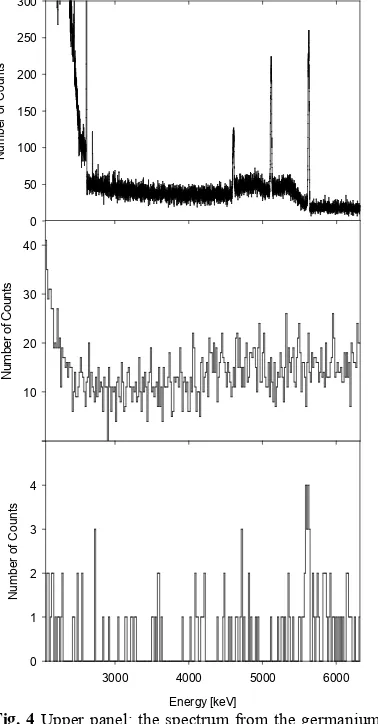
Fig. 4 Upper panel: the spectrum from the germanium detector. The three distinct peaks are the full absorption, single escape and double escape γ rays from the 2H(p,γ)3He reaction. Natural background γ radiation can be seen below the 2615 keV 208Pb peak. Middle panel: the spectrum of the CsI(Tl)
detector in the same energy range. Bottom panel: the spectrum of cumulative energy deposited in the CsI(Tl) and silicon detectors, when the two signals arrived within 40 ns of each other. The only statistically significant peak in the bottom spectrum is the one at 5.6 MeV.
4 Internal Conversion with Electron Screening
To test our new model of electron screening based on hydrogen molecular ion, we studied electron screening in the fusion reaction of protons and deuterons. Normally at high energies this reaction produces a 3He nucleus and a
assuming that ωγb is the resonance strength measured for Kapton. This means that our results represent only lower limits on ωγs.
Table 1. Electron screening potentials Ue, resonance energies Er and resonance energy differences Δ
for targets studied in the fluorine reaction.
Target Ue[keV] Er[keV] Δ[keV]
Kapton / 322.4±0.2 1.0±0.2
Amorphous
Carbon 36±6 321.6±0.2 1.8±0.2
TiH 73±6 323.4±0.1 0.0±0.1
Pd 63±6 321.0±0.4 2.4±0.4
W 74±15 322.9±0.3 0.5±0.3
Graphite 115±8 320.8±0.7 2.6±0.7
Fig. 3. A schematic picture of static electron screening with electrons on a shell at Bohr radius. A change of nuclear binding energy is indicated.
First of all one notices that the resonance energy shifts have no connection to the measured electron screening potentials, meaning that the two phenomena have a different origin, despite the fact that they have been previously treated together [17]. Secondly, all resonance shifts are towards lower beam energies compared to the normal kinematics reaction. If the resonance shifts were due to impurities on target surfaces, one would expect shifts to higher energies. This means that the shifts are most likely real and not due to some experimental difficulty. All resonance shifts are compatible with the Ue=2.19 keV
maximum prediction for the electron screening potential in the adiabatic limit. It is, therefore, possible that atomic electrons lower the binding energy of the proton captured in 20Ne. This can be inferred from the static electron screening picture of ref. [1], since the Coulomb potential of the electrons has to extend inside the nucleus (see Fig. 3). To confirm this explanation one would need to calculate the equilibrium electron density at the place of the proton in the solid target, where the reaction occurs. However, this is not straight
forward, since proton positions are not precisely known, especially in implanted and radiation damaged targets.
Energy [keV]
3000 4000 5000 6000
N
um
ber
of
C
ount
s
0 50 100 150 200 250 300
Energy [keV]
3000 4000 5000 6000
Num
ber
of
C
ount
s
0 10 20 30 40
Energy [keV]
3000 4000 5000 6000
N
um
ber
of
C
ount
s
0 1 2 3 4 5
Fig. 4 Upper panel: the spectrum from the germanium detector. The three distinct peaks are the full absorption, single escape and double escape γ rays from the 2H(p,γ)3He reaction. Natural background γ radiation can be seen below the 2615 keV 208Pb peak. Middle panel: the spectrum of the CsI(Tl)
detector in the same energy range. Bottom panel: the spectrum of cumulative energy deposited in the CsI(Tl) and silicon detectors, when the two signals arrived within 40 ns of each other. The only statistically significant peak in the bottom spectrum is the one at 5.6 MeV.
4 Internal Conversion with Electron Screening
To test our new model of electron screening based on hydrogen molecular ion, we studied electron screening in the fusion reaction of protons and deuterons. Normally at high energies this reaction produces a 3He nucleus and a
forces an electron closer to the nucleus. The atomic electron then catalyses the nuclear reaction and is ejected with a high energy.
We performed another experiment with the 2 MV Tandetron accelerator, which produced protons with the energy of 260 keV, the minimum achievable energy. Deuterons were implanted into graphite targets in the same way as protons in the above described fluorine experiment. The detector setup consisted of a germanium detector for γ-ray detection placed 57 mm from the target at an angle of 135º with respect to the beam direction. The electrons were separated from γ rays using the ∆E-E technique. For the ∆E detector we used a 0.5 mm thick silicon detector placed 36 mm from the target at an angle of 135º with respect to the beam direction. Behind it, 53 mm from the target, we placed a 10 mm thick CsI(Tl) scintillation detector. Further experimental details are given in ref. [12]. The main experimental result is shown in Fig. 4. The upper panel of the figure shows a part of the γ-ray spectrum from the germanium detector. The three distinct peaks clearly seen are the full absorption (5626 keV), single escape (5626–511 keV) and double escape (5626–1022 keV) peaks resulting from the 2H(p,
γ)3He reaction. The full absorption energy of 5626 keV is the sum of the reaction Q value (5493 keV) and beam energy in the center-of-mass system, together with the Doppler correction. The middle panel of Fig. 4 shows the spectrum from the CsI(Tl) detector in the same energy range. Due to the low detection efficiency, no γ ray lines can be seen in the spectrum. The only feature of this spectrum is that the continuous background is lower between about 2.5 and 4 MeV than at higher energy. This is due to the presence of high-energy cosmic muon signals. However, when we demanded simultaneous detection of signals from the CsI(Tl) and silicon detectors, a line became visible in the spectrum. This is demonstrated in the bottom panel of Fig. 4, which shows a cumulative spectrum of the sum of measured energies in the silicon and CsI(Tl) detectors. Only coincidence events where the two signals arrived within 40 ns of each other were taken into account. In addition, the energy detected in the silicon detector was required to lie between 120 and 240 keV, corresponding to the energy deposition of 5.6 MeV electrons in a 0.5 mm thick layer of silicon. The bottom spectrum also shows a peak at about 5.6 MeV. We interpreted this peak as due to conversion electrons emitted after the fusion of protons and deuterons.
References
1. H. J. Assenbaum, K. Langanke and C. Rolfs, Z. Phys. A 327 (1987) 461. 2. L. Lamia et al., Astron. Astrophys. 541 (2012) A158.
3. A. Huke et al.,Phys.Rev. C 78, (2008) 015803. 4. K. Czerski et al., J. Phys. G 35 (2008) 014012.
5. F. Raiola et al.,Eur.Phys.J. A 19 (2004) 283; F. Raiola et al., Phys Lett B 547 (2002) 193. 6. J. Kasagi, Prog. Theor. Phys. Suppl. 154 (2004) 365.
7. J. Cruz et al., Phys. Lett. B 624, (2005) 181; J. Cruz et al., J. Phys. G 35 (2008) 014004. 8. F. Raiola et al., J. Phys. G 31 (2005) 1141.
9. M. Lipoglavsek et al., Eur. Phys. J. A 44 (2010) 71. 10. J. Vesic et al., Eur. Phys. J. A 50 (2014) 153. 11. A. Cvetinovic et al., Phys. Rev. C 92 (2015) 065801. 12. M. Lipoglavsek et al., Phys. Lett. B 773 (2017) 553. 13. K. Spyrou et al., Eur. Phys. J. A 7 (2000) 79.
14. A. Cvetinović, PhD Thesis, University of Ljubljana (2015), unpublished.
15. C. Iliadis, Nuclear Physics of Stars, Wiley, Hoboken, NJ, USA (2007).
16. J.F. Ziegler et al., The Stopping and Range of Ions in Matter (Lulu Press Co., Morrisville, NC, 2008); www.srim.org.