Learning Choices:
A Map for the Future
By Kitty te Riele
Learning Choices: A Map for the Future
Report to Dusseldorp Skills Forum
by Associate Professor Kitty te Riele
Victoria Institute for Education, Diversity and Lifelong Learning Victoria University, Melbourne
April 2012
Table of Contents
Executive Summary 3
1. Introduction 5
1.1 Purpose of the report 5
1.2 Terminology 6
2. Policy 8
2.1 National Policy 8
2.2 State and Territory Policy 9
3. Findings 16
3.1 Numbers 16
3.2 Outcomes 19
3.3 Structures 25
3.4 Mission 30
3.5 Curriculum 33
3.6 Staffing 36
4. Recommendations 39
References 42
Appendices
1. List of program documentation 46
2. Annotated bibliography of major research reports 50
Executive Summary
For over 20 years the Dusseldorp Skills Forum has focused on innovative educational pathways to engage young people in learning. This report has been commissioned to provide an overview of the field of alternative education provision in Australia, the multitude of inclusive and flexible learning programs and initiatives that DSF refers to as Learning Choices. The report draws together the data and key findings of available research nationally, and identifies the recognised gaps in knowledge that can inform a future research agenda.
The report acknowledges that terminology is contentious, but has chosen to use the terms Learning Choices programs, disenfranchised youth and conventional schooling. As background, an overview of relevant policy in relation to raising educational attainment and provision of Learning Choices programs is provided. Despite a shared national policy agenda, this demonstrates some differences in policy between the states and territories.
The core of the report is based on analysis of the data collected in the national survey of Learning Choices programs (administered by Dusseldorp Skills Forum during 2011), evaluation and annual reports from individual programs, and relevant research reports. The key findings include:
• Numbers: the Learning Choices National Scan captured over 400 programs in 1200 locations nationally, working with 33,000 young people during 2011. The actual number of Learning Choices programs, and of young people attending these programs, is higher since the National Scan has not captured all programs in Australia.
• Outcomes: program reports provide data in relation to attendance, academic achievement, destinations, non-academic achievement and stakeholder satisfaction. Overall programs outline improvements for these types of outcomes based on young people’s previous achievements and experiences, if not relative to state averages. However, the quality of outcomes data varies. Research points to limitations on the ability of programs to achieve positive outcomes as well as limitations related to the measurement of outcomes.
• Structures: the vast majority of Learning Choices programs are relatively small, which research suggests enables successful provision. A small majority are full time and a small majority run over a full year or longer. Results from the Learning Choices National Scan show almost all programs are part of a local, state or national network. It is likely non-networked programs are underrepresented in the Scan. Learning Choices programs are organised in a variety of different ways, especially in terms of their relation to conventional schooling. Cross-sectoral and interagency collaborations are considered valuable in the research reports. Funding problems are reported to be a barrier to the quality and sustainability of programs both in program and in research reports.
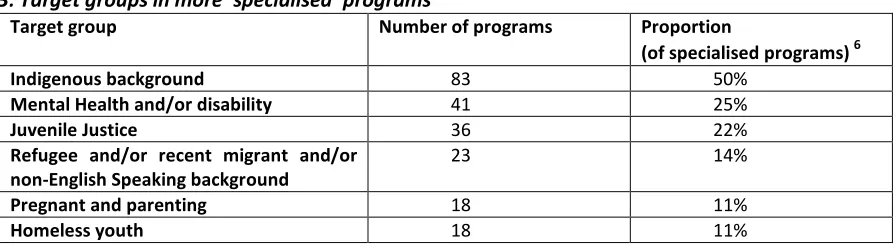
• Mission: about 60% of programs in the Learning Choices National Scan target a broad range of young people, while about 40% have a more specialised purpose. The majority of program reports demonstrate an aim to adapt their approach to meet student needs, rather than aiming to change the young person him or herself. Nevertheless, the research warns against the danger of a deficit approach in the aims or mission of a school.
implementation varies. The vast majority of programs offer a wide range of activities, including enabling activities, co-curricular activities and activities that connect with the local community. The research mainly comments on enabling activities, noting these are important but not sufficient.
• Staffing: Learning Choices programs have relatively high levels of staffing with high staff-student ratios. Research provides evidence this contributes to program success partly because it enables positive relationships between staff and students that are seen as essential. Many programs employ a variety of staff, not just teachers but also youth workers and counsellors. Staff are recognised as being very committed and hard-working. The research suggests professional development needs to be a priority, to support collaboration between a range of staff as well as supporting the high workload.
1. Introduction
1.1
Purpose of the report
Dusseldorp Skills Forum has commissioned this report to provide a comprehensive picture of the Learning Choices sector, to pull together the existing research and evidence, summarise the data and findings that are available, and identify the gaps in knowledge.
A wide variety of ‘alternative’ (Learning Choices) educational programs have been developed in Australia aimed at (re-)engaging young people with education. Some of these grew out of interest in progressive and democratic approaches to education while others responded to policy pressures to enable more young people to complete school. However, alternative education in Australia is fragmented both as a sector of educational practice and as a field of research. This means we have only limited knowledge about the range of programs that exist.
What we do know is that Learning Choices programs offer vital pathways to enable young people to remain in school or to return to complete their education. There is clear evidence for the need such Learning Choices programs address. Retention to Year 12 has stabilised at around 75% since the mid-1990s (ABS, 2010). The retention rate for Indigenous young people continues to lag well behind at only 45% (Purdie and Buckley, 2010). The OECD provides comparative data for what it calls upper secondary attainment. The secondary school drop out rate is given as 14.7% for Australia compared to 12.9% for the OECD and 11% for the European Union (OECD, 2009). More than 16% of 15-19 year olds in Australia are not fully engaged and nearly a quarter of 20 to 24 year-olds: that is not in full time education or full time work (FYA, 2010, p.5; p.22). The concern grows when considering those 15-24 year olds who completed Year 10 or below: almost 57% are not fully engaged in the year after leaving school (FYA, 2010, p.21). Early school leaving has been linked to increased likelihood of unemployment, underemployment, crime and ill-health (AIG and DSF, 2007; BCA, 2003; FYA, 2010).
The policy response has been to negotiate a national agreement on youth attainment and transitions: the National Partnership on Youth Attainment and Transitions. As part of this, the Australian Federal, State and Territory governments agreed to a target to raise the Year 12 (or equivalent) attainment rate to 90% by 2015 (CoAG, 2009, p.7). Achieving this target will require many young people who traditionally have left formal education ‘early’, for whatever reason, to remain in or return to education. Learning Choices programs play an important role in enabling these young people to attain Year 12 or equivalent qualifications and thereby assist governments to meet their target. Knowledge about the contribution Learning Choices programs make to engaging young people with education and helping them attain credentials is imperative.
For the past decade Dusseldorp Skills Forum has built connections among Learning Choices programs through its Learning Choices expos in 2004 and 2006 and its Learning Choices website: www.learningchoices.org.au. In 2011, Dusseldorp Skills Forum further developed this by conducting a national survey of Learning Choices programs and initiatives. The ‘Learning Choices National Scan’ used the definition of “those programs/schools that cater for young people at risk of not completing their education”. More than 400 individual entries were made by the end of the survey period. Although inevitably not all relevant programs are included, this is the most comprehensive database of Learning Choices programs currently available.
1.2
Terminology
A variety of terms are used in program and research reports in this field – and these terms are subject to some controversy and disagreement (eg. see Connor, 2006; De Jong, 2006; Mills and McGregor, 2010). Related to this, definitions of the sector are complex. As argued in the US context by Aron and Zweig (2003, pp.20-21):
There is no commonly-accepted, or commonly-understood, definition of what constitutes “alternative education”. In part this reflects the newness of the field (at least as an area that is attracting widespread and mainstream interest), the variety of environments and contexts in which alternative education programming has evolved, and the many sub-groups of vulnerable youth who might benefit from some type of alternative education, broadly defined.
Any choice of terms is subject to critique, but in the end a choice must be made, in order to be able to write about these programs. Recognising these limitations this report uses the following terms:
• Learning Choices Programs • Disenfranchised youth • Conventional schooling
Learning Choices Programs
Terms used in reports by and about programs include alternative education, second chance education, re-engagement programs, flexi schools or flexible learning options, community-based programs, and non-traditional or unconventional programs. A criticism of some of these terms is that they can be seen to reinforce the status of such programs as on the margin of the education system. Dusseldorp Skills Forum therefore uses ‘Learning Choices’ as a more positive term. While in reality, for many young people these programs are less an active choice than a last chance (see Spierings, 2003), the experience of alternative programs demonstrates that with proper support such programs can indeed become schools of choice. Moreover, the term Learning Choices indicates that education systems need to provide a range of suitable choices to all young people. Learning Choices programs are often characterised by a shared philosophy of providing enfranchising socially inclusive educational pathways for young people who, for complex reasons, are outside conventional education.
Mills and McGregor (2010) found in their Queensland study that some programs wish to be named and legitimised as schools while others strongly objected to that label. Even the term ’program’ has been criticised, because this may imply a lack of permanency - allowing governments to re-allocate funding from one program to another in ways which would not be accepted for schools. Nevertheless, the latter concern is not easily solved through a change in terminology.
Disenfranchised youth
phrase such as “young people who have been disenfranchised from education and learning” can counter this, but is too unwieldy to use repeatedly. The report therefore uses ‘disenfranchised youth’ as a shorthand.
Conventional schooling
2. Policy
Before discussing the findings about Learning Choices programs, it is useful to gain an overview of relevant policy in Australia. In the past few years federal, state and territory governments have changed the requirements around compulsory schooling and participation for young people. In relation to this, they have also established policies relating to the provision of alternative (Learning Choices) educational pathways. These policies impact on the practices of Learning Choices programs and also increase the significance of such programs for attaining policy targets and meeting the needs of disenfranchised young people.
2.1 National Policy
The National Partnership on Youth Attainment and Transitions was negotiated between the Australian Federal, State and Territory governments through the Council of Australian Governments (CoAG) in 2009. As part of this, all governments agreed to a target to raise the Year 12 (or equivalent) attainment rate from 83.5% in 2009 to 90% by 2015 (CoAG, 2009, p.7)1. The relevant ‘performance benchmark’ (CoAG, 2009, p.14) clarifies the 90% target as “the proportion of young people aged 20-24 who have attained Year 12 or a Certificate II or above”. Year 12 leads to the standard senior secondary certificate. Certificate II is a vocational qualification, predominantly provided by state-run Technical and Further Education (TAFE) Colleges and some private ‘registered training organisations’.
To achieve this major new target, three related policies have been agreed to:
1. A new minimum requirement for young people to complete junior secondary school (Year 10, usually at age 15 or 16). The new agreement involves a shift from a simple age-based requirement to a combination of attainment and age.
2. A ‘learn or earn’ policy, which requires young people to be in full-time schooling, recognised training or paid employment (or a mix of these) until they turn 17.
3. Restrictions on access to welfare benefits for young people under age 21, if they have not yet attained a Year 12 or equivalent qualification.
It is worth noting that although the second policy above is for a ‘participation’ requirement, the common public impression is that it is now compulsory to stay in school until age 17. This is especially evident in New South Wales, where the state policy refers to ‘the new school leaving age’ (NSW DET, 2009), but also applies to the other states and territories.
The federal government refers to this set of policies as a Compact with young Australians. In return for the Year 10 completion requirement, ‘learn or earn’ participation requirement and welfare benefit restrictions outlined above, the federal government pledges “an entitlement to an education or training place” (DEEWR, 2011). In practice, this means is that the Compact promises young people a government-subsidised study or training place as long as a place is available and subject to admission requirements.
1 The 2009 attainment rate is higher (at 83.5%) than the more commonly used retention rate (76%). There are two reasons for this: it is
For the majority of young people who already complete Year 12 or an equivalent (almost 84%) this may not matter very much. The remaining minority of young people who traditionally have left formal education ‘early’, for whatever reason, will put the CoAG target and associated policies to the test. For these young people, Learning Choices programs are likely to play an important role.
This has been recognised through the Youth Connections program funded as part of the CoAG agreement. This program is “available to eligible young people who are at risk of disengaging, or already disengaged from education, and/or family and the community” (DEEWR, 2010, p.11) and provided regionally by organisations who were awarded the tender by DEEWR. One of the key strategies is that:
Youth Connections Providers must ensure that at risk young people have access to education or training through an alternative learning facility. This should be through an appropriate facility that already exists in the region or through a facility established by the Provider. Where no appropriate alternative learning facility exists, Providers must establish a facility. (DEEWR, 2010, p.12).
Youth Connections therefore is a vital part of the Learning Choices landscape. Learning Choices programs may be offered by Youth Connections providers or may work closely with the Youth Connections provider in their region.
In addition to Youth Connections, the National Partnership on Youth Attainment and Transitions has also set up School Business Community Partnership Brokers, referred to as Partnership Brokers in short. These aim to foster a strategic, whole of community approach by building partnerships between and among schools, business and industry, parents and families and community groups to support student engagement and improve education and transition outcomes. Learning Choices programs are key stakeholders that Partnership Brokers would be expected to work with. One specific initiative is that some Partnership Brokers have developed service directories that include Learning Choices programs as part of establishing local networks.
Preceding the CoAG policies and of ongoing relevance for supporting Learning Choices programs is the Schools Assistance (Learning Together — Achievement Through Choice and Opportunity) Act 2004 (Australian Government, 2011). This legislation allocates targeted funding to special schools and special assistance schools. Special Schools provide special programs or special activities for students with disabilities. Special Assistance Schools primarily catering for students with social, emotional or behavioural difficulties. The latter is of most relevance to Learning Choices programs. State and Territory Education ministers must recognise a non-government Learning Choices program as a special assistance school, giving them access to this support. Once recognised, the Learning Choices program receives maximum SES funding (70 per cent of the relevant Average Government School Recurrent Costs amount) without regard to an SES score (DEEWR, 2012).
2.2 State and Territory Policy
ACT Snapshot
• A young person under age 17 who has not yet completed Year 10: For youth who indicate an intention to leave, responsibility rests with schools to complete a ‘High School student Re-engagement/transition checklist’ and to assist the young person with the transition to another school, college or approved education provider. Approved education providers are Registered Training Organisations that enable a young person to complete year 10 or 12 or undertake a vocational education and training course.
• A young person under age 17 who has completed Year 10: For this group the default expectation is to remain in education, however, the young person or their parent may apply for an Approval Statement (to undertake work related training, join the workforce or a combination of work /training/education) or even an Exemption Certificate for full or partial exemption from the participation requirement.
The ACT Youth Commitment requires all agencies that serve young people to the age of 17 to commit to ensuring that no young person is lost from education, training or employment (ACT DET, 2011). The Re-engaging Youth Leadership Group within the Education and Training Directorate (ETD) is responsible for alternative pathways. For example, the Tuggeranong Re-engaging Youth Network Board (RYNB) reports to this group, and has a key aim “to identify and communicate current pathways for the re- engagement of young people and future pathway opportunities” (ACT Government, 2011c).
NSW Snapshot
•
A young person under age 17 who has not yet completed Year 10: Leaving school is a collaborative process between the student, the parent/caregiver, the school and the local TAFE whereby it is determined if it is in the student’s best interest to transfer to TAFE for a Year 10 equivalent program. If all parties agree, then an approval form is completed by the school principal and the TAFE Institute director. It is also possible for the young person to take up an apprenticeship (or traineeship). This requires the principal to issue a Certificate of Exemption from Enrolment (NSW DET, 2009).• A young person under age 17 who has completed Year 10: The school principal needs to ensure there are appropriate systems and procedures in place for supporting students in deciding which participation pathway to follow if they decide to leave school. Students who choose full-time work may be asked to provide a letter from their employer to the principal that confirms their employment (NSW DET, 2009).
NT Snapshot
• A young person under age 17 who has not yet completed Year 10: In the Northern Territory, there is no clear procedure for students under the age of 17 who wish to leave school before completing Year 10, except obtaining approval to provide home education.
• A young person under age 17 who has completed Year 10: After completing Year 10, young people must complete a Notification of Arrangements form (NT DET, 2011a). The responsibility lies with the parent/guardian to ensure the form is completed and sent to the school or local Division. They need to get the training provider or employer to complete their details and indicate the hours per week the young person will be engaged in work or training. The Northern Territory also offers a ‘Beyond School Guarantee Referral Service’ for young people who need “assistance with pathways to employment, education or training choices in the first two years after leaving school” (NT DET, 2011b). Providers of approved training programs and employers are expected to ensure the young person has completed Year 10 before accepting them for training or employment.
Supports for Learning Choices related initiatives in the Northern Territory include:
• Personal Learning Plan as part of the Northern Territory Certificate of Education and Training (NTCET) to assists students in planning for their future (NT Office of Youth Affairs, 2010).
• The Alice Springs Youth Hub, which includes “an alternative education program for young people who have difficulty engaging in school” (NT Government, 2011) provided by the Edmund Rice Education Australia’s national Youth+ initiative.
• Regional Youth Education Coordination Project that focuses on disengaged youth in 13 remote communities in Central Australia (NT Office of Youth Affairs, 2010).
• Training for Remote Youth provides structured training and learning experiences that prepares youth for employment in the community or re-engages them in further learning (NT Office of Youth Affairs, 2010). • The Northern Territory Open Education Centre (NTOEC) may act as a ‘de facto’ Learning Choices
program for some students (NTOEC, 2011).
• The Indigenous Response Program (NT DET, 2011c) provides access to Vocational Education and Training (VET) that meets the specific needs of Indigenous clients and is delivered on site in communities. This is not an alternative to meet the participation requirements, as it is offered only to Indigenous people who are at least 17 years of age.
QLD Snapshot
• A young person under 16, with or without Year 10: Queensland refers to a compulsory school age until the young person turns 16 or completes Year 10, whichever comes first. It appears that exemptions and Learning Choice Options are not available to youth under 16 years, who must remain in school during the compulsory school age. In Queensland, the Senior Phase Education and Training Reforms for the Future (ETRF) preceded the CoAG agreement by several years and as a result there are some differences with other states.
pathways (Education Queensland, 2011b). The Principal is required to open a learning account for students with the Queensland Studies Authority so that a young person can work towards a Certificate of Education if he/she wants to. The compulsory participation age ends when the young person gains a Senior Certificate, Certificate III or Certificate IV; or has participated in eligible options for 2 years; or turns 17 (Education Queensland, 2007, 2011a)
In relation to recognising Learning Choices programs as special assistance schools, the Queensland government uses these criteria for an accredited non-state school (Education Queensland, 2010):
• has been established specifically and solely for the purpose of catering for young people who are not engaged in education, VET or work;
• has facilities, staffing structures and operational models that support education services for young people to re-engage in sustainable educational pathways;
• enrols only students who are not engaged in education, VET or work;
• enrols students mainly through a referral process (e.g. other schools, juvenile justice system, child protection agency, community agencies, etc);
• has a flexible and specific educational program designed to re-engage and maintain students in an accredited education pathway;
• has active links with community agencies and educational providers which assist ’at risk’ youth; • does not charge tuition fees.
Learning Choices programs funded by the government to support young people who are at risk of disengaging or have disengaged include (Education Queensland, 2011b):
• Access to Pathways • Flexible Learning Services • Youth Support Coordinators
• the Queensland Community Mentoring Program • Positive Learning Centres
• Get Set for Work
SA Snapshot
• A young person under 16, with or without Year 10: In South Australia, the compulsory school age is until age 16. The parent/guardian of a young person under age 16 can complete a request for ‘Exemption from school enrolment/attendance and education enrolment/participation’ that the school can approve (SA DECD, 2011a, b).
In relation to Learning Choices programs, in 2005 South Australia set up Innovative Community Action Networks (ICANs) which from 2007 onwards also included Flexible Learning Options (FLO). This is the most systematic, state-wide approach to Learning Choices provision in Australia so far. ICANs are supported at state level but operate locally through a management committee that “collaborates to develop local solutions to meet the particular needs of identified disengaged young people in their region” (SA DECS, 2011, p.4). Flexible Learning Options is an enrolment strategy whereby the activities undertaken by the young person may include “part-time schooling; learning at an independent centre located off a school campus; a TAFE course, a course provided by a non-government organisation and structured workplace learning” (SA DECS, 2011, p.4). Responsibility for students remains with the local government school, even when they leave to attend FLO activities elsewhere, but practical support for the young person is provided through a case manager.
TAS Snapshot
• A young person under 16, with or without Year 10: In Tasmania, all young people are required to be enrolled in a school or home-educated until the end of the year in which they turn 16 with or without completing Year 10 (Department of Education Tasmania, 2011a). Parents can apply for ‘dispensation’ to the Secretary of the Department of Education through their local school for medical reasons.
• A young person between 16 -17, with or without Year 10: For Year 10 students the responsibility lies with the school principal who must lodge a participation record with the Tasmanian Qualifications Authority (TQA) identifying the student’s intended destination for the following year. Leading up to this, government schools use a pathway planning process for each student, supported by Pathway Planning Officers. However, the responsibility for ensuring the plan is implemented lies with the parent/guardian (Department of Education Tasmania, 2011b, c).
In terms of Learning Choices programs, Innovative Flexible Education Grants are used to provide initiatives that support flexible learning for secondary students. Grants are made to partnerships of non-government organisations with government schools for three years “to support new ideas worth exploring or existing programs which could provide evidence to show they work” (Department of Education Tasmania, 2011d). The consultation paper for the Agenda for Children and Young People (Tasmania DPC, 2010) proposes to examine the concept of extended schools, and to “develop an understanding that education can occur in a range of settings and through a variety of delivery mechanisms for young people who are excluded or absenting themselves from school”.
VIC Snapshot
• A young person under age 17 who has not yet completed Year 10: An exemption authorised by the Regional Director is required. This is done through completing a ‘School Exit Form’ (DEECD, 2011a, b). Permission may be granted for undertaking an apprenticeship or to complete Year 10 or equivalent in a non-school setting. These young people should also have a formal exit interview with a careers practitioner and complete the Managed Individual Pathways (MIPs) information and individual Career Action Plans (pathway plans) documentation.
In relation to Learning Choices programs, the Victorian government has been working towards a policy framework that is intended to provide a strengthened, consistent and coordinated approach (DEECD, 2010). Four tiers of flexible learning options have been proposed (KPMG, 2009):
1. Differentiated provision of education (within mainstream schools) 2. Targeted initiatives (for prevention of disengagement)
3. Flexible learning options within school settings
4. Flexible learning options in separate or off-site settings
This report is the starting point for ongoing policy development that has not yet been resolved. A DEECD-Victorian Community Sector Roundtable was held in 2011 on the topic of ‘disengaged youth’. More recently, Youth Partnerships Pilots have been established that are aimed at “strengthening collaboration and consistency in service provision to young people, to improve engagement with education and training, leading to an increase in the completion of Year 12 or equivalent and reducing the escalation of problems for individual young people” (DEECD, 2012).
WA Snapshot
• A young person under 16, with or without Year 10: Western Australia, like Queensland, created youth participation legislation some years before the CoAG agreement. As such any young person under 16 years is within the compulsory school age and is expected to stay at school or be registered for home schooling until they turn 16.
• A young person between 16 -17, with or without Year 10: Young people under age 17, whether they have completed Year 10 or not, should have an individual pathway plan (WA DET 2007, 2011). A pathway refers to a course or combination of courses to be accessed by a student in fulfilling the legal requirement of full-time participation. A ‘Notice of Arrangements’ form as well as either an ‘Application to Participate in a Combination of Options’ form or ‘Application to Participate in Full-time Employment’ form needs to be completed by the parent/carer. The Participation Manager in the local district education office has authority to approve this (WA DET 2007, 2011). Unique to WA, responsibility is placed on employers, who are not allowed to employ compulsory-aged students in the year in which they turn 16 or 17 years of age on a full-time or part-time basis without prior approval, if the employment forms part of a pathway option other than full-time school (WA DET, 2007).
Learning Choices programs in WA are organised in two ways:
1. Engagement programs are for young people in Year 11 and 12, and aim to enable them to better access further education, training and / or employment by developing “awareness, skills, knowledge and personal attributes” (WA DET, 2011b).
2. Community based courses are for young people of compulsory school age who have disengaged from schooling and need an alternative opportunity “to develop their literacy, numeracy, social and life skills in a safe and secure environment that is comfortable for them and conducive to learning” (WA DES, 2011, p.1).
3. Findings
The aim of this report is to map existing knowledge about Learning Choices programs in Australia, in order to inform further research as well as policy and practice. Therefore, the analysis of findings has used two strategies:
• Establishing factual data - what do we know from the Learning Choices National Scan and the additional program reports? (see Appendix 1 for the list of reports);
• Synthesis of existing research - what are the key findings as well as indications of gaps in knowledge from recent major research reports? (see Appendix 2 for an annotated bibliography of selected reports and the reference list for all sources).
This section discusses the results of each of these strategies in relation to six topic areas that are relevant to understanding Learning Choices provision:
• Numbers • Outcomes • Structures • Mission • Curriculum • Staffing
3.1 Numbers
Data
As outlined in section 1.2, terminology in this sector is contested and definitions of the sector are complex. Estimating the number of Learning Choices programs and students is, therefore, not straightforward. Overall, the responses to the Learning Choices National Scan add up to 61,000 young people in over 400 programs in almost 2000 locations nationally. However, two specific contributions to the Learning Choices National Scan require further consideration: Adult and Community Education (ACE) in Victoria with 10000 students in 320 locations and the Victorian Certificate of Applied Learning (VCAL) with 19175 students in 430 locations. Without a doubt these both offer choices for learning to young people: ACE (as well as TAFE across Australia) gives young people the option of studying for vocational certificates, traineeships and apprenticeships within a more adult, post-school environment. VCAL (as well as senior secondary VET in School (VETiS) pathways in other states and territories) offer an alternative to the traditional academic Year 11 and 12 curriculum. VCAL and VETiS demonstrate how school systems have responded to the dramatic rise in retention to Year 12 during the 1990s and the resulting broadened student population by offering more inclusive curricular approaches. Both ACE/TAFE and VCAL/VETiS enable many young people to remain in education by offering vocational learning options that lead to credentials that are in many (although not all) ways equivalent to more traditional Year 12 qualifications.
important role in catering for many students within conventional education. The ACE Learn Local website makes clear that “Learn Local education and training is for everyone”, rather than catering specifically for disenfranchised young people. Including not only VCAL and ACE but also VETiS and TAFE nationally would increase the number of locations and young people manyfold. Such inclusivity and reach is good for young Australians, but also reinforces these programs’ more mainstream nature. For this reason, this report does not include ACE/TAFE and VCAL/VETiS as entire, large programs within the notion of Learning Choices programs.
For this report, Learning Choices programs are those that are (as yet) not mainstream and are aimed particularly at disenfranchised young people who are not well served by more conventional schooling. This includes those aspects of ACE/TAFE and VCAL/ VETiS that explicitly aim to cater for young people who are unlikely to complete their schooling in conventional settings. In the ACE and TAFE sector that includes alternative Year 10 and Year 12 programs, such as the Certificate in General Education for Adults and the Tertiary Preparation Certificate. In VCAL/VETiS that includes Community VCAL programs as well as other specific Learning Choices programs that draw on VCAL or VETiS for their curriculum.
Using the scope as outlined above, the results from the Learning Choices National Scan point to:
• 33,000 young people • in over 400 programs • in 1200 locations nationally.
In addition, another 4100 young people were on waiting lists to enrol in programs (see Holdsworth, 2011). This data highlights that Learning Choices programs cater for large numbers of young people and play an important role in educational provision in Australia.
Moreover, the actual number of Learning Choices programs, and of young people attending these programs, undoubtedly is much higher than is evident from the results of the National Scan. For example, the Scan has an underrepresentation of programs from New South Wales, from programs that operate within the government sector, and from un-networked programs. It is safe to state that tens of thousands of young people in hundreds of programs across Australia are engaged in flexible and alternative learning initiatives as part of the Learning Choices sector.
Synthesis of research
Key findings
Research in this field has tended to focus on relatively small numbers of Learning Choices programs, and thus can shed little additional light on the number of programs and students nationally. However, several authors do point to the high demand for the sites they researched, with waiting lists a common feature (eg. Beck, 2010; Hands on Learning, 2010; Mills an McGregor, 2010; Myconos, 2011; Working Group on Education for Children and Young People in Out-of-Home Care in Queensland, 2011). In addition, the Youth Affairs Council of Victoria (YacVic, 2011) argues there is demand for more inclusive learning options in rural and regional areas. Also in Victoria, the DEECD (2011c) points out “13%, or almost 50,000, 15-19 year olds are not engaged full time in education, training or employment” as a broad indication of young people who are disengaged and potentially in need of support.
Gaps in knowledge
commencing that will attempt to comprehensively map programs across the ACT (project 5 in Appendix 3) and nationally (project 12 in Appendix 3). The latter will build on the Learning Choices National Scan and provide initial findings by early 2013. So far, however, there is no further knowledge about numbers from existing research projects.
The Learning Choices National Scan offers the best data to date about the number of Learning Choices programs and students in Australia. However, this Scan does not capture all programs. As Holdsworth (2011, p.4) notes in his analysis of the Scan data, response to the invitation to contribute “may be affected by the degree of networking, of information and contacts within various states and territories”. As a result there continues to be a clear gap in knowledge about the number of programs and young people in this sector.
In relation to the broad definition, vocational and community programs that aim to (re-)engage young people (similar to VCAL and ACE) could arguably also be counted from other States and Territories. For example, most jurisdictions now offer the opportunity to complete Year 11 and 12 with predominantly vocational options, although outside Victoria these lead to the same Year 12 certificate rather than a separate one. It would be useful for future research to explore which programs from various States serve a similar purpose in engaging young people with education and the number of students involved. This would give a more accurate picture of the Learning Choices provision across Australia, based on the broad definition.
In relation to the narrow definition, more research also is needed. As noted by Holdsworth (2011, see above) non-networked ‘single’ programs are likely to be under-represented. In addition, most TAFE and ACE colleges have Year 10 and Year 12 equivalent programs (such as the Certificate in General and Vocational Education and the Tertiary Preparation Certificate). Only a few of these are included in the National Scan. Finally, many conventional schools have Learning Choices initiatives within them. Some of these are captured in the scan through organisations that provide such programs within schools. Other initiatives, however, are likely to be funded within state departments or through the National Partnership on Low Socio-Economic School Communities.
In addition, more research is needed to analyse the number of programs and young people in relation to background characteristics, such as:
• System/affiliation of programs (such as government, independent or Catholic school system, as well as naming specific networks they belong to);
• Urban, suburban, regional and rural provision (see also YacVic, 2011); • Provision of single-gender programs (Holdsworth, 2011);
• Gender of participants (Holdsworth, 2011) ; De Jong and Griffiths (2006) and Wyn, Stokes and Tyler, (2004) point to an over-representation of boys;
• Age of participants (Holdsworth, 2011); Beck (2010) and NEYON (2010) point to a lack of provision for young people under age 15;
3.2 Outcomes
Data
The outcomes of programs were not addressed in the Learning Choices National Scan, beyond whether the programs offered credentials (see 3.5 below). Outcomes are referred to in almost all program reports, but with great variation in the amount of detail and strength of evidence provided. The subheadings below group the types of outcomes that were most commonly reported by programs: attendance, academic achievement, destinations, non-academic achievement and stakeholder satisfaction. The first three of these are of particular relevance to the national policy agenda around raising educational attainment (see section 2). The latter two cover ‘softer’ and less tangible outcomes that are highly valued by programs and provide indications of wellbeing and engagement.
Attendance
Attendance is listed as an important, basic outcome by several programs. Reported attendance rates vary from 40% to over 90%. Several Learning Choices programs note that their students have a chequered attendance history. Some programs use this history to explain why attendance rates are lower than in conventional schools as well as to point to their ‘added value’: ie. the improvement in students’ attendance, even if it is not yet perfect. For example, a ‘stand alone’ program2 had an average student attendance rate in 2010 of 83% and contends: “Referral information from students’ previous schools indicates high levels of truancy and school refusal. These figures show a significant improvement for the majority of students”.
Programs also point out that a single average attendance rate does not capture the diversity of their student population. Some of their students have more difficult life circumstances that may lead to very low attendance, affecting the average figure. The report for a ‘stand alone’ program explains that an individual student’s attendance also may vary from term to term or even week to week:
Students enrolled at [X program] come to the school with very complex backgrounds and experience a range of issues which impact seriously on their capacity to engage with the education process. Individual attendance can be inconsistent according to the events occurring in their lives at the time.
Therefore, although attendance is seen as an important outcome, measuring it is complex. Nevertheless, some programs report outstanding successes, not only turning around previously poor attendance but achieving better results than conventional schools. One ‘stand alone’ registered school program highlights that attendance rates are consistently above regional and State averages. Another ‘integrated’ program3 (within a conventional school) notes that compared to their previous school attendance, students in the program had:
an average increase of 29 more school days per student, effectively attending school 6 weeks more than they had in either of the previous two terms.
Keeping in mind the mixed quality of the data, and the concerns raised regarding measuring attendance, many Learning Choices programs report significant gains in attendance by young people.
Academic achievement
A small number of programs include Year 9 level education, which means their students fall within the NAPLAN cohort. A few reports offer detailed information about the performance of their students in NAPLAN, which highlights the struggle of their students with literacy and numeracy. For example in one ‘stand alone’ program between 36-64% of students met the minimum standards on the various tests (reading, writing, spelling, grammar and punctuation, and numeracy) - compared to the State average of between 89-94%. The reports did not provide (and probably did not have access to) their students’ Year 7 NAPLAN results, so that it is unclear to what extent these programs had been able to improve students’ literacy and numeracy, as measured by NAPLAN. Data on literacy and numeracy based on other measurements was not provided in the reports.
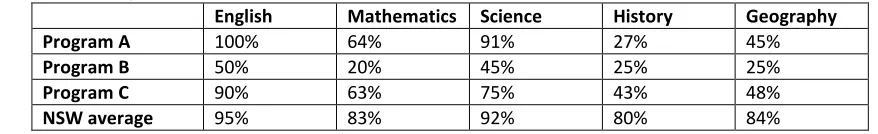
Year 10 level education was very common across the programs. In New South Wales Year 10 has traditionally involved standardised state-wide testing for the award of a formal School Certificate4. Several of the accredited schools in NSW provided detailed School Certificate results in their annual reports. Table 1 shows the proportion of students who achieved at or above the minimum level (Band 3-6) for the three Learning Choices programs (all stand alone accredited schools) that provided such data, as well as the NSW state average.
Table 1: School Certificate results
English Mathematics Science History Geography
Program A 100% 64% 91% 27% 45%
Program B 50% 20% 45% 25% 25%
Program C 90% 63% 75% 43% 48%
NSW average 95% 83% 92% 80% 84%
As with NAPLAN, these results highlight that overall students in Learning Choices programs achieve at significantly lower levels than the state average. This is to some extent the definition of these Learning Choices programs: they cater for students for whom conventional schooling has not worked well.
Only a few programs give information about the achievements by their students in Year 12 exams and this indicates only a few achieve highly enough to gain entry to university, although in two ‘stand alone’ programs several students achieved above the state average in certain subject areas and one student won a prestigious scholarship to attend university.
Destinations
Post-school destination surveys are fairly commonly used according to the reports by Learning Choices programs, usually within the first year after students have left. For programs that offer no or only low level credentials, a common destination is to other Learning Choices programs, educational transition programs, or pre-employment programs.
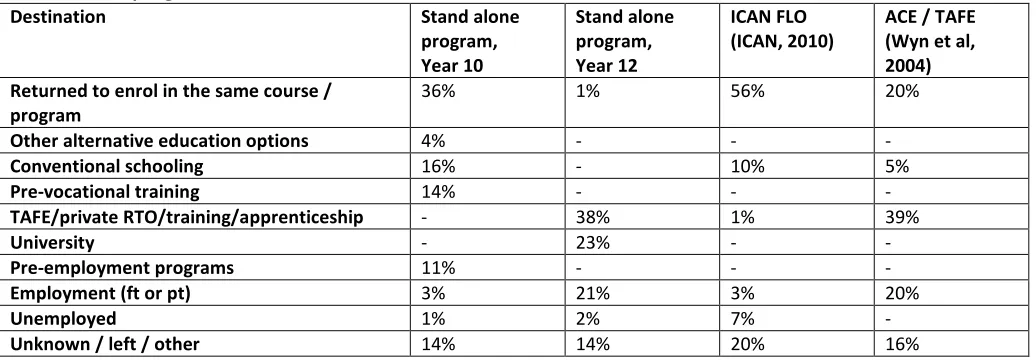
Table 2 provides the results for two ‘stand alone’ programs (one for Year 10 students and one for Year 12 students), as well as for ICAN Flexible Learning Options (mostly ‘stand alone’), and for the six ‘affiliated’5 ACE/TAFE programs investigated by Wyn et al (2004). Although the data for these sources does not include exactly the same categories, it is striking that a substantial proportion of young people re-enrol in the same course or program in the following year, except for the Year 12 graduates. The group for whom destinations are ‘unknown’ or ‘other’ is significant across all three examples.
4 This has been abolished from 2012 onwards.
Table 2: Post-program destinations
Destination Stand alone
program, Year 10
Stand alone program, Year 12
ICAN FLO (ICAN, 2010)
ACE / TAFE (Wyn et al, 2004) Returned to enrol in the same course /
program
36% 1% 56% 20%
Other alternative education options 4% - - -
Conventional schooling 16% - 10% 5%
Pre-vocational training 14% - - -
TAFE/private RTO/training/apprenticeship - 38% 1% 39%
University - 23% - -
Pre-employment programs 11% - - -
Employment (ft or pt) 3% 21% 3% 20%
Unemployed 1% 2% 7% -
Unknown / left / other 14% 14% 20% 16%
Based on all the program reports, common ‘learning’ destinations mentioned are Year 11 or 12 in conventional schools and Certificate II and III level courses at TAFE, ACE or a private RTO. In other words, the Learning Choices programs can act as a pathway back into a relatively conventional educational option. The reports do not provide data on the outcomes of their graduates in these further education options.
Transition into employment is a common outcome for programs offering higher level qualifications (year 12 and Certificate III and up), with reports indicating between 20-40% of graduates move on to a job. Some programs also list the number of graduates who are seeking work or are unemployed. On the positive side, one ‘integrated’ program with a vocational focus demonstrates the much lower experience of unemployment among its graduates compared to young Australians generally. Other programs that provide this data indicate between 1-25% of graduates are seeking work at the time of their destination survey. There is not enough information to suggest what causes this variation.
Non-academic achievement
The overwhelming majority of non-academic outcomes mentioned in the program reports relate to social and emotional wellbeing, especially improved confidence and self esteem. Some ‘stand alone’ and ‘integrated’ Learning Choices programs are mostly aimed at improving wellbeing. The evaluation for one such ‘integrated’, short-term program found that 100% of the graduates agreed the program had increased their confidence. For some programs and some students, this wellbeing went a step further, including addressing mental health difficulties. For example students in a ‘stand alone’ program:
talked about learning skills to manage anxiety in the program then transferring this to peers and to workplaces.
Improved attitudes and motivation were also seen as valuable outcomes. The evaluation of the same ‘stand alone’ program found some young people
talked about regaining their enjoyment of learning, and their motivation to do well in the world.
Stakeholder satisfaction
Several program reports include results from surveys the Learning Choices program conducted with various stakeholders. In addition, other reports draw on more incidental feedback, for example letters to the Learning Choices program. Most of the reported stakeholder satisfaction relates to students and to parents/carers. The evaluation of one ‘stand alone’ program provides several short quotes from students, including:
I’ve done more work here than in the last 3 years of school.
I’m most proud of getting my Certificate II and completing the course. I didn’t think I would ever achieve this. I now feel excited and confident about my future.
They identified qualities in me that I never recognised before.
Some programs conduct more formal surveys and indicate the number of students who agreed with survey statements, for example in this ‘stand alone’ program:
The teachers try to help me with my studies. 41 agreed, 1 disagreed and 4 didn’t know. I find my lessons enjoyable. 28 agreed and 15 disagreed. 2 didn’t know. I find my lessons challenging. 20 agreed but 20 disagreed and 5 didn’t know.
The reported feedback from parents/carers to Learning Choices programs mostly indicates a sense of relief that their son or daughter has found a place where they are supported and staff care about them.
Synthesis of research
Key findings
Like the program reports, the research discusses a range of valuable outcomes, including improved attendance and completion rates; academic achievement, especially in literacy and numeracy; transition to post-school destinations; and the “less tangible or quantifiable ‘soft’ skills” (Myconos, 2011, p.41) such as increased confidence, engagement and aspirations.
Characteristics of programs that lead to valuable outcomes as identified in research are discussed in relation to sections 3.3 (structures), 3.4 (mission), 3.5 (curriculum) and 3.5 (staffing) of this report. When research is quoted in relation to factors that contribute to ‘successful’, ‘positive’ or ‘effective’ programs, that refers to the spectrum of outcomes in relation to attendance, academic and non-academic achievement, destinations and stakeholder satisfaction, unless specified otherwise. The exception is the report by Lamb and Rice (2008), which defines success largely in relation to reducing early school leaving enhancing school completion.
Limitations on the ability of programs to achieve positive outcomes are recognised. In relation to the Schools First awards, Simons (2011, p.5) notes that:
Successful outcomes for a school starting from a low base, in terms of student performance or levels of student engagement, may be quite different from the successful outcomes of schools that are already high performing.
been unsuccessful. He argues that “any judgements on program effectiveness should therefore be tempered by a reminder of the scale and difficulty of the undertaking” (Myconos, 2011, p.42).
Limitations related to the measurement of outcomes are also discussed. It may take considerable time for programs to display effects (Black et al, 2010; Lamb and Rice, 2008). Interventions may be complex (Black et al, 2010) so that some programs may demonstrate limited impact for reasons other than the quality of the program, such as finances and context (Lamb and Rice, 2008). Of more concern is the risk that internally conducted evaluations may be “eager to justify their provision” and “methodologically flawed” (Black et al, 2010, p.12).
Other research flags some concerns about the actual outcomes, such as in relation to graduate destinations (Mills and McGregor, 2010; Wyn et al, 2004) and the risk that good attendance does not necessarily lead to improved learning (Connor, 2006). Wyn et al (2004) express apprehension about programs not moving beyond improving soft skills (such as self esteem) to enabling completion of credentials. They caution that some students appear to move from one enabling course to another, rather then using enabling courses as a stepping stone to higher level qualifications. De Jong and Griffiths (2006, p.38) warn that “poorly constructed and poorly resourced AEPs [alternative education programs] can potentially have poor outcomes for students and may even place the safety of students and staff at risk”.
Gaps in knowledge
A powerful message about the need for better outcomes data comes from the final report of the Review of funding for schooling (Gonski, 2011). Exploring the funding arrangements for disadvantaged schools and students generally (ie. not specifically for Learning Choices programs) the report notes that “more should be known about the impact of Australian Government targeted funding for disadvantaged students and schools on improved outcomes” (Gonski, 2011, p.135). The report (p.135) identifies as a problem that:
Although there are set objectives and guidelines around the use of funds, very limited data are required of state and territory governments and the non-government school sector on the impact funding is having on the educational outcomes of targeted students.
In relation to extended service programs generally, Black et al (2010) also critique the lack of monitoring and appropriate measurement of success. Similarly, although most Learning Choices programs have specific objectives (see 3.4 below) they do not necessarily gather or provide strong evidence on the extent to which these objectives are achieved. Lamb and Rice (2008, p.41) suggest that implementing programs requires not only “careful planning and design, but also careful evaluation”. This involves deciding what outcomes are expected from various initiatives and using a variety of both quantitative and qualitative measures, such as achievement data, stakeholder satisfaction, data on attendance and absences, and teacher reports on behaviour and progress. Lamb and Rice (2008) and Black et al (2010) agree that it is valuable to gather data at several intervals, rather than at one point in time. Black et al (2010) also recommend the use of action research.
Second, ICAN has developed a tool to capture the somewhat elusive but highly desired outcome of student engagement. As ICAN (2010, p.15) explains:
Successfully measuring student engagement has been a challenge for educators throughout the world. There is certainly no nationally, nor internationally agreed and validated measurement instrument that can be applied to provide baseline or progression data in relation to measuring student engagement in learning.
In response, ICAN has developed the ‘ICAN Engagement Matrix’ measuring engagement in learning through three domains: wellbeing, relationships and involvement in learning. The matrix has been made available to all DECS teachers in South Australia (not just in ICAN) supported by professional development.
In addition, a research project in Queensland is developing a new portfolio based assessment model for disenfranchised students seeking to re-enter education, in collaboration with Edmund Rice Education Australia Flexible Learning Centre (EREA-FLC, see project 2, appendix 3).
For the ICAN matrix and Compass tool research is needed on their implementation and impact in South Australia. For both these ICAN tools and the EREA_FLC tool, research is needed to assess their potential as measurement tools across inclusive education settings.
In addition, the research (explicitly or implicitly) points to several other areas where more information is needed, related to outcomes:
• Improved data on the pre-existing disadvantage and barriers to education of students, including longitudinal quantitative data tracking students’ absenteeism and attendance from Year 1 onwards, including qualitative data on the reasons for absences (Connor, 2006; Hargreaves, 2011).
• Compare schools on how well they seem to ‘hold’ students and determine which school practices contribute to that, including the impact of school culture and relationships between staff and students on student engagement in learning (Connor, 2006; Mills and McGregor, 2010).
• Gather evidence of the commitment young people make to Learning Choices programs and their goals and motivations (for example both Mills and McGregor, 2010, and Wyn et al, 2004, note several students are travelling long hours in order to attend the program, and many young people have high aspirations that motivate them).
• Specifically for children in care, establish a centre of excellence to collate evidence about improving educational outcomes, including outcomes from educational support plans (Working Group on Education for Children and Young People in Out-of-Home Care in Queensland, 2011).
• Better tracking of young people after they leave programs, over a longer period, to establish destinations, as well as success in those destinations (esp. further learning and the labour market) for young people who did / did not complete the program, and the length of time it takes to achieve positive destinations (Beck, 2010; ICAN, 2010; Mills and McGregor, 2010; Wyn et al, 2004).
• More detail about the unemployment experience of graduates (eg. in terms of duration and at several intervals following graduation) and of the differences between programs that have few/many graduates who are unemployed.
• Further knowledge about strategies to provide disadvantaged learners with access to and completion of higher-level VET qualifications (Hargreaves, 2011; Wyn et al, 2004).
3.3 Structures
Data
Size
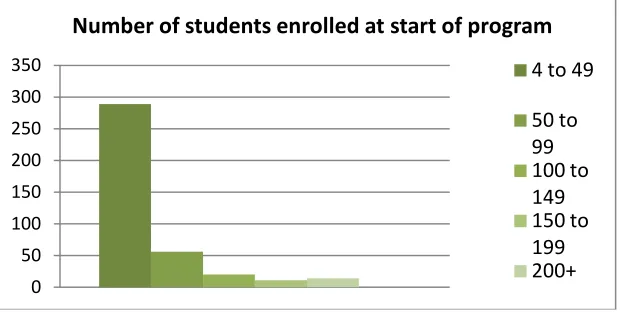
The Learning Choices National Scan provides data about the number of students within programs. Out of the 400 programs that entered details for the number of students, almost three-quarters were relatively small - under 50 students (see Figure 1 below). Of those, 165 programs (or 40% of all entries) had fewer than 20 students enrolled at the commencement of a program.
Figure 1: Program population size - at commencement
The vast majority of Learning Choices programs are relatively small, although some (especially in ACE/TAFE colleges) have a substantial number of students enrolled.
Time
In the Learning Choices National Scan, 58% of programs are full time or close to full time. Some programs that run for four days per week are considered full time. One fairly large, ‘stand alone’ accredited school program explains the choice to offer a full time program in a four-day week so:
students can pursue employment opportunities, reduce travelling time or complete family commitments in 1 extra day per week while still receiving a full time education.
On the other hand, about 23% of programs run for one day per week or less. These may run as ‘integrated’ programs within conventional schools, taking students out of their regular classes and into a separate program within the school. One such program notes that they make use of the entire day, so that:
recess and lunch are also an integral part of the program and provide many incidental learning opportunities.
About 60% of programs run over a full year or longer. Of these 38% were full time or four days per week, while 12% ran for one day per week or less. This indicates a sizeable proportion of programs that are similar to conventional schooling in that they are (almost) full time and long term. At the other end of the spectrum, about 7% of programs run for 10 weeks or less, and 13% run between 11-20 weeks, within two school terms in most states.
0 50 100 150 200 250 300 350
Number of students enrolled at start of program
4 to 49
Networks and connections
In the Learning Choices National Scan, 35% of responses form part of a state network. In addition, 24% are part of a local network and 25% belong to a national network. Networks of Learning Choices programs include Innovative Community Action Networks (ICAN), the Beacon Program, Big Picture Education Australia and New Zealand, Edmund Rice Education Australia Youth+, and Hands On Learning.
In terms of the connections of Learning Choices programs with conventional schooling, the program reports highlight three main groups:
1. stand alone program: organisationally independent as well as being located on a site separate from conventional education. These programs are often accredited as schools in their own right and tend to have their own identity, for example as senior colleges or ‘special schools’.
2. organisational affiliation on a separate location: these programs maintain a separate identity through their location - on a special site within their host institution or on a completely separate location. However, they fall under the umbrella of their host (such as a TAFE or ACE college) including shared policies, professional development and (usually) funding.
3. integrated: operating within conventional schooling. This includes programs of fundamental whole school change for all students as well as programs that withdraw selected students from their usual schooling for part of their school week to participate in the program.
Funding
The issue of funding was not addressed in the Learning Choices National Scan, but is referred to in several program reports. For accredited schools the bulk of funding comes from federal and state governments. For affiliated and integrated programs, most funding usually comes from the conventional school or TAFE/ACE institution with which they work. Additional sources of funding for all types of Learning Choices Programs include awards such as the NAB Schools First award (which has been won by several Learning Choices programs); special government projects such as the previous Boys’ Lighthouse project or current National Partnerships on Low SES School Communities; and philanthropic foundations.
Program reports also highlight that funding is a barrier to the quality and sustainability of programs. First, the amount of funding is considered insufficient, partly because Learning Choices Programs tend to have higher costs than conventional schooling, which are related to the provision of additional services (housing, health, welfare, breakfast programs), the need for transport for students coming from a larger geographic area, the lower student-staff ratio and (for many) their small size and turnover of students. Second, the use of a single official census date for allocating government funding to accredited schools is of concern, since that does not reflect the fluctuating numbers throughout the program’s duration. As one program notes:
The timing of funding cycles is irrelevant to these students, who come when THEY are ready, not when the system is, so at any given time we can have around 30 students for whom we receive no funds at all.
Synthesis of research
Key findings
In relation to the size of programs, both Connor (2006) and Lamb and Rice (2008) suggest small size is an aspect of successful provision. This can either mean small programs, or smaller sub-structures (such as mini-schools) within larger programs. These enable building trust and a sense of belonging among students. Myconos (2011, p.33) argues that “the effectiveness of the 2010 BSL-CVCAL [Brotherhood of St Laurence Community VCAL program] was due in large part to the intimate setting and close relationships between teacher and learner” (also see section 3.5 on staffing). For conventional schools (that are the focus of the report by Lamb and Rice) there is evidence that such a “more familial-based approach” (Lamb and Rice, 2008, p.21) to grouping students can reduce early school leaving.
There are few research findings in relation to the time aspect of programs. Mills and McGregor (2010) point out that the flexibility inherent in many Learning Choices programs means that daily attendance on site is not necessarily required. Lamb and Rice (2008) argue that interventions need to be ongoing and offer long-term support for students in order to sustain positive outcomes over time. On a different note, Wyn et al (2004) suggest it is useful for programs to offer flexibility in terms of the timing of when students can enrol.
Research also points to the variety of ways in which Learning Choices programs are organised. De Jong and Griffiths (2006) map a continuum of alternative education programs based on their relationship to conventional schooling, ranging from withdrawal to part of school. In its report for the Victorian government, KPMG (2009) recommends four tiers of education provision of young people at risk of disengaging or disengaged from school: differentiated provision (within a region, with schools having different emphases and offerings in order to cater for a wide range of young people within that region); targeted initiatives (as an add-on to schooling, eg. through outreach, tutoring or case management); flexible learning options within school settings (short term intensive placements); and flexible learning options within community settings (on a longer term basis).
For programs that are part of TAFE or ACE, Wyn et al (2004) warn that barriers to access include age limitations, minimum requirements for previous education, and financial barriers. Beck (2010) and NEYON (2010) suggest provision for students under age 15 is generally scarce while YacVic (2011) points to transport and income as particular barriers to access for young people in rural and regional Australia.
The importance of strong cross-sectoral and interagency collaborations is confirmed by research (Connor, 2006; De Jong and Griffiths, 2006; Hargreaves, 2011; Lamb and Rice, 2008; Wyn, Stokes and Tyler, 2004; YacVic, 2011) not just for enhancing the success of programs but also for enabling young people to locate and gain access to programs in the first place (Wyn et al, 2004; YacVic, 2011). Extended service schooling (which is built around interagency collaboration) has been shown to improve young people’s engagement in schooling and wellbeing (Black et al, 2010).
• flexibility of the award funding;
• strategic planning for partnership expansion;
• formalised structured and processes of communication; • strategies for sustainability;
• capacity for the partnership to be replicated in other settings.
In addition, Black et al (2010) suggest effective partnerships have common values and goals; mutual trust and respect; shared terminology; adequate resources including time and human capital; and an emphasis on enhancing student outcomes.
However, there is recognition that coordination of services across organisations with different priorities and cultures can be challenging (Black et al, 2010; Connor, 2006; Myconos, 2010; YacVic, 2011). Moreover, De Jong and Griffiths point to the risk that the connection between conventional schools and Learning Choices programs can become one-sided, with schools simply using inclusive programs as “’dumping grounds’ for ‘problem’ youths” (p 32). In relation to ‘stand alone’ and ‘affiliated but separate’ programs, a concern in the literature is that by having separate programs that remove young people from conventional schooling, their marginalisation is reinforced (De Jong and Griffiths, 2006; Zyngier and Gale, 2003).
Appropriate funding is seen as crucial not only in the reports from programs but also in the research. In particular, the sustainability of programs is linked to reliable and sufficient funding (Black et al, 2010; Connor, 2006; De Jong and Griffiths, 2006; Mills and McGregor, 2010; YacVic, 2011). The specific needs of students as well as the benefit of high levels of staffing (also see 3.5 below) mean that the cost per student is likely to be higher than in conventional schooling (Connor, 2006; Owen, 2004). Other specific concerns relate to the insecure nature of funding sources, use of a single census date for establishing the number of students for who the program will receive funding, inequities in funding between programs and regions, and the implications of a program being defined as a school or not (Hands on Learning, 2010; Mills and McGregor, 2010, Te Riele, 2008).
There is a sense of wastage when effective programs are discontinued due to lack of funding (see Beck, 2010; De Jong and Griffiths, 2006; Hands on Learning, 2010). Many young people in Learning Choices programs consider the program their last chance at gaining an education (eg. Mills and McGregor, 2010; Te Riele, 2006b). Therefore, resourcing Learning Choices programs is a cost-saving policy. King (1999) estimates the lifetime cost to Australia at $74,000 per early school leaver, made up of both direct monetary costs and social costs. Adding this up, “the overall cost to Australia of one year's early school-leavers is an estimated $2.6 billion” (King, 1999, p.1). Providing inclusive programs so all young people can gain school credentials is important for both economic and social reasons; and for both the individual and the broader society. The Business Council of Australia (BCA, 2003) uses economic modelling to shown that if 50 per cent of 2003 early school leavers completed Year 12 (for which Learning Choices programs are a key strategy), GDP would increase by $1.8 billion by 2020. This is both because individual living standards and productivity would improve and because welfare, crime and ill-health costs would reduce. Similarly, King (1999, p.1) concluded that:
reducing the number of early school-leavers would be a very sound investment for the individuals concerned, for government, and for the country as a whole. Just on the basis of the monetary costs, it would yield an estimated 12.5 per cent rate of return.