Journal of
-Volume ?’ Number i? March 1954
RANGE
MANAGEMENT
~-
The Future of Our Range Resources
F. G. RENNER
Range Conservationist, Soil Conservation Service, Washington, D. C.
0
NE of the questions to be con- sidered by this conference is whether the Nation’s range re- sources will be so diminished during the next 25 years as to critically threaten our welfare.Had this question been asked back in 1928, just 25 years ago, there is little doubt what the an- swer would have been. The experts of that time contended that condi- tions were critical even then and dire results were to be expected both to the resource itself and to the Nation’s economy if the trends con- tinued. In 1928, vast areas of the range were considered to be eroded, overgrazed and depleted. Officials had long since questioned the feasibility of any extensive im- provement through reseeding, and the belief was widely held there was little possibility of either main- tenance or improvement of the range unless the livestock popula- tion was drastically reduced.
In the light of these predictions, let’s take a brief look at what actu- ally took place. First, I believe most people who are widely familiar with western ranges will agree that during the past 25 years there has been marked improvement in range con- ditions throughout almost all of this area. The startling fact is that this improvement has taken place in the face of almost continuously increasing livestock numbers, in-
l Address presented at the Mid-Century Conference on Resources for the Future held at Washington, D. C., December 2-5, 1953.
stead of the reductions once thought necessary.
Since 1928, the livestock popula- tion in the 17 States of the range area has increased 41 percent, from 32,807,OOO to 46,510,OOO animal units. Moreover, both the im- provement in the range and the increase in livestock has taken place in the face of substantial re- ductions in the area devoted to range use. In the Plains States, many millions of acres of range lands have been plowed and put into cereals, beans and other crops. In the mountains the encroachment of timber reproduction, and in the Southwest the thickening up of other woody species, has sub- stantially reduced the range area. The happenings of the past probably offer us some valuable clues as to what we may expect in the future. Accordingly, it may be profitable to examine the factors that brought widespread improve- ment to the range in the past 25 years, under conditions which many thought to be unfavorable for such improvement.
Despite two periods of severe drought, generally favorable weather and growing conditions that stimu- lated natural recovery was un- doubtedly one such factor.
An increasingly prosperous live- stock industry, with its members possessed of funds for reseeding, fencing, water development, and other improvement measures, and, of equal importance, convinced of the need to use their cash for these purposes, was another.
5.5
The perfection of machinery for seeding and harvesting grass, chem- icals and machinery for eradicating useless brush, and a host of other such developments have vastly in- creased forage production, even on some of our least productive lands. Probably the factor most im- portant of all has been a change in the attitude of people-a change from a philosophy of indifference to one of determination that conditions can be changed for the better.
56 - F. G. RENNER
Table 1. Estimates of potential improvement of grazing lands in 17 Western states
Range and Pasture Land Acres
Privately-owned
Range and pasture. . . . . . Forest range. . . . . . Publicly-owned
365,000 74 ) 000
Range . . . . . . . . . . . . 215,000 Forest range. . . . . . . 105,000
thousands
759,000
Improvement Pos- sible as Percent
of Present
200 150
300 200
Equivalent Acres
thousands
730,000 111,000
645,000 210,000 -____ 1,696,OOO
that have taken place in the past 25 years. These are sufficiently substantial, however, to indicate that we are only beginning to be- come aware of the possibilities ahead of us.
Estimates indicate that the 759 million acres of private and pub- licly-owned ranges in the 17 Western States can still be improved from 150 to 300 percent (Table 1). This would provide the equivalent of more than a billion and a half acres of range in their present condition, more than double the present available area.
Neither the progress that has been made nor the promise of future improvement is any cause for complacency, however. There are still many critical problems ahead of us if our range lands are to do their part in supporting the ex- panding demands of our national economy.
Not all operators are aware of the extent to which their ranges can be improved, nor are they convinced of the necessity, or of the financial advantage of the measures that will bring it, about,. From 80 to 125 mil- lion acres remain to be reseeded, with the needed seed supplies of
improved species not yet in sight.
Many ranges need more fences if satisfactory management is to be practiced, and there are still some areas that are too poorly watered to allow efficient. use of the forage. A great deal more, and decidedly better, research is needed to find the answers to a number of important range problems. Among the research needs are studies of ways to reduce costs of production that will help maintain the range livestock in- dustry in a prosperous condition and continue to make private funds available for needed conservation measures. More investigations are needed to determine the costs and benefits of conservation practices themselves, as a means of speeding up their use. The development of more selective herbicides not, only offers profits to industry, but prom- ise to landowners for more effective ways to rid their lands of noxious woody plants. The development of better forage grasses, which has barely started in the last decade offers great promise for more nutritious forage, more of it, and for a longer period of use. The use of certain fertilizers has given marked results on some range types and such studies need to be expanded to determine the conditions under
which this practice can be used on other areas. Nor should we over- look the importance of economic research which will provide reliable costs of all of these measures so that the landowner may decide upon their practicability and suitability for his own conditions.
At the same time, we need to realize that research is of little value unless means are found to get its results out of musty publications and into use by farmers and ranchers of the country. A few scientists had known for twenty years, for ex- ample, that crested wheatgrass was adapted to the climate and soils of the Great, Plains. It wasn’t, until the action agencies of the U. S. Depart- ment of Agriculture were developed, however, that this and similar in- formation was translated into a reseeding program that has doubled and quadrupled the forage supply on more than 15 million acres.
The Brush Control Problem
in California’
II. H. BISWELL
Professor of Forestry, University of California, Berkeley, California
T
HE brush problem in California has been “pin-pointed” as one of lost acres-once productive acres now lost to invading brush. Because the brush has increased in abun- dance, the production capacity of many lands has gone downward. The problem now is to control the brush, to recover the “lost acres” if possible, to prevent further loss, and to keep all acres productive and healthy.It is needless to say that acres lost to brush are not producing their optimum in domestic livestock, game, timber, recreation and water. The problem of brush control in California is becoming more im- portant all the time because the human population is increasing rapidly. Each day there are more than a thousand new people to house, feed, clothe, to use water, and to demand recreation facilities in one form or another. Further- more, the population is expected to increase at this pace for some time. In view of this, it is not wise to permit the continual loss of productive acres to brush.
It is gratifying to report that a number of agencies and organiza- tions in California are now co- operating in research on the many fundamental and practical aspects of the brush control problem. Among these are the California Department of Fish and Game, the U. S. Forest Service, the State Division of Forestry, and several departments of the University. Ranchers are contributing greatly. The Agri-
l Paper presented at the Sixth Annual Meeting of the American Society of Range Management, Albuquerque, New Mexico, Januarjy 20-23, 1953.
cultural Extension Service and organizations like the San Francisco Chamber of Commerce are par- ticipating by carrying information to the general public. The very fact that all of these agencies and organizations are working on the brush control problem indicates great progress in itself. In Cali- fornia, probably more than in many other’ areas, the brush prob- lem greatly concerns not only the livestock industry, but other groups like sportsmen, farmers using water for irrigation, foresters and outdoor recreationists. Brush control is a problem on many wild lands used for purposes other than grazing. Furthermore, it is a problem on public lands as well as on private lands. For the past six years the California Department of Fish and Game and the University of Cali- fornia have studied the “Effects of Brush Removal on Game Ranges in California. ” This is done under Federal Aid in Wildlife Restoration Act, Pittman-Robertson Research Project 31-R. ‘fhe report here is taken largely from this study.
Brush Types
The brush in California west of the Sierra crest is often referred to as chaparral. This term is derived from the Spanish word “chaparra” meaning scrub oak. This term was applied by the early explorers of California to the low, shrubby, dominantly evergreen vegetation which they found to be so char- acteristic of the coast ranges and the foothills of the Sierra. Actually, the chaparral includes many species. The most important features are t’he deep root systems, the dense
57
rigid branching, and the small, thick, heavily-cutinized, evergreen leaves. The chaparral is character- istic of California west of the Sierra crest and the deserts; in other words, of the region of the “Californian” climate (Cooper, 1922). This is a Mediterranean- type climate with wet, mild winters and long, hot, dry summers. From May to September there may be no rainfall except for thunder showers in the mountains. During this period, maximum temperatures are frequently above 105” F. and ‘the relative humidity may become as low as 5 to 8 percent. During the long summer period the vegetation becomes extremely dry.
It is interesting to note that this type of climate is characteristic of four other regions of the world: the Mediterranean region itself, parts of southern and western Australia, South Africa and Chile (Whyte, 1949). Shrubs seem to do well in this kind of climate because of their deep root systems and sclerophyllous leaves. Perennial grasses best adapted are those that become completely dormant during the summer.
H. H. HISWELL 58
Thr soils are fairly drcp and
productive. Brush invasion atld
~IKYSLW have 1we11 marked in this
type. The posaihilities here are
good for snrcrssful brush removal
and manipulation. A majority of
the voodlnt~d-grass arca~ ark used
primarily for dumcstir livestock
prodwtion. Alany of them have
lqe numbers of dew and quail.
III timberland chaparral, maw
zanitas and buck brushes are vom- moo. The soil is-chiefly suitahlc for timhrr produrtion hut, due to
logging, fire and other reasons t,he
trrrs in many arcas have hew
largely replaced hy rhaparral
species. 111 many other plares the t,rees we fairly abundant, but the admixture of chaparral spwies rre- atps a real problem in forest man-
agcmrnt. Once no arca has hero
fully owupied hy hrnsh, forest
reprodurtion I’OTLIPS hark very
slovly (Fo\vt.lls nnrl Srhubrrt, 1951). very little is kllO\\-11 ahout the possibilities of brush rcmovnl nod mnnipulnliox in this typr.
The Wildfire Problem
One other thing that should bc
mentioned in rwrmertion with the
hot summers and the very dry
vcgctatioo in the brush areas is
that the tire hazard during tht:
summer often brcomes extremely
high and wildfires are rommon.
This important point must lw
considered in all phases of witdtnnd
management. For the years 1944-
1951 511 average of 4‘24,000 ac’rcs
b11roed annually bY wildlires
(hmerirxo Forest Prodwts porn-
pilat,iar, 1945-1952). The magnitude of this problem is hest indicated by a detailed study of fire ocrnrrenre made hy the lTniversity of Cali- fornia and the (California Forest a~1
Raqq Experiments Station (Weeks
rt al., 1913). 01 3,210,OOO arrrs in
the northern Sierra Nevada foot-
hills it, was found that, 3,X.’ fires
burned 3li3,OOO arres during the
S?‘vPI1 years 1932-1938, or 11 per- rent of the tot,al.
The wildfrrs are startrd in al- most every rvxreivable wsy. Ahout, one-fourth of them are started by lightning, and wcasionally, a grcnt number arc set in a short t,imc.
I)uring the summer of 1951, for
~wnnplr, it was reported that
mwe t,hao 800 lightning s&s or- rurred in three days.
Wildland fires in California have grown into a multi-million dollal problem. Sate and Federal agencies
are spending about, S13,000,000 a
year for protertiotl, and damages
from fire amount,iog to ahout,
SlO,oOO,OOO have been reported in
rwent years (Wyrkoff, 1951). Con-
siderahlc rescarch has been done
on fire behavior, the best, wag to control tires, and the damages they do. Grwter emphasis in res~~wh is w&d on m&hods of creating renditions which Icsscn thr possi-
bility that fires u?ll oxur nod
especially on how t,u weatc row
62 H. H. BISWELL
favor those that are more readily season until seed maturity, after wildlife populations and a decrease browsed. which the forage is grazed to a in fire hazard. Removal ( f brush Generally the most suitable moderate degree. Moderate grazing has resulted in variable effects on method for brush removal will results in maximum competition the flow of springs.
vary from area to area. Usually, between grass and brush and Methods of brush removal in- however, a combination of methods provides maximum seeding and elude controlled burning, bulldozing proves most satisfactory. establishment of grasses. In addi- and chemicals, application of her-
Reseeding tion, browsing by livestock on bicides and combinations of these. brush seedlings and sprouts is an Usually a combination of methods Reseeding is an important phase important factor in retarding the works best. Other important and of management following brush regrowth of brush. essential steps in brush removal are control in chaparral types. Reseed- Deferred grazing may not be reseeding and grazing management . _ ing provides forage for game and desirable in true chaparral and in
livestock, provides a plant cover areas of interior live oak where LITERATURE CITED
beneficial in lessening soil erosion, browsing serves as the main con- AMERICAN FOREST PRODUCTS INDUS- furnishes competition to reduce trolling factor in brush suppression. TRIES, INC. 1945-1952. The effec- survival of brush seedlings, and In the manipulation of brush for tiveness of fire protection. Forestq supplies fuel for a subsequent reburn deer, adjustments in the acreage Digest 1945-1952, inclusive.
(Schultz and Biswell, 1952). Areas burned may provide a desirable BISWELL, H. H., R. D. TABER, D. W. HEDRICK AND A. M. SCHULTZ. of brush ash are prospective sites for tool in regulating utilization, and 1952. Management of chamise seeding. In true chaparral, the in maintaining a vigorous cover of brushlands for game in the north entire area of cleared brush may be desirable shrubs for deer browse. coast region of California. Calif.
reseeded. In the woodland-grass Fish and Game 38: 453-484.
chaparral, only a small percentage Summary COOPER, W. S. 1922. The broad- sclerophyll vegetation of California. of the area cleared of brush might Many acres of wildlands in Carnegie Inst. Wash., Pub. 319. 124 need reseeding in areas wit!h enough California have decreased in produc- PP.
grass in the understory of brush tion as a result of invading brush FOWELLS, H. A. ANI) G. H. SCHUBERT. for natural reseeding (Fig. 5). A or chaparral. The brush occurring 1951. Natural reproduction in cer- number of perennial grasses and west of the Sierra crest may be tain cutover pine-fir st,ands of California. Jour. Forestry 49: 192- annual grasses and legumes have divided into three general types: 196.
been recommended as suitable for (I) the true chap&al, (2) the LOVE, R. M. AND B. J. JONES. 1952. reseeding burned sites (Love and woodland-grass chaparral, and (3) Improving California brush ranges. Jones, 1952). Fertilization is usually the timberland chaparral. In all Calif. Agr. IXxpt. Sta. Circ. 371. 38 un. beneficial, especially where legumes of these types, the hazard from SCHULTZ, A. M. ANI) H. H. BIS~ELI,. are seeded, but as yet this has not wildfires in summer is very great. 1952. Competition between grasses been done on an extensive scale. Increase in brush in many areas reseeded on burned brushlands in
seems to be a natural phenomenon California. Jour. Range Mangt. 5: Grazing Management which is favored by occasional 338-345.
WEEKS, DAVID, A. 1:. WIESLA.UDER, H. The type of grazing management fires without reburning, close graz- R. JOSEPHSON AND C. I,. HII,L. 1943. following removal of brush often ing that weakens the herbaceous Land utilization in the northern governs the effectiveness of brush cover, and rains late in the growing Sierra Nevada. Spec. Publ. of the control. Any system of grazing that season after most of the grasses Giannini Foundation of Agr. Kco- weakens the herbaceous cover also have dried. Factors that tend to Calif. 127 1)~. nomics, Univ. of Calif., Berkeley, lessens grass competition and favors retard the invasion of brush are WHYTE, R. O.- -1949. The provision of the invasion of brush. A system of moderate grazing, frequent burn- fodder in a Mediterranean environ- grazing that maintains a strong ing and browsing by deer and ment. Jour. Brit. Grassland So- herbaceous cover results in strong livestock. ciety 4: 33-45.
Grazing Crested Wheatgrass by Sheep
A. ‘I’. BLEAK AND A. PERKY PLUMMER Range Conservationists, Intermountain Forest and ment Station. U. S. Forest Service, Ogden, Utah
Range Experi-
P
LANTING depleted spring-fall range with adapted grasses in the Intermountain region is now an important enterprise. Crested wheatgrass (Agropyron cristatum) is presently the best for seeding these ranges and is in widespread use. This species has already been planted on approximately 1 million acres in the Intermountain West and prospects are t,hat there are at least 10 million acres where crested wheatgrass will be sown and where the grazing industry will ultimately depend on it. Seeded ranges repre- sent an outlay of from 5 to 12 dollars per acre and the grass usually requires protection from 2 to 4 years for successful establishment. To retain the income-producing value of such an investment these ranges should be grazed in a manner t>o maintain highest produ&ion over a long period of time. As a guide to management this paper reports the results of the first 7 years’ grazing of crested wheat- grass and secondary grasses with sheep on typically spring-fall range near Ephraim, Ut)ah. Although results are not final, they provide information that is useful in guiding management of seeded spring-fall ranges.Methods
Six I>$-acre pastures were con- structed on a 1940 seeding in which crested wheatgrass was the dominant species. Other seeded grasses occurring in the stand were beardless bluebunch wheat- grass (Agropyron inerme) and bulb- ous bluegrass (Pea bulbosa). These were included in the mixt(ure af a rate of 1 pound per acre. Five other grasses and two forbs were in- cluded at 5/i to 2 pounds per acre.
Three of the grasses, Sandberg bluegrass (Pea secunda), tall oat- grass (Arrhenatherum elatius) and slender wheatgrass (Agropyron tra- chycaulum) failed to establish them- selves as part of the stand. The two forbs Viguiera multijlora and arrow- leaf balsamroot (Balsamorhixa sagit- tutu) also failed to successfully establish. Indian ricegrass (Oryxop- sis hymenoides) and low creeping wildrye (Elymus simplex) were established as very minor COll- stituents.
Beginning in the spring of 1945 and continuing through 1951 t)he crested wheatgrass has been grazed with ewes and lambs to average utilization intensities of 59 percent (light), 7 1 percent, (moderate), and 88 percent (heavy), which are reasonably close to the original standards of 55, 70, and 90 percent planned for the respectjive inten- sities. In no year did removal of crested wheatgrass vary more than 5 percent from the desired utiliza- tion. These int)ensities may be unduly heavy for adequate soil protection, since recent research has indicated the importance of a cover of vegetation and litter for minimiz- ing surface runoff and soil erosion (Packer, 1951; Ellison, Croft and Bailey, 1952). Pastures have been moderately grazed in the fall (usually in November) in years when regrowth was adequate.
Percentage utilization by weight was determined by estimate (Pech- anec and Pickford, 1937) on thirty 9.6-square-foot plotIs in each pasture (Frischknecht and Plummer, 1949). Two pastures were assigned at random to each grazing intensity. Grazing was start)ed on one pasture of each grazing intensity when crested wheatgrass was 2 to 3
63
inches high (early), and on the other at an average of 13 days later when grass was 4 to 5 inches high (de- ferred). Spring grazing closed on all pastures at about the same date. April 14 and 27 have been the average starting dates for the respective grazing treatments and May 25 the average spring closing date.
Rambouillet sheep were used throughout the study. From two to five mature ewes between 3 and 6 years of age with single lambs were put in each pasture in the spring. Holdover ewe lambs, yearling ewes, and mature ewes were used in the fall. All sheep were weighed in the morning after a 12-hour shrink. A sheep day is considered to be a ewe for one day or a lamb for one day, since a ewe and her lamb will con- sume twice as much green forage as a dry ewe (Fleming, Miller and Young, 1930, 1931, and 1938).
64 A. T. BLEAK AND A. P. PLUMMER
bind (Convotvulus arvensis) occurred, but they were not thick enough to be a particular problem in getting the seeded grasses established.
Effects on Vegetation
As far as can be seen from the first 7 years of record, there is no dif- ference in vegetation between pas- tures where spring grazing started when crested wheatgrass was 2 to 3
inches high (early) or approxi-
mately 13 days later when crested wheatgrass was 4 to 5 inches high (deferred).
Spring herbage production fluc-
tuat,ed from year to year due to the effects of climate (Table I). Spring growing conditions were better than
average in 1945, 1947 and 1949,
about, average in 1946 and 1948, and
below average in 1950 and 1951.
The general reduction in grass
yields in all treatments in 1950 and 1951 is largely associated with the
lowest available moisture for growth in any period since 1934. Some of the general decrease in grass pro-
duction after 1947 probably re-
sulted from natural causes associ- ated with aging of the stand and commonly referred to as decadence.
Similar trends after 1947 were
determined in each pasture on a
12 x 14 foot plot that was com- pletely protected from grazing dur- ing the I-i-year period. This paral-
lelism in trends indicates that
factors other than grazing caused the general decline in yield. Barnes and Nelson (1950) noted a similar
trend in Wyoming where seeded
pastures, including crested wheat- grass, declined 25 percent from the second to the seventh year and 55 percent by the ninth year.
Table 1 reflects the differential effect of the three grazing intensities on production of crested wheatgrass just prior to early grazing. Yields at
Table 1. Green weight production at time sheep entered early-grazed pastures
Year
1945* 220
1947 382
1948 264
1949 303
1950 228
1951 116
Crested Wheatgrass
Bluebunch
Wheatgrass ) $$$~~s ) chge~~~~s 1 ‘Kg1 1 Total Pounds per acre
Lightly Grazed
- - T T 315
46 247 10 4 689
24 86 T 1 375
50 78 T 6 437
74 46 T 4 352
47 58 T 2 223
Moderately Grazed
1945* 250 - -
1947 334 33 260
1948 293 12 101
1949 300 52 94
1950 198 70 48
1951 115 35 59
358 633 406 449 318 211
Heavily Grazed
1945* 243
1947 287
1948 236
1949 244
1950 133
1951 68
- 18
6 2
T
- 226
76 112 54 51
T
3 T
T 8
T 6
T 2
T 341
536 321 366 194 121
* In 1945 no separation was made between bluebunch wheatgrass and bulbous bluegrass.
this period are used because they
permit an evaluation without the
complication of current grazing and are a fairly good indicator of vigor.
Production of crested wheatgrass
under the three grazing intensities was similar at the beginning of the study. A relative decline in produc-
tion was apparent under heavy
grazing after 2 years of treatment,
as shown in the 1947 herbage
inventory. By the seventh year
pronounced differences were mani-
fest under heavy as compared with light and moderate grazing. Little difference could be detected between light and moderate grazing.
Evidently taking as much as 71
percent of the herbage permitted
crested wheatgrass to maintain
production that was comparable on
the average to production under 59 percent utilization. Even under 88 percent utilization, crested wheat-
grass shows remarkable ability to
persist, although there is 110 doubt that the plants have been severely injured. One of the first signs of heavy use was the tendency of the grass foliage to lie almost prostrate on the ground in the early spring. Another indicator of deterioration
was the marked tendency for
crested wheatgrass clumps to die in the middle and break up into ap- parently individual plants.
The most striking indicator of
grass stand deterioration under
heavy grazing was a progressive
increase of Russian thistle from
1948 to 1951. In 1951 production
of this summer-growing annual
under heavy use was approximately five times greater than under light or moderate use (Table 2). Russian thistle plants in the lightly and
moderately grazed pastures were
confined to scattered openings and
small, heavily-used spots. Under
heavy grazing they were general
over the pastures and in many
GRAZING CRESTED WHEATGRASS 65
t,he summer, it provided no forage in the spring months.
Bluebunch wheatgrass and bulb-
“us bluegrass occur as secondary
components in the pastures. By
1948, the third year of grazing, many bluebunch \vhcatgrass plants had died in t,he heavily-grazed pastures, and by 1951, t,he seventh year, very little of this grass xvas
left. This high mort,ality resulted
despite the fact that bluebunrh
wheatgrass was utilized to an
average of only 67 perrent in the
heavily-grazed pasture compared to
an average of 88 percent for crested
wheatgrass. Because of its upright
habit and lack of basal leaves 67-
perrent use removed practically all
the foliage of this grass. Under
light and moderate grazing, where
Table 2. Number of plants and yield of Russian thistle in ,951 under three
intensities of sheep use
Intensity 1 Y”& 1 Production
crested whcatgrass MXS utilized to
an average of 69 and il percent,
bluebunch vheatgrasa was utilized
only 14 and 1G percent. IYnder this
use it is maintaining itself and
many plants arc becoming large,
ungrazed ‘%olf planta” (Fig. 1).
There is no evidenre that grazing bulbous bluegrass t,o an average of
61 percent in the heavily-grazed
pasture has materially affected its
production or vigor. A much lighter average utilization of this grass, 30 and 34 percent, was “bt,ained in the
lightly- and moderately-grazed pas-
tures. Bulbous bluegrass shorn a
fluctuating production under all
‘intensities of use. It has a prolif-
erating bulb vith a shallow,
temporary root system. Former
studies (Plummer, 1943) have show1 that the roots of this grass dry up
and deteriorate wit,h the onset of
high tcmperntures, and when mois-
turc and temperatures are suitable
in the fall new roots grow out from
the bulb. Consequent~ly its main
groxi-th is made before the middle of May, and since t,he foliage was usually drying at this time sheep
reased to graze it. However the
bulblets produced on the seed stalk in place of seed are avidly eaten.
This study has furnished some
information on the seeding of blue-
burwh wheatgrass and bulbous
blocgrass in mixture v+th crested
x-h&grass. Beanwz of the low
prrference of shwp for bluebunrh
whcatgrass vhen grwing with
rrcstrd wheat,grass under light and modcrate grazing, its use in mixture
with crested whcatgraas is not
rwommended. If bluebunch wheat-
grass is used these results suggest that it should br planted alone in separate units and used in rotation \vith crested wheatgrass.
Considerable conjwture exists as
t,o the value of bulbous bluegrass in
mixture \vith crested n.heatgrass.
Bulbous bluegrass does servr a “se-
ful pupow by producing highly
pslatahle forage soon after the snow
melts in spring. Even in dry years there is enough moisture for this grass to make fair growth. Biggest
fluctuations in yield are caused by
periods of low temperature after
spriug growth begins, rather t,han
by lack of moisture. Whether one
should use it in a mixture is a
matter of personal choice and need. Some feel the presence of bulbous
bluegrass with crested wheatgrass
rrsults in less total yield because of
less efficient use of moisture hy
bulbous bluegrass. Honww, this as-
pect must be determined by future nwarch.
Sheep Days
During the first three years of
treatment the heavily-grazed pas-
tures furnished materially more
sheep-days per awe in the spring
than the moderately- and lightly-
grazed pastures (Fig. 2). During the
last four yrars of treatment the
moderately- and heavily-grazed
pastures Rsrh furnished about the
same number of sheep days. In tro of these years, 1948 and 1951, sheep
days’ use from moderate grazing
66
A. T. BLEAK AND A. P. PLUMMER
YEAP ! 1945 1946 1947 1948 1949 1950 1951
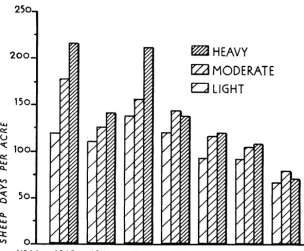
FIGURE 2. Sheep days per acre under three intensities of spring grazing during a
m HEAVY
m MODERAT
m LIGHT
E
7-year period.
grazing, and in 1951, the seventh year, light grazing produced very nearly the same number of sheep days as heavy grazing. The relative difference in sheep days furnished by moderate and light grazing re- mained fairly constant during the study period.
Sheep days provided by the pastures varied widely in different years. The fluctuations between 1945 and 1948 are presumably attrib- utable to more favorable conditions for plant growth in 1945 and 1947 than in 1946 and 1948. The decline in sheep days in 1949, a year in which early production was fairly high as Table 1 shows, may possibly be due to the fact that the ewes were in very poor condition because of the shortage of feed they had suffered on their winter range in a winter of exceptionally deep snow, so that they ate more green grass than in other years. The pro- nounced decreases in 1950 and 1951 are to a large extent attributable to decreased forage production in two very dry years. Part of the decline between 1947 and 1951 is attribut-
able to decadence in the seeded stand already described.
Sheep Gains
Lamb gains per acre under the three intensities of use followed a pattern like that for sheep days. As shown in Table 3, average lamb gains per acre were greatest under the heavy intensity in 1946 and 1947, the first two years in which weights were taken. During the last 4 years, average gain per acre was greatest under the moderate inten- sity. This convergence of lamb gains between the heavy intensity and the moderate and light intensities parallels the similar convergence noted for sheep days. Although the heavily-grazed pastures produced slightly more lamb per acre for the six years in which weights were taken, the pronounced decline in lamb gains reflects deterioration of the grass stand under heavy use. Average lamb gains for all in- tensities averaged 0.60 pound per day per head and ranged from 0.51 in 1947 to 0.70 pound per day in 1951. Lambs in the moderately- and
heavily-grazed pastures made the same average gain per day, 0.58 pound, while lambs in the lightly- grazed pastures made a slightly greater gain, 0.64 pound. The dif- ference between light and heavy is statistically significant, but that between light and moderate is not. Although the gain in favor of light grazing appears small, over a 6- weeks’ grazing period it means a difference of 235 pounds per lamb.
Gain by mother ewes for the 6- year period averaged 0.18, 0.30, and 0.08 pound per day and 8.2, 15.7, and 5.6 pounds per acre in the lightly-, moderately-, and heavily- grazed pastures. However these gains are so variable between years that it is not possible to say that they represent a real difference be- tween treatments.
Table 3. Average lamb gain per acre under three intensities of use
Year
Intensity
Light 1 Moderate [ Heavy
1946 21.3
1947 30.3 1948 1 31.3
1949 29.7
1950 32.0
1951 24.3
Average . . 28.2
Pounds 27.3 35.0 33.0 50.3 44.7 35.0 28.3 31.7 32.3 37.7 26.3 22.7. --
32.0 35.4 ~~__
Fall Grazing
In two years, 1950 and 1951, there was not enough regrowth to permit fall grazing in the heavily-grazed pastures. For this reason no fall grazing use was allowed in the other pastures. During the five years that the pastures were grazed in the fall, the average number of sheep days’ use for light, moderate and heavy averaged 51,42 and 27, respectively. Greater production from lightly- and moderately-grazed pastures re- sulted from greater availability of old growth.
GRAZING CRESTED WHEATGRASS 67
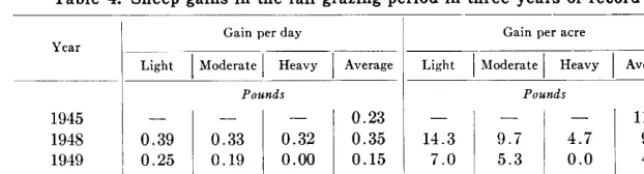
during the fall grazing period. In general sheep evidenced an ability to gain or maintain weight in the fall, particularly if their teeth were good. Average gain per day for all intensities was 0.23, 0.35 and 0.15 pound (Table 4). In 1949 sheep in the heavily-grazed pastures merely maintained their weights. This is attributed to the fact that snow covered the low regrowth, and since there was very little old growth above the snow the sheep couldn’t get enough to fill up.
In 1948 and 1949, light and moderate grazing in the fall pro- duced more gain per acre than heavy grazing because of the greater number of sheep days available and the higher gain per day. When fall gains are added to spring gains of ewes and lambs, the total gains per acre in 1948 were 53.3, 73.4, and 52.7, and in 1949, 55.0, 60.6, and 41.0 pounds for the lightly-, moderately- and heavily-grazed pastures, respectively. Thus sheep gains from moderate grazing are substantially greater than from heavy grazing when spring and fall grazing periods are considered to- gether.
Early Versus Deferred Grazing During the T--year study, the de- ferred pastures furnished 20 more sheep-days per acre per year than the early pastures. Nevertheless lambs in the early pastures made about 0.08 pound more gain per day, a difference that is statistically significant. This advantage tends to make gains per acre in the early and deferred pastures about equal. Since ewes and lambs in the early pastures made better gains per acre with fewer sheep days, it would ap- pear that sheep starting t,o graze early actually consumed a greater volume of grass per head than sheep starting to graze about 2 weeks later. This is largely attributable to greater succulence of grass in the early period. The question arises as
Table 4. Sheep gains in the fall grazing period in three years of record
Gain per day Gain per acre Year
Light Moderate Heavy Average Light 1 Moderate 1 Heavy 1 Average
1945 1948 1949
Pounds
11.9 9.6 4.1
to which would be the best date to start grazing crested wheatgrass. From the standpoint of the vegeta- tion it evidently makes no dif- ference so long as the grass is not too heavily used at the close of the grazing season. If the primary con- cern is getting the lambs to gain as fast as possible, grazing early is to be preferred.
Summary and Conclusions
Because of the low preference of sheep for beardless bluebunch wheatgrass under light and moder- ate grazing as compared to crested A grazing study with sheep was conducted on six I$&acre dryland pastures in typical spring-fall range in Utah with crested wheatgrass as the dominant species. Beardless bluebunch wheatgrass and bulbous bluegrass occurred as secondary components. Three intensities of use were applied (light, moderate and heavy) with grazing starting when crested wheatgrass was 2 to 3 inches high (early) and 4 to 5 inches high (deferred). After seven years of grazing, injurious effects are obvious where crested wheatgrass has been heavily utilized (88 per- cent use). Under heavy grazing, production has decreased, most grass clumps have died in the middle, plants are small, and there is a marked growth of Russian thistle generally over the pastures. Although production has declined with aging of the seeded stands, crested wheatgrass appears to have maintained equally good production under light (59 percent) and moder- ate (71 percent) use during this first seven years.
wheatgrass, its use in mixtures with crested wheatgrass is not recom- mended. Bulbous bluegrass has maintained itself well in stands of crested wheatgrass. Its use in mixtures with crested wheatgrass depends on the need for early forage and on personal preference. If grazing is deferred until late spring, inclusion of bulbous bluegrass in mixtures with crested wheatgrass is of questionable value.
Sheep days’ use declined sharply in the heavily-grazed pastures as compared with t’he lightly- and moderately-grazed pastures after three years of treatment. During the ’ following four years, the moder- ately- and heavily-grazed pastures each furnished about the same number of sheep days.
The trend in lamb production per acre was similar t’o the trend in sheep days. Lamb gains were slightly greater in lightly-grazed pastures than in moderately- and heavily-grazed pastures. Average lamb gain for all intensities varied from 0.51 to 0.70 pound per day.
No permanent differences in vegetation were apparent between pastures where spring grazing started when crested wheatgrass
68 A. T. BLEAK AND A. P. PLUMMER
was 2 to 3 inches high and those - LITERATURE CITED nique for determining herbage
where grazing started approximately BARNES, 0. K. AND A. L. NELSON. 1950. production on range and pasture
land. Agron. Jour. 41: 63-65. 13 days later when crested wheat- Dryland pastures for the Great Plains. Wyo. Agr. Expt. Sta. Bull. PACKER, PAUL E. 1951. An approach grass was 4 to 5 inches high. During 302. 30 pp. to watershed protection criteria. the 7- year period, the deferred ELLISON, LINCOLN, A. R. CROFT AND Jour. Forestry 49(9) : 639-644.
REED W. BAILEY. 1951. Indicators PECHANEC, J. F. AND G. D. PICKFORD. pastures furnished an average of 20 of condition and trend on high range 1937. A weight estimate method more sheep-days per acre per year watersheds of the Intermountain Re-
than the early pastures. Never- FLEMING, CHARLES E., M. R. MILLER gion. U. S.Dept. Agr. Hdbk. 19.66 pp.
for the determination of range or pasture production. Amer. Sot. Agron. Jour. 29 : 894-904.
theless, in the early pastures, lambs _ _ AND A. YOUNG. i930, 1931, and PLUMMER, A. P. 1943. The germina- made 0.08 pound greater gain per 1938. Nevada Reprints. tion and early seedling development
FRISCHKNECHT, NEIL C. AND A. PERRY of twelve range grasses. Amer. Sot. day. PLUMMER. 1949. A simplified tech- Agron. Jour. 35 : 19-34.
I .
NUMBER ONE OBJECTIVE FOR 19544,000 MEMBERS
What will that do to help the Society?
1. It will put that many more broad shoulders to the wheel of progress in achieving the objectives of our Society.
2. It will strengthen our financial position by:
a. Bringing in more dues.
b. Putting our Journal in a higher bracket of payments for advertising space.
c. Making our Journal more attractive to ad- vertisers because of wider distribution.
Does our financial position need strengthening? Yes. It’s not shaky, but that is because we are operat-
ing to a great extent on contributed services. Con-
tributed services are “when-we-can” services. Our Society must this year begin paying a partial salary to our Executive Secretary. We need a full-time executive secretary and a full-time editor. We also need a “home”. The pay-off to you will be a better Journal, more and better sectional activities and a better Society all-round.
Our figures show that we are nowhere near saturation point in any class of membership. We can reach our objective among the same high classes of people we have in the Society now.
We’ve given the special reasons for making this a
special objective. Now, what is needed is a special
effort . OK?--FEoyd D. Larson, President.
CONSERVATION AWARDS MADE BY NASH COMMITTEE
Awards of $500 each were presented on January 7, 1954 by GEORGE W. MASON, presi- dent of the Nash-Kelvinator Corporation, to ten professional workers for their outstanding contributions to the field of conservation of our national resources. In addition, the Nash Conservation Awards Committee presented medals to ten individuals in recognition of their acts of good citizenship in fostering better conservation methods. Award winners were selected from among more than 700 nominations submitted by officials of state, federal and private conservation agencies, and professional writers on conservation topics.
Fertilization of Some Range Soils in the
Rocky Mountains
JOHN L. RETZER
Soil Scientist, Rocky Mountain Forest and Range Experiment Station, Fort Collins, Colorado1
S
OIL fertilization is a tool that may be used in range manage- ment for improvement of quality and quantity of forage. It has potential value in reseeding oper- ations to increase initial survival and subsequent growth and in the recovery of poor and depleted native ranges. Fertilization research on range soils in the Rocky Moun- tains is relatively new. Only re- cently has much attention been given to increasing the productive- ness of native ranges. One of the major problems is to determine which soils or groups of soils will respond to fertilization since effort would be wasted in treating soils with a favorable fertility status.The Intermountain Forest and Range Experiment Station con- ,ducted fertilizer studies a few years ago in which a response was ob- tained with nitrogen (N). Other- wise the results were inconclusive. The results were not published. The staff of the Forestry and Range Management Section of the Colo- rado Agricultural Experiment Sta- . tion (1952) is currently conducting tests with nitrogen and phos- phorus (P) on soils growing native shortgrass and mixed-prairie range types. Nitrogen has given both a quantitative and qualitative re- sponse on the herbage whereas P has given only a qualitative response. The soils have medium textures and are neutral or calcareous in reaction. Currently the economy of such
1 Maintained by the Forest Service, U. S. Department of Agriculture, for Arizona, Colorado, Kansas, Nebraska, New Mexico, South Dakota, west Texas and Wyoming, with headquarters at Colorado A & M College, Fort Collins, Colorado.
applications to native range soils appears questionable.
Work by Brouse (1952-53) on meadow soils in the sandhill region of Nebraska has shown that native plants in moist meadows benefit from commercial fertilizers, but differences in soil, plant species and moisture supply caused much vari- ation in results. Phosphorus favored the establishment and maintenance of legumes in these subirrigated meadows whereas a combination of N and P resulted in the best hay yields. Potassium (K) had a minor effect on hay yields. It is question- able that the increased yields will justify the cost of fertilization.
DeLand (1952) reported that profitable increases in production from mountain and intermountain soils can be obtained by applying 250 to 300 pounds of treble super- phosphate on alternate years and 40 to 50 pounds of available N annually. The work was done in Montana on irrigated pastures.
Much work is being done by the Colorado Agricultural Experiment Station and cooperating agencies on irrigated mountain meadow soils in the Rocky Mountains. Reports have been given on this work by Nelson (1952) and others. In general, N consistently increases the yield of grasses and usually depresses legume growth. Phosphorus produces no growth on grasses and is somewhat erratic on legumes, but the quality of the forage is improved. The soils of mountain meadows are com- monly neutral or calcareous, and water tables are usually high.
Much of the research on range and pasture soils has dealt with the primary or major elements, namely,
69
N, P and K. However, in recent years attention has been sharply drawn to the need for trace or minor elements on some soils throughout the world. The minor elements are iron (Fe), manganese
(Mn) , boron (B), zinc (Zn) and
copper
(Cu) .
A third group some-times referred to as secondary ele- ments or soil amendments has resulted in increased yields on some soils. These elements are calcium (Ca), magnesium (Mg) and sulfur (S). The response from additions of any of these elements will depend upon the deficiencies of the par- ticular soil being tested.
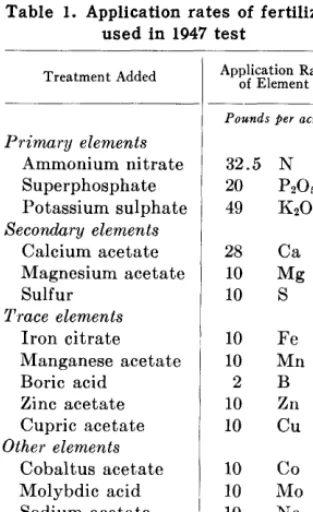
The determination of the role of minor elements in herbage growth seems to have been a secondary development, following other at- tempts to correct certain livestock disorders. In some places large in- creases of herbage result from ap- plications of minor elements. Much of the literature deals with pasture research in New Zealand, Australia and England; research with minor elements on range soils in western United States is almost negligible. The worldwide work on minor ele- ments has been gathered and excellently discussed in the Bibli- ography of the Literature on the Minor Elements (Chilean Nitrate Educational Bureau, Inc., 1948-53). Many native ranges are too steep or too rocky to cultivate or reseed. If the surface application of com- mercial fertilizers would improve herbage growth, then fertilization could be a management tool for such lands. In 1947 this study was estab- lished to determine the results of top dressing range soils in the Rocky Mountains with 14 fertilizers and soil amendments.
70 JOHN L. RETZER
Table 1. Application rates of fertilizers used in 1947 test
Treatment Added Application of Element Rate
Primary elements Ammonium nitrate Superphosphate Potassium sulphate Secondary elements
Calcium acetate Magnesium acetate Sulfur
Trace elements Iron citrate Manganese acetate Boric acid Zinc acetate Cupric acetate Other elements
Cobaltus acetate Molybdic acid Sodium acetate
Pounds per acre
32.5 N 20 PzO5’
49 K202
28 Ca
10 Mg
10 s
10 Fe
10 Mn
2 B
10 Zn
10 cu
10 co
10 MO
10 Na
l Equivalent to 8.7 pounds of P. 2 Equivalent to 40.7 pounds of K.
Replicates were established on each soil. The placement of fertilizer in the plots was by random selection. Because the quantity of fertilizer for each plot was small, it was thoroughly mixed with local soil to obtain sufficient volume to spread evenly by hand over the plot. The 1947 treatments were top-dressed only; the 1949 treatments were worked into the surface soil with a hoe in those spots not covered with plants. The application rates and the 14 fertilizers used in the 1947 treatment are shown in Table 1. The rates and fertilizers used in 1949 are shown in Table 2.
The lime used in the 1949 treat- ments had a neutralizing value of 110 percent in terms of CaC03, indicating the presence of some magnesium carbonate. Phosphorus was applied as treble superphos- phate (46 percent P,O,); potash as potassium sulphate (49 percent KzO); and nitrogen as ammonium nitrate (32.5 percent N). The complete set of treatments (Table 2) was added to all sites except those soils from Morrison shale, basalt and andesite. To these three soils, only the complete treatment of
lime plus NPK was added. The 1949 treatments were placed on old plots of the 1947 treatments which had never shown a response or where the original response had played out (Table 2).
In all tests response was evalu- ated by increased height of leaves and seed stalks, and by color changes compared to that of the plants in the check plots.
Soil samples for laboratory anal- ysis were taken from untreated portions of each site and combined into a composite sample. Texture analyses were made by the hydrom- eter method with 30-percent Cal- gon solution as a dispersing agent. Soil acidity was measured with the glass electrode. Exchangeable bases and exchange capacity were de- termined by the ammonium-acetate displacement method for calcium and magnesium. Potassium and sodium were determined by the flame photometer. Phosphorus was measured by the sodium bicarbonate method of Olsen et al. (1954).
Characteristics of Areas Tested Characteristics of the seven areas tested are shown in Table 3. The ponderosa pine areas have a range in annual precipitation of 15 to 25 inches while the spruce areas have 30 inches or more. The range con- dition varied among the soils se- lected from good to depleted.
The data in Table 4 show that the soils from granitic rocks contain large amounts of gravel and none contain more than 43 percent silt- plus-clay. The other soils contain from 53 to 65 percent silt-plus- clay. In comparison, good farming soils contain from 60 to 90 percent silt-plus-clay.
The degree of soil acidity exerts a strong influence on the availability of the different plant nutrients in soils (Truog, 1946). The most desirable conditions exist between pH 6.0 and 7.5. The soils tested generally fall within this range (Table 4), and no difficulty should be expected from the soils being either too acid or basic. Field
Table 2. Application rates of fertilizers used in 1949 test
Treatments Added
Ca (lime) Ca + P Ca + K Ca+P+K Ca+N+P+K
Application Rate of Element
Ca 1-1 P206 K20 [N
Pow& per acre 500
500 3001
500 5002
500 300 500
500 300 500 200
Placement on 1947 Plots
Ca P K N MO
l Equivalent to 131 pounds of P. 2 Equivalent to 415 pounds of K.
Table 3. Parent material and vegetational characteristics of the seven soils tested
Soils Developed from
Granitic alluvium Granite-gneiss
bedrock Granite bedrock Andesite bedrock
Ancient alluvium 9,000
Basalt bedrock 10,500 Morrison shale 9,000 Approx- imate Elevation (feet) -_____ 7,500 9,500 8,500 10,000
Plant Cover
I
l-l-l--
Ponderosa pinePonderosa pine
1 F:z;eded 1 ; ~ ;z ~ fbi
Ponderosa pine Ponderosa pine
-fir Spruce Spruce Spruce-aspen
Poor 8 10 Low
Good 20 25 High
Depleted 8 22 Low
Fair 16 25 Good
FERTILIZATION OF RANGE SOILS 71
examinations showed that the or- ganic-matter content is decidedly higher for soils developed from shales, andesite and basalt than in soils from granites.
The exchange capacity is a measure of the total capacity or ability of the soil to hold readily available nutrients. The data in Table 5 show remarkable differences between groups of soils in this respect. Exchangeable bases are the plant nutrients that are readily available to plants through the soil solution. The data show that the exchangeable-base contents of the soils differ a great deal. The soils from shale are much higher in Ca and K than all other soils; those from granitic parent materials are very low in Ca, Mg, and K; those from basic igneous parent materials are intermediate in fertility status. The pounds per acre of P,Os as <determined by the sodium bicar- bonate test are shown in Table 5. By t)his test a definite response will be obtained from phosphate ferti- lizer when the test falls below 25 pounds per acre; between 25 and 50 pounds, a probable response is expected; a possible but unlikely response is expected when the values are between 50 and 75 pounds; and no response when the t)est is above 75 pounds per acre. The results show that all soils are out of the first or deficient class and probably contain adequate phos- phorus for the growth of native vegetation. Three of the soils are very high in phosphqrus.
Results and Discussion Fertility is an inherent char- acteristic of the soil. Plants will respond to fertilizer applications when the fertility status of a soil is low or unbalanced, but they will not respond when the fertility status is high and well balanced. Because of difficulties in locating areas protected from grazing it was not possible in this study to secure a uniform plant condition for all
Table 4. Mechanical composition and acidity of soils tested
Mechanical Composition
Gravel
More than 2 mm.
Soils I&zv;loped Soil
acidity Clay
Less than 0.02 mm.
Percent PII
6.2 5.7 6.5 6.4 6.1 5.6 6.0
Granitic alluvium 21.3 45.0 20.5 13.2
Granite-gneiss bedrock 13.0 44.2 27.4 15.4
Granite bedrock 56.0 22.0 15.3 6.8
Andesite bedrock 15.4 31.5 32.3 20.8
Ancient alluvium 9.7 24.8 42.8 22.8
Basalt bedrock 14.4 29.1 27.2 29.3
Morrison shale 19.8 16.8 45.3 18.1
Table 5. Readily available nutrients of the soils tested
Available Nutrients Present
Soil Parent Material
Exchange Capacity’
I-
Ca Mg K PZOSLbs./A m.e.
m.e. Lbs./A
Lbs./A m.e.
m.e. Lbs./A Lbs./A
_
4.9 1,952 1.8 433 0.5 404
6.6 2,624 1.5 355 0.3 224
7.6 3,040 1.7 416 0.4 324
12.9 5,152 2.8 693 1.2 914
11.2 4,500 2.4 586 0.3 264
11.8 4,704 3.5 846 0.6 482
23.0 9,208 2.1 508 2.0 1,544 Infertile soils
Granitic alluvium Granite-gneiss
bedrock Granite bedrock Fertile soils
Andesite bedrock Ancient alluvium Basalt bedrock Very fertile soils
Morrison shale 1
7.6 3,048 11.4 4,552
11.7 4,672
18.0 7,204 15.5 6,208 20.6 8,248
32.0 12,800
44 104
53
143 53 44
92 -
1 The total amount of available nutrients present expressed as milli-equivalents (m.e.) per 100 gm. of oven-dry soil. All conversions from m.e. to pounds per acre on basis of 2 million pounds of soil in top 7 inches of surface.
soils tested, but regardless of vari- Muhlenbergia montana-N, K, ations in kinds of plants or in range NPK, PK
condition the response of the Artemisia frigidaN, NPK native vegetation should give an Andesite bedrock :
indication of the fertility status of
Grasses--$, Forbs-5, Shrubs-2
each soil. The treatments that Ancient alluvium : Grasses-5, produced a response on the plants Forbs-4, Shrubs--O
are shown in the tabulation below Bromus pumpellianus (?)-N for each of the seven areas tested. Festuca ovina-N
Granite alluvium : Grasses-l, Forbs--O, Shrubs-l
Bromus inermis-K, N, NPK Artemisia frigidaN, NPK Granite-gneiss bedrock : Grasses-
6, Forbs-4, Shrubs-2
Muhlenbergia $liculmis-~T, K, NPK
Basalt bedrock : Grasses-5, Forbs -10, Shrubs-O
Morrison shale : Grasses-6, Forbs -8, Shrubs--O
Poa pratensis-N Poa ampla (?)-N
The numbers of grasses, forbs and shrubs present are shown for Artemisiafrigida-NPK, K(?), N each of the seven areas in the Granite bedrock: Grasses-2, Forbs above tabulation. Altogether 18
-5, Shrubs-l grasses, 25 forbs and 3 shrubs
Festuca arixonica-N, K, NPK, were identified but in no instance
72
soils. These tests were designed to determine nutrient deficiencies in soils as shown by the plants present and not to compare responses be- tween species of plants or the same species on all soils. However, it is interesting to know that Festuca arixonica responded to the N, K, NPK, and PK treatments on soils developed from granite bedrock but not on soils developed from andesite. Mwh,lenbergia montana responded similarly. Poa pratensis responded to N on soils from Morrison shale but not on soils from basalt bedrock. Artemisia frigida showed marked response to various treatments con- taining N on all soils from granitic materials but not from soils on andesite.
Plants on soils from granitic materials responded the best to the fertilizers added. Plants on soils from ancient alluvium and Morrison shale responded only to N and then only by a deeper green color of the foliage. Plants on soils from andesite and basalt responded to no treat- ment. This behavior was strongly supported by laboratory analyses of the soils (Table 5). From the com- bined field tests and laboratory data it is possible to establish three classes for the soils of this study, namely, (1) infertile soils-derived from granitic rocks; (2) fertile soils-derived from basic igneous rocks, and (3) very fertile soils- derived from shales. This grouping has been made in Table 5.
An examination of the percent ages of silt and clay (Table 4) shows an increase from the infertile to the fertile and the very fertile soil groups. The increased amounts of silt and clay favor the retention of soil moisture and this, in combi- nation with the fertility levels, has a marked effect on the total pro- ductivity of each of the seven soils. The major elements, N, P and K, produced the only responses in the plants of these tests. Nitrogen resulted in a greening of herbage and increased growth on soils from
JOHN L.
RETZER
granites, a greener color on soils from Morrison shale and ancient alluvium, and no response on soils from andesite and basalt. The only marked increase in growth occurred in Bromus inermis on soils from granitic alluvium, and here the herbage volume was 75 to 100 per- cent greater and the seed-stalk heights 2 to 4 inches higher than on adjacent unfertilized plots. Arte- misia frigida, an undesirable shrub, responded strongly to N on all soils where it was present except those from andesite. In this study, the effects of N did not extend over a period of more than two years.
Phosphorus and K produced no noticeable results on soils from basalt, andesite, ancient alluvium or Morrison shale in either the 1947 or 1949 treatments. This suggests that additions of P and K to these soils would not be necessary.
Inconclusive results were obtained from P and K on soils developed from granitic materials. It has been shown in Wisconsin (1951) that soils from granite rocks may be deficient in K to the extent that small additions of K are ineffective. Large additions gave a marked increase in alfalfa yields. Accord- ingly, the application rate of K in these tests was greatly increased in 1949 over that in 1947 (Table 2). As a result K alone and as KP produced a response on the granitic soils but the response was not strong. Phosphorus alone never resulted in a noticeable increase in herbage in either the 1947 or 1949 applications. This response checks with the laboratory tests for PZ05 shown in Table 5. Likewise, P is rarely effective when applied as a top dressing.
None of the secondary, trace or other elements in Table 1 produced a quantitative response in any of the plants on the seven soils during the 5 years of the study. These elements have wide ranges in solubilities, some being very in- soluble, but all were applied on the
possibility that shallow roots of the plants might be effective in extrac- tion of nutrients from near the surface of the soil. It seems reason- able to conclude that none of the soils tested are deficient in the minor elements. All are soils whose parent materials are from rocks in their first weathering cycle and hence the diverse minerals in these rocks possibly supply all nutrient requirements of the native plants. Morrison shale, the only sedi- mentary rock, is high in nutrients of all kinds.
A greater and more prolonged response was obtained from the 1949 treatments over those of 1947. This is attributed to the larger quantities of fertilizers used. The soil needs were not satisfied (materials were absorbed by the clays) by the 1947 treatments and the nutrients were not available to the plants on the infertile granitic soils.
This experiment was designed to test response from top dressings of fertilizers. Top dressing is a satisfactory method of application for nitrogen and readily soluble salts but is less satisfactory for salts of low solubility. Ordinarily fertiliz- ers are worked into the soil but cultivation is impossible in most mountain soils and if fertilizers are used they must be top-dressed.
No attempt was made to compare herbage weights on the different treatments; neither were costs of increased forage computed as a ba- sis for practical ranching opers- tions. These points are the subjects of more extensive experiments now being conducted.
Summary