Status of the UCN
τ
experiment
R.W. Pattie Jr.1,2,a, N.B. Callahan3, C. Cude-Woods1,4, E.R. Adamek3, M. Adams5, D. Barlow1, M. Blatnik6, D. Bowman7, L.J. Broussard7, S. Clayton1, S. Currie1, E.B. Dees4, X. Ding8, D. Fellers1, W. Fox3, E. Fries6, F. Gonzalez3, P. Geltenbort9, K.P. Hickerson6, M.A. Hoffbauer1, K. Hoffman5, A.T. Holley5, D. Howard5, T.M. Ito1, A. Komives10, C.Y. Liu3, M. Makela1, J. Medina1, D. Morley1, C.L. Morris1, T. O’Connor3, S.I. Penttil¨a7, J.C. Ramsey1,7, A. Roberts1, D. Salvat11,
A. Saunders1, S.J. Seestrom1, E.I. Sharapov12, S.K.L. Sjue1, W.M. Snow3, A. Sprow13, J. Vanderwerp3, B. Vogelaar8,
P.L. Walstrom1, Z. Wang1, H. Weaver1, J. Wexler4, T.L. Womack1, A.R. Young4, and B.A. Zeck4
1Los Alamos National Laboratory, Los Alamos, NM 87544, USA
2Department of Physics and Astronomy, East Tennessee State University, Johnson City, TN 37614, USA
3Center for Exploration of Energy and Matter and Department of Physics, Indiana University, Bloomington, IN 47408, USA 4Triangle Universities Nuclear Laboratory and Physics Department, North Carolina State University, Raleigh, NC 27695, USA 5Department of Physics, Tennessee Technical University, Cookeville, TN 38505, USA
6Kellog Radiation Laboratory, California Institute of Technology, Pasadena, CA 91125, USA 7Oak Ridge National Laboratory, Oak Ridge, TN 37831, USA
8Department of Physics, Virginia Polytechnic Institute and State University, Blacksburg, VA 24061, USA 9Institut Laue-Langevin, Grenoble, France
10Department of Physics and Astronomy, DePauw University, Greencastle, IN 46135, USA
11Center for Experimental Nuclear Physics and Astrophysics, University of Washington, Seattle, WA 98195, USA 12Joint Institute for Nuclear Research, Dubna, Moscow region 141980, Russia
13Department of Physics and Astronomy, University of Kentucky, Lexington, KY 40506, USA
Abstract. The neutron is the simplest nuclear system that can be used to probe the structure of the weak interaction and search for physics beyond the standard model. Measurements of neutron lifetime andβ-decay correlation coefficients with precisions of 0.02% and 0.1%, respectively, would allow for stringent constraints on new physics. The UCNτ experiment uses an asymmetric magneto-gravitational UCN trap with in situ counting of surviving neutrons to measure the neutron lifetime,τn =877.7s (0.7s)stat(+0.4/−0.2s)sys. We discuss the recent result from UCNτ, the status of ongoing data collection and analysis, and the path toward a 0.25 s measurement of the neutron lifetime with UCNτ.
1. Introduction
For over a decade a significant discrepancy has persisted in measurements of the neutron lifetime performed using bottled ultracold neutrons (UCN) and cold neutron beams
[1]. Experiments using material bottles to trap UCN and
count the surviving neutrons after a holding periods on the order of the neutron lifetime measured aβ-decay lifetime,
τn, roughly 10 s shorter than the beam experiments. A
systematic shift because of unidentified losses induced because of interactions with material surfaces could account for the lower lifetime in the bottle experiments. Magnetic confinement of UCN, using the spin-dependent potential experienced by the neutron in a magnetic field
B, V =−µ· B, where µ is the magnetic moment of the neutron, is one method that several experiments have sought to use to eliminate material interactions [2–6] and associated losses. Another effect that may contribute to a shorter measured lifetime is the presence of quasi-bound UCN whose energy is above the trapping-potential, but exist in semi-stable orbits for a significant time such that
ae-mail:[email protected]
they are counted at short times, but escape the trap prior to longer storage times.
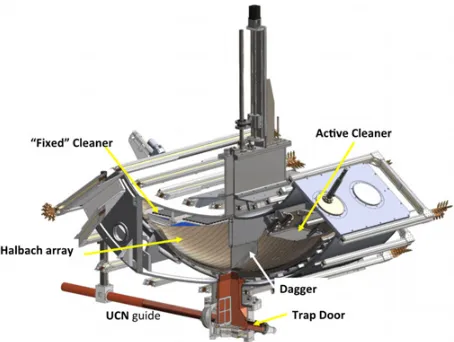
The UCNτ experiment, shown in Fig. 1, was
designed to combine a magneto-gravitational trap with an asymmetric geometry in an attempt to eliminate material interactions during storage and to rapidly mix the semi-stable trajectories of above-threshold UCN with escape trajectories, thereby eliminating two effects described above. In addition to the asymmetric geometry of the trap,
UCNτ employs two absorbing variable-height cleaners
(one polyethylene and one 10B coated ZnS:Ag “active”
cleaner) that cover approximately 50% of the horizontal area of the trap and an in situ detection system, referred to as the dagger detector. The dagger detector can be lowered into the trap to “unload” UCN as a function of height. Varying the speed, counting heights, and counting duration allows for the investigation of systematic effects including: phase-space evolution, insufficient cleaning of above-potential UCN, and mechanical heating. The design, commissioning, and initial results of UCNτ,τn= 878.1(2.4)stat(0.6)syss, are reported by Morris et al. [7].
Figure 1. A cut-away view of the UCNτtrap.
measurement of τn=877.7s (0.7s)stat (+0.4/−0.2s)sys, reported by Pattie et al. [8].
2. Experimental operation
2.1. Run cycleThe UCNτ run cycle is comprised of five operations:
filling, cleaning, holding, counting, and background measurements. In each operation the duration and position of the dagger detector and movable cleaners can be adjusted to alter systematic effects such as spectral
evolution. The dagger detector has 10B coated ZnS:Ag
sheets optically coupled to both sides of a thin acryllic sheet, the lower edge of which is shaped to follow the curvature of the magnetic trap. Wavelength shifting fibers embedded in the acryllic capture scintillation light from the ZnS:Ag and guide it to two photo-multiplier tubes (PMT). A multichannel scaler (MCS) records the output from a leading-edge discriminator to determine the single photon rate from the two PMT’s. The count rate can be analyzed offline either as singles or by applying an algorithm to identify UCN capture events by the coincidence in the arrival time of a collection of singles. Operation of the experiment and the analysis techniques for the reconstruction of singles or coincidence events in the dagger detector are described in Refs. [7,8]. Here we provide a summary of the run sequence and blinding methods used during the 2017 data collection.
2.1.1. Filling
In the initial state of the experiment the entire UCN guide system is empty and the proton beam to the spallation target has been for several minutes. After a test sequence of pulses from the accelerator a gate-valve between the source and the apparatus is opened and the proton beam is delivered to the tungsten target. A segment of the Halbach array is retracted to allow UCN to fill the trap with a time constant ofτf ill ∼70 s. For the data collected in 2017 for the lifetime measurement the trap is filled for 150 s.
A trio of 10B coated ZnS:Ag detectors, mounted at
guide height upstream of a 6 T polarizing magnet, monitor the flux of unpolarized UCN into the experiment hall [9]. Each of these detectors is sensitive to a different part of the UCN velocity spectrum: two detectors have different
Time [s]
0 200 400 600 800 1000 1200 1400 1600
]
-1
Rate [s
1 10 2 10
3 10
Dagger Coincidence Rate
Holding
Cleaning
Filling
Counting
Figure 2. Dagger UCN rate using the coincidence method is shown for a typical long holding time nine-step unloading run from the 2017 data. The blue hashed area between t∈(0,150) s represents the filling period. The rates shown in green are during the cleaning phase and the black histogram shows the background rate during holding. Bins colored red are during the unloading or counting period.
thicknesses of10B (15 nm & 50 nm) and the third detector
has a 25µm aluminum foil covering the10B coating (see
[10] for an estimate of the detector efficiencies).
The flux of UCN filling the apparatus is monitored with three additional detectors mounted on a vertical guide downstream of the polarizing magnet. Two 2.54 cm diameter detectors are mounted on the side of the vertical guide at heights of 46.0 cm and 82.6 cm above the horizontal guide. A 7.62 cm diameter detector is mounted at the top of the vertical guide 98.1 cm above the horizontal beamline, corresponding to the top of the UCNτtrap. After the filling period is completed the system is transitioned into a “holding” configuration. A piston replaces the segment of the Halbach array bottom that was retracted for filling. Proton beam delivery to the spallation target is disabled and the gate-valve separating the experiment from the UCN source is closed.
2.1.2. Cleaning
Once the trap is filled high energy neutrons are cleaned from the trap during a period of 50–200 s. UCN with kinetic energy above the cleaning height, 38 cm (measured from the lowest point of the trap), are removed from the system through interactions with two horizontal sheets of absorber or the bottom of the dagger detector, which is lowered to a position such that its lowest point is at the same level with the “cleaners”. The cleaning height of 38 cm, 12 cm below the maximum trapping height, was set by engineering considerations.
2.1.3. Holding
During the holding period the cleaners and the dagger detector are retracted as to not disturb trapped UCN. The lowest point of the dagger is at a height of 48 cm from the lowest surface of the magnetic trap. Holding times vary from 20 s to 5000 s, with the true time blinded
from the experimenters, see Sect. 2.2 for details on the
blinding procedure. The production data in 2017 [8]
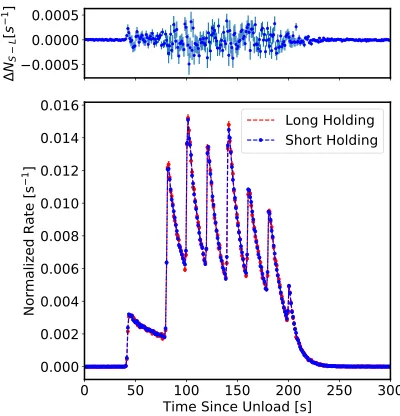
Figure 3. The shape of the average unloading curves for short (blue) and long (red) holding runs are compared to look for phase space evolution. The histograms are normalized to unity by the integral of background subtracted counts over the entire unloading period. The bin-by-bin difference between the normalized count rates in the short and long runs is shown in the top panel.
that varied between 1000 s and 1440 s depending on the run configuration. The difference between the holding from the statistical optimum ofthold=2.2τ was due to considering the signal to noise ratio of the experiment and the limitations of the data acquisition system’s rollover time.
2.1.4. Counting
The counting sequence proceeds by lowering the dagger detector to a height of 1 cm from the lowest surface of the trap through a series of intermediate heights. By unloading the trap at various heights the information about the velocity spectrum of stored UCN can be gained. Varying the number of steps allows count-rate-dependent effects to be studied. For the production data presented here the trap was unloaded with a three-step and nine-step sequence. The three step sequence had heights above the trap surface of 38 cm, 25 cm, and 1 cm while the nine-step sequence had steps of 38 cm, 25 cm, 18 cm, 14 cm, 11 cm,
8 cm, 6 cm, 4 cm, and 1 cm. Table 1 lists the unloading
configurations used to collect the data. UCN are collected in the 38 cm and 25 cm for 40 s, 20 s for intermediate heights, and 100 s at 1 cm.
Figure3shows the unloading counting curves for the
long and short holding time runs averaged over the data set for configuration C. The first step of configurations B-E is at the cleaning height and ideally has a rate consistent with background if the trap is sufficiently cleaned and UCN are not mechanically heated during storage. The count rates for both long and short holding times have been normalized to unity so that the shape of the unloading curve can be compared. Changes in the unloading rate that are dependent on the holding time would be evidence for spectral evolution in the stored UCN population.
Table 1. Running configurations for 2017 data set. The number of steps refers to the number of counting positions the dagger detector was lowered to when unloading the trap. The cleaning time is the duration after the trap is closed that the cleaners are lowered into the trap. Holding Field gives the strength of the applied magnetic field.
Config. Steps Cleaning [s] Holding Field [mT]
A 1 200 6.8
B 9 200 6.8
C 9 300 6.8
D 3 50 6.8
E 3 50 3.4
2.1.5. Background measurements
The background rate in the dagger detector was determined from the rate measured during the long holding period and at the end of the each run. At the end of the short-holding time runs the dagger was retracted in several steps to measure the position dependence of the background. A fit to this data was used to interpolate the background rate at the counting positions.
2.2. Data blinding
Data used for online display and offline analysis was blinded to avoid “observer” bias. The blinding procedure scaled the holding time input by the experimenter, Ti n,
by an unknown quantity, α, so that the true holding time
was Ttr ue=αTi n. The scale factor was randomly chosen at the beginning of the run period and used throughout.
α was allowed to vary so that the extracted lifetime was
±15 s from the measured value. The time-stamps of events
occurring during the holding period were scaled so that
the holding time appears to be Ti n. Three independent
analyses were completed and in sufficient agreement prior to removing the blinding factor. The residual disagreement between the analyses was included in the systematic uncertainty budget.
2.3. Determining
τ
expThe data were collected in doublets which were comprised of runs with a short, 20 s, and long, 1100–1440 s, holding time. The experimental lifetime was then determined by
τex p =
−th ln (YL/YS),
(1)
where th is the difference in the holding times and
YL(S) is the normalized yield from the long (L) and short (S) runs. The holding times were selected for each run configuration based on two factors, an optimization of the statistical sensitivity and the rollover time of the MCS acquisition unit. The normalized yields are calculated as
Yi =(S−B)/N , where S is the number of surviving UCN counted in the dagger detector, B is the expected number of background counts, and N a normalization factor based on the number of UCN counted in the monitor detectors during the filling period. The normalization factor is defined as
N =
tf ill
i=0
αn(1)i +βn
(2)
i +γn
(3)
i
exp(ti−tf ill)/τf ill
,
Table 2. Systematic corrections and their associated uncer-tainties in the 2017 UCNτ data are listed. The only correction applied to this data is due to residual gas up-scattering. The total uncertainty is the uncorrelated sum of the uncertainties of all effects.
Effect τn[s] σsys[s]
Depolarization 0.0 +0.07
Microphonic heating 0.0 +0.24
Cleaning 0.0 +0.07
Deadtime 0.0 ±0.04
Phase space evolution 0.0 ±0.10
Vacuum +0.1 ±0.03
Background Shifts 0.0 <±0.01
Total + 0.1 (+0.28/−0.1)
where n( j )i is the number of UCN counted in each of the three monitor detectors during the time bin i , ti is the time of the bin i , tf ill =150 s is the duration of the filling period,τf ill =70 s which is approximately the filling time constant of the trap. The exponential term emphasizes the contribution of UCN counted toward the end of the filling period. The parametersα,β, andγ are determined from a linear regression between the numbers of UCN counted at the end of short holding runs and the weighted monitored counts. This process corrects for spectral variations in the UCN velocity distribution produced by the aging of the SD2 source.
3. Systematic uncertainties
Table 2 lists the systematic uncertainties included in
the most recent publication. Microphonic heating and phase space evolution during storage were the leading contributions and both were estimated from the data. The combined systematic uncertainty was+0.4/−0.2 s which includes an uncorrelated sum of the individual systematics listed in Table2and an additional factor to account for the spread in the three independent analyses performed by the collaboration.
3.1. Phase space evolution
One significant source of uncertainty in bottle measure-ments of the neutron lifetime is the loss of above-trapping-threshold neutrons after some intermediate time. Above-threshold UCN that are lost quickly due to cleaning or quickly mixed into escape trajectories due to trap geometry or never lost from the trap do not present an issue. However, if the time constant for above-threshold UCN in quasi-stable orbits to enter escape trajectories is at an intermediate time scale, then this will create an excess of counted neutrons at short times and a deficiency at long times, artificially shortening the measured lifetime.
The first counting position in the unloading sequence is used to identify above threshold UCN. In this position the dagger is lowered to a height of 38 cm, its position during
the cleaning phase. UCN with Eki n 38 neV and a large
vertical velocity component will cross the center plane of the trap in a “bouncing” trajectory and possibly be counted. These above-threshold UCN can also exist in “rolling” or “skimming” trajectories that reach an apex at the edges of the trap and would not be counted by the dagger in the first position. The coupling or spectral evolution between these types of trajectories has been studied in the
UCNτ apparatus experimentally and in simulation, with
the results presented by Callahan [10]. Morris, et al. [7] details the significant corrections required to account for improper cleaning of the trap.
For the data presented here it was assumed that any signal in the first position of a short run indicated insufficient cleaning of above-threshold UCN. Averaging over the first position count rate for the short holding runs from configurations A-E results in a signal that is consistent with background. Any spectral evolution would then be visible in the multi-step counting method employed as a change in the unloading counting curve between short and long holding times. This effect would be evident as a shift in the mean time in the unloading curve, defined as
¯tun=
i Niti
iNi
, (3)
where i denotes the time bin relative to the start of the unloading period, Niare the background-subtracted counts in that bin and ti is the center of the time bin. This mean unloading time is used to determine the time difference, t , in Eq. (1) instead of the experimentally set holding times, t=(tL+¯tun,L)−(tS +¯tun,S). This results in an overall shift to the lifetime of 0.03–0.06 s depending on the data set analyzed [10]. The uncertainty in this effect is set by the counting statistics in the calculation of the ¯tunand is 0.10 s. Using the cleaning methods described in Sect.2.1.2
has resulted in no evidence of spectral evolution outside of statistics. Because the uncertainty of this effect scales with the overall statistics of the experiment it is anticipated that this effect will not present an issue in achieving 0.25 s precision in the future.
3.2. Mechanical heating
In addition to spectral evolution, vibrations of the trap
can add energy to the system. The UCNτ apparatus
is mechanically coupled to vacuum pumping stations and large industrial compressors used by the helium liquefaction system. Through many small interactions UCN in the trap can randomly gain or lose energy during a reflection depending on the relative phase of the vibration. Previous estimates of the heating carried out by
Salvat and Walstrom [11] suggested that low frequency
vibrations ( f <200 Hz) with displacement amplitudes
of 10µm could cause 1 in 104 UCN to gain sufficient
energy to leave the trap. A measurement of the vibrational power spectrum, taken with an accelerometer fixed to the experiment’s vacuum jacket, show average displacement to
be 1 to 5µm with a maximum of 16µm at 30 Hz.
Figure 4. Mean lifetime values from beam and bottle experiments are plotted against pre- and post-2002 values of λ, the value of |Vud|from superallowed Fermi-decays, and the
assumption of unitarity.
vibrations on the order of a few micrometers will have no significant effect on the lifetime.
4. Results
The 2017 data for UCNτ produced a measurement of
the neutron lifetime of τn =877.7 s (0.7 s)stat
(+0.4/−0.2 s)sys. The only systematic correction applied to the measured lifetime was for losses from scattering
on residual gas molecules in the trap, τn =+0.01 s,
which contributed ±0.03 s to the systematic uncertainty budget. This result is in agreement with previous bottle measurements of Serebrov et al. [13] and Ezhov et al. [3].
We can determine a value for |Vud| by combining
this result with the global neutron dataset for the lifetime
and axial-vector coupling constant, λ≡gA/gV [1].
Figure 4 shows the λ vs |Vud| bands formed from the
mean of the bottle and beam neutron lifetime experiments. A distinction is also made for the pre- and post-2002 measurements of the angular correlations that are used
to determine λ. The unitarity band is the result of
assuming that the relation |Vud|2=1− |Vus|2 holds and |Vus|=0.2243±0.0005 [1]. Currently, there is good agreement between the bottle measurements, post-2002 values of λ, |Vud| from super-allowed 0+→0+ decays, and unitarity. However, it is interesting to note that recent theoretical work on the hadronic radiative corrections may significantly shift this picture [14].
5. Future expectations
UCNτ will continue collecting data over the next several
years with a target total precision on neutron lifetime of τn0.3 s. In addition to taking advantage of the upgrade
to the LANSCE UCN source [15], changes to the beamline
shielding configuration will now allow daytime running for UCN experiments, effectively doubling the achievable statistics during the annual accelerator operational period.
During the 2017–2018 LANSCE cycle UCNτ
demon-strated the capability of performing a measurement of τn with a statistical precision of στn0.25 s, running the entire time in configuration D. In this data set measurements were performed in octets as opposed to the short-run long-run doublets used previously. The octet contained runs with short holding times of 10 s, 20 s, 100 s,
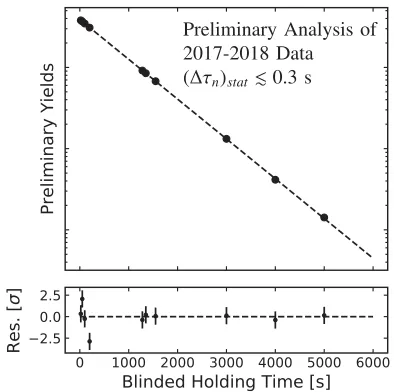
Figure 5. Preliminary analysis of the blinded 2017–2018 data including holding times of 5000 s is shown in the top panel. The dashed line represents a single-exponential two-parameter fit, normalization and lifetime (statistical errorbars are smaller than the markers). In the bottom panel the normalized residuals to the fit are shown where the errorbars are 1σstatand the dashed line represents zero.
and 200 s. The short runs were paired with a long run where the holding time was 1550 s (about 50 long runs were taken with holding times of 1280 s and 1350 s). Runs with holding times of 3000 s, 4000 s, and 5000 s were taken daily to investigate deviations from a single-exponential experimental lifetime. Preliminary blinded results from the
2017–2018 run are shown in Fig.5. Within the statistics
of the measurement there is no evidence of significant deviation from single-exponential behavior.
The UCNτ collaboration would like to thank the LANSCE accelerator operators and staff, without their dedication and expertise this experiment would not have been possible. This work was supported by the Los Alamos Laboratory Directed Research and Development (LDRD) office (no. 20140568DR), the LDRD Program of Oak Ridge National Laboratory, managed by UT-Battelle (no. 8215), the National Science Foundation (nos. 130692, 1307426, 161454, 1306997, and 1553861), NIST Precision Measurement Grant, IU Center for Space Time Symmetries (IUCSS), the LANSCE Rosen Scholarship program, and U.S. DOE Low Energy Nuclear Physics (nos. DE-FG02-97ER41042 and DE-AC05-00OR22725).
References
[1] M. Tanabashi, K. Hagiwara, K. Hikasa, K.
Nakamura, Y. Sumino, F. Takahashi, J. Tanaka, K. Agashe, G. Aielli, C. Amsler et al., Phys. Rev. D
98, 030001 (2018)
[2] K.K.H. Leung, P. Geltenbort, S. Ivanov, F. Rosenau, O. Zimmer, Phys. Rev. C 94, 045502 (2016), 1606.00929
[3] V.F. Ezhov, A.Z. Andreev, G. Ban, B.A. Bazarov, P. Geltenbort, A.G. Glushkov, V.A. Knyazkov, N.A. Kovrizhnykh, G.B. Krygin, O. Naviliat-Cuncic et al., JETP Lett. 107, 671 (2018), 1412.7434
[5] C.M. O’Shaughnessy, R. Golub, K.W. Schelham-mer, C.M. Swank, P.N. Seo, P.R. Huffman, S.N. Dzhosyuk, C.E.H. Mattoni, L. Yang, J.M. Doyle et al., Nucl. Instrum. Methods Phys. Res. Sect. A 611, 171 (2009), 0903.5509
[6] D.J. Salvat, E.R. Adamek, D. Barlow, J.D. Bowman, L.J. Broussard, N.B. Callahan, S.M. Clayton, C. Cude-Woods, S. Currie, E.B. Dees et al., Phys. Rev. C 89, 052501 (2014)
[7] C.L. Morris, E.R. Adamek, L.J. Broussard,
N.B. Callahan, S.M. Clayton, C. Cude-Woods, S.A. Currie, X. Ding, W. Fox, K.P. Hickerson et al., Rev. Sci. Instrum. 88, 053508 (2017), 1610.04560
[8] R.W. Pattie Jr, N.B. Callahan, C. Cude-Woods, E.R. Adamek, L.J. Broussard, S.M. Clayton, S.A. Currie, E.B. Dees, X. Ding, E.M. Engel et al., Science 360, 627 (2018)
[9] Z. Wang, M. Hoffbauer, C. Morris, N. Callahan, E. Adamek, J. Bacon, M. Blatnik, A. Brandt,
L. Broussard, S. Clayton et al., Nucl. Instrum. Methods Phys. Res. Sect. A 798 (2015)
[10] N. Callahan, Ph.d., Indiana University (2018) [11] D. Salvat, P.L. Walstrom, Next Generation
Experi-ments to Measure the Neutron Lifetime: Proceedings of the 2012 Workshop (World Scientific Publishing
Company, Singapore, 2014), ISBN 978-981-4571-66-1
[12] N. Callahan et al., Phys. Rev. C 100, 015501 (2019) [13] A. Serebrov, V. Varlamov, A. Kharitonov, A. Fomin,
Y. Pokotilovski, P. Geltenbort, J. Butterworth, I. Krasnoschekova, M. Lasakov, R. Tal’daev et al., Phys. Lett. B 605, 72 (2005)
[14] C.Y. Seng, M. Gorchtein, H.H. Patel, M.J. Ramsey-Musolf, Phys. Rev. Lett. 121, 241804 (2018), 1807.10197