Aus der Medizinischen Klinik und Poliklinik III
Klinikum Großhadern / Ludwig-Maximilians-Universität München
Vorstand: Prof. Dr. med. Wolfgang Hiddemann
Studie über das leukämogene Potential der Hoxb4-
ΔProlin
Mutante in einem murinen Knochenmarkstransplantationsmodell
und den Effekt der Hemmung von Histondeacetylasen in vitro
und in vivo
Dissertation
zum Erwerb des Doktorgrades der Medizin
an der Medizinischen Fakultät der
Ludwig-Maximilians-Universität in München
vorgelegt von
Monica Cusan
aus
Portogruaro, Italien
Jahr
Mit Genehmigung der Medizinischen Fakultät
der Universität München
Berichterstatter:
Prof. Dr. med. Christian Buske
Mitberichterstatter:
Priv. Doz. Dr. Irmela Jeremias
Priv. Doz. Dr. Michael Albert
Prof. Dr. Christian P. Sommerhoff
Prof. Dr. Stefan Endres
Dekan:
Prof. Dr. med. Dr. h.c. M. Reiser, FACR, FRCR
From the Department of Medicine III
University Hospital Großhadern, Ludwig-Maximilians-University
Munich
Director: Prof. Dr. med. Wolfgang Hiddemann
Investigation of the leukemogenic potential of the
Hoxb4-Δ
Proline mutant in a murine bone marrow transplantation model
and the effect of the histonedeacetylase inhibition in vitro and in
vivo
Thesis Submitted for a Doctoral Degree in Human Medicine
at the Faculty of Medicine,
Ludwig-Maximilians-University in Munich
submitted by
Monica Cusan
from
Portogruaro, Italy
Year
With permission from the Faculty of Medicine
University of Munich
Supervisor/Examiner:
Prof. Dr. med. Christian Buske
Co-Examiner:
Priv. Doz. Dr. Irmela Jeremias
Priv. Doz. Dr. Michael Albert
Prof. Dr. Christian P. Sommerhoff
Prof. Dr. Stefan Endres
Dean:
Prof. Dr. med. Dr. hc. M. Reiser, FACR, FRCR
Index
1. Introduction... 1
1.1. Hematopoiesis ... 1
1.1.1 The hematopoiesis ... 1
1.1.2.The hematopoietic hierarchy ... 2
1.1.3. Stem cells and hematopoietic stem cells ... .3
1.2. Leukemia ... 7
1.2.1 Acute leukemia ... 7
1.2.2 Leukemic stem cells ... 10
1.2.3 Molecular pathways leading to leukemia ... 11
1.2.4 Chromosomal translocations in AML... 14
1.3. The homeobox genes... 15
1.3.1 The homeobox genes in hematopoiesis and leukemogenesis ... 15
1.3.2 Cofactors of the HOX genes ... 20
1.3.3 Hoxb4 ... 22
1.3.3.1 Hoxb4 in the hematopoiesis ... 25
1.3.3.2 Hoxb4 as amplification tool of HSCs... 26
1.3.3.3 The proline-rich domain... 28
1.3.3.4 The downstream targets of Hoxb4 ... 30
1.4. Epigenetic changes in cancer... 31
1.4.1 Histone deacetylases (HDACs)... 32
1.4.2 Histone deacetylases inhibitors (HDACi) ... 34
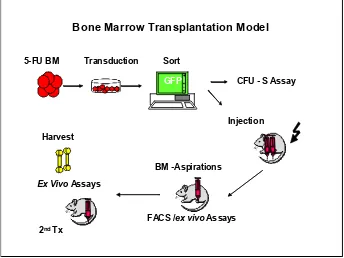
1.5. The murine bone marrow transplantation model of leukemia ... 35
1.6. Aim of the study ... 36
2. Materials ... 39
2.1. Mice and related reagents and equipment ... 39
2.2. Mammalian cell lines and prokaryotic cells ... 39
2.3. Oligonucleotides ... 40
2.4. Plasmids, genes and proteins ... 41
2.5. Antibodies ... 42
2.6. Reagents, media and apparatus ... 43
2.6.1 Molecular biology... 43
2.6.2 Cell and tissue culture ... 45
2.6.3 Miscellaneous... 47
2.6.4 Software ... 48
3. Methods ... 49
3.1. Mice maintenance... 49
3.2. Cloning of constructs ... 49
3.3. Mutagenesis of Hoxb4 constructs ... 49
3.4. Transient transfection of packaging cell lines for VCM production ... 50
3.5. Preparation of high titer stable virus-producing cell lines ... 50
3.6. Titration of the retroviral conditioned medium (VCM)... 51
Index
3.8. Retroviral transduction of primary bone marrow cells...51
3.9. Bone marrow transplantation and assessment of mice ...53
3.10. FACS analysis of murine primary cells ...54
3.11. In vitro and ex vivo functional assays of murine BM cells: proliferation and CFC assay ...55
3.12. Cytospin preparation and Wright-Giemsa staining ...55
3.13. Histological and immunohistochemical analysis ...55
3.14. Delta-colony forming unit-spleen (∆CFU-S) assay ...56
3.15. Quantification of competitive repopulating units (CRU-assay) ...56
3.16. Total RNA / genomic DNA isolation and cDNA preparation ...57
3.17. Southern blot...57
3.18. Integration analysis: bubble LM-PCR ...58
3.19. Western blot ...58
3.20. Immunoprecipitation...60
3.21. Polymerase chain reactions ...61
3.22. Immunostaining and confocal laser microscopy scanning fluorescence microscopy...61
3.23. Statistical analysis...62
4. Results ... 63
4.1. Cloning and expression of Hoxb4 constructs...63
4.2. Titration of the viral conditioned medium ...65
4.3. Transduction of primary bone marrow cells ...65
4.4. In vitro assays ...66
4.4.1 Effect of Hoxb4 and its mutants on liquid expansion of BM progenitor cells...66
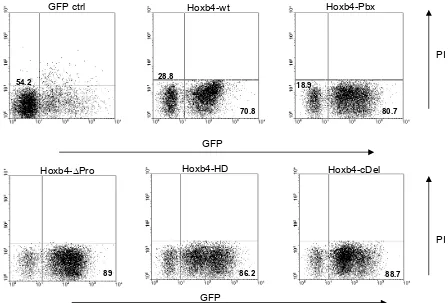
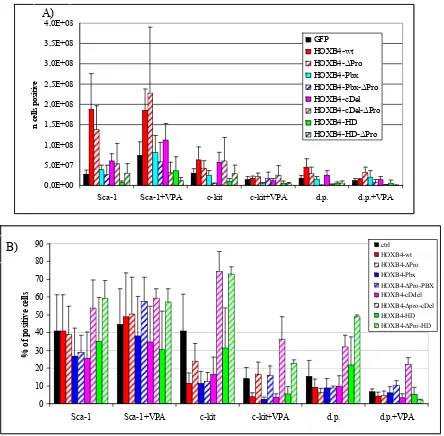
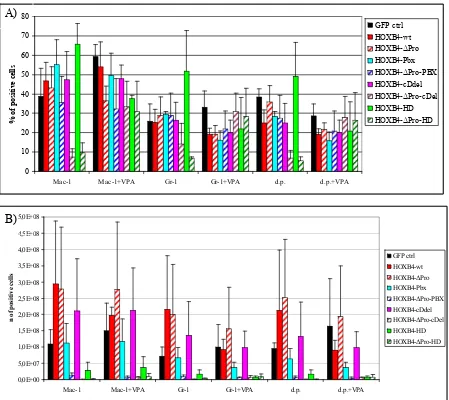
4.4.2 Immunophenotype of in vitro expanded BM progenitor cells...68
4.4.3 Morphology of in vitro expanded BM progenitor cells...76
4.4.4 Colony forming cells (CFC)-assay in vitro...77
4.4.5 Intracellular localization...79
4.5. In vivo assays...80
4.5.1 ∆Colony forming unit in the spleen (∆CFU-S) assay...80
4.5.2 Hoxb4 BM transplantation experiments in mouse model ...83
4.5.2.1 Peripheral blood (PB) analysis at 4th week after transplantation ...83
4.5.2.2 The long term engraftment: analysis of chimerism in PB ...83
4.5.2.3 The long term engraftment: analysis of differentiation profile in PB ...84
4.5.2.4 Overexpression of Hoxb4-∆Pro is associated with acute leukemia in transplanted mice...84
4.5.2.5 Clinical features of the Hoxb4-∆Pro associated leukemia...90
4.5.2.6 Colony forming cell assay (CFC) ex vivo...103
4.5.2.7 Retroviral integration analysis...108
4.5.2.8 Effect of the proline-rich region deletion on the CRU frequency (CRU assay)...110
5. Discussion ... 115
6. Summary ... 121
7. Zusammenfassung ... 123
Index
9. Acknowledgments ... 135
Chapter 1 – Introduction
Introduction
1.1 Hematopoiesis
1.1.1 The hematopoiesis
The term hematopoiesis indicates the controlled production of the blood cells. The blood cells, leukocytes, erythrocytes and platelets, are continuously produced and released from the bone marrow on a daily base to replace altered cells and to enrich the pool of necessary cells in response to increased demand, like in case of injury, bleeding or disease. The control of the blood cells production undergoes homeostatic mechanisms, which are modifying their turnover and re-establishing the steady state after the stress situation is resolved. The first site of primitive hematopoiesis is the yolk sac in the first few weeks of gestation. In this first time of blood cell production putative hemangioblasts, which correspond to the common mesodermal precursors of endothelial and hematopoietic lineages, give rise to a temporary embryonic hematopoietic system. During the gestational development these precursors are believed to migrate to the fetal liver, and from this to the spleen and bone marrow (Weissman 2000, Morrison 1995a). This migration is due to molecular changes as well as to modifications of cell surface adhesion molecules (Hirsch 1996). From 6 weeks until 6-7 months of fetal life liver and spleen are the major hematopoietic organs, which continue to produce blood cells until about 2 weeks after birth. The bone marrow becomes the major hematopoietic organ from 6 to 7 months of fetal life. The adult multilineage blood system is maintained by pluripotent hematopoietic stem cells (HSC), which have the capacity to self-renew, to differentiate hierarchically giving rise to all the different mature progeny cells of the blood, and
can long-term repopulate myeloablated recipients. By performing in vitro
clonogenic and in vivo transplantation assays at least five classes of partially
independent hematopoietic cells in the murine embryo/fetus have been defined: the primitive present in the yolk sac, the pro-definitive (myeloid progenitors), the meso-definitive (lymphoid-myeloid progenitors), the meta-definitive (neonatal repopulating HSCs and CFU-S) (these tree classes located in the para-aortic splanchnopleura), and adult-definitive (adult definitive repopulating HSCs), which appear in the aorta-gonad mesonephros (AGM) region, in the liver, thymus, spleen and bone marrow (Dzierzak 2003, Dzierzak 2008).
Chapter 1 – Introduction
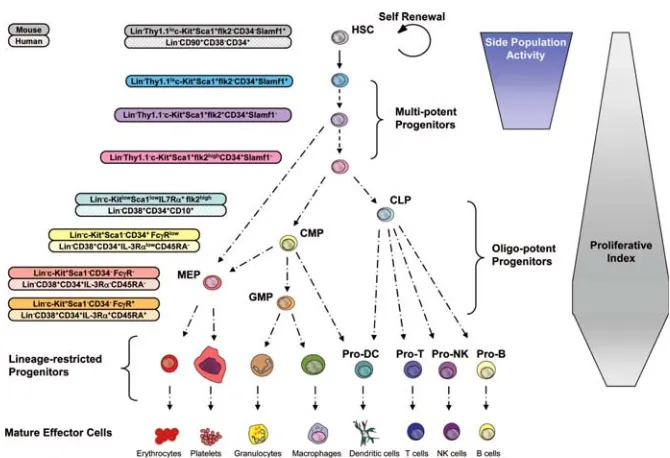
Based on many reports the human embryonic development seems to significantly parallel the mouse development (Fig 1.1.1). Adult HSCs can divide asymmetrically into one daughter HSC and a committed progenitor, and the fate determination depends on a number of essential hematopoietic transcription factors. For example, PU.1 drives the cell into myeloid lineage, while GATA-1 induces erythropoietic and megakaryocytic differentiation. Moreover, the lineage differentiation can also be influenced by several exogenous factors, like the growth factors IL-3, SCF, IL-6 and G-CSF.
Fig 1.1.1. Development of the hematopoietic system (Bonnet 2003).
1.1.2 The hematopoietic hierarchy
The cells of mature hematopoietic progeny derive from a limited number of committed hematopoietic progenitors, which arise from even more rare hematopoietic stem cells (HSCs) (Weissman 2000). The self-renewing HSCs are termed term repopulating HSCs (LT-HCSs) for their ability to confer long-term engraftment on lethally irradiated recipients, and they generate the short-term repopulating HSCs (ST-HSCs) with limited self-renewal and increased proliferation capacity. ST-HSCs subsequently give rise to multipotent progenitors (MPPs) that generate committed progenitors of different lineages: the common myeloid progenitor (CMP) for the myeloid-erythroid lineage, and the common lymphoid progenitor (CLP) for the lymphoid lineage. The CMP in turn gives rise to the granulocyte-macrophage progenitors (GMPs) and the megakaryocyte-erythrocyte progenitors (MEPs) that are restricted to churning out mature granulocytes, macrophages or mast cells and megakaryocytes or erythrocytes, respectively. The CLPs generate all mature lymphoid cell types including B and T
Chapter 1 – Introduction
lineage cells, dendritic and NK cells. Dendritic cells can be generated from both CLPs as well as CMPs. Thus the hematopoietic hierarchy is composed of the stem cells, the committed progenitors and their progeny, the mature blood cells of all lineages. The first level where we can observe a profound homeostatic control of the high turnover rate of the hematopoietic system is within the HSCs compartment. Moreover, a significant homeostatic control is also necessary at the level of more committed multipotent, oligopotent, and lineage-restricted progenitor cells, if one considers the even larger proliferative and developmental capacity of these progenitors (Bryder 2006) (Fig. 1.1.2).
Fig. 1.1.2. A representative scheme of the hematopoietic developmental hierarchy. The cell surface markers of many of these cells types are known for the murine and human system. However, many markers have been described only for few mouse strains, while the absolute lineage potential and developmental relationship of some of the subsets indicated have not been yet completely characterized. The differentiation of HSCs into multipotent, oligopotent, and lineage-specific progenitors is generally associated with increased proliferative index, although this characteristic is not absolute and has not been resolved for all stages of development. The side population activity represents the capacity of efflux dyes, and it is restricted to HSCs and their immediate downstream multipotent progenitors. Of note is that the different multipotent progenitor subsets in human system have not been functionally resolved to a significant degree like for the murine hematopoiesis (Bryder 2006).
1.1.3 Stem cells and hematopoietic stem cells
Stem cells can be classified into two main categories, embryonic and adult stem cells. Stem cells are clonogenic cells capable of both self-renewal and multilineage differentiation. Some adult tissues like blood, skin, gut etc. need a constant turnover of cells for tissue renewal. Tissue stem cells, which are adult stem cells, respond to this need as they consist of multipotent progenitors. After
Chapter 1 – Introduction
the observation that cellular recovery can be achieved following lethal irradiation by transplanting bone marrow, it was defined that the ability of such transplants to reconstitute hematopoiesis can be attribute to a few extremely rare stem cells found predominantly in the bone marrow but capable of mobilization into peripheral tissues via the blood vascular system. Since then, HSCs have been the best characterized stem cells at the phenotypic and functional level, and the hematopoietic system has been the proving ground for most of the experimental procedures and conceptual paradigms for the stem cells biology in general. HSCs and indeed most stem cells can be defined by certain unique properties, sometimes referred as “stemness”, the most prominent of which are self-renewal, multipotency, and quiescence. During their lifespan, humans produce approximately 1016 blood cells of different types. The hallmark properties of the HSCs were defined in 1963 by Till and McCulloch. In a mouse model they have identified a population of clonogenic BM cells able to generate myeloid-erythroid colonies in the spleen of lethally irradiated hosts. These clonogenic cells in some cases gave rise to cells that also could be transferred to secondary hosts and there reconstitute all blood lineages (Till & McCulloch 1961; Siminovich 1963). With the development of clonal assays for all major hematopoietic cell lineages, cell sorted-based separation of monoclonal antibody- or dye-stained BM subsets
led to the isolation of candidate stem cell populations (Osawa 1996). In vivo
limiting dilution analysis of these cells allowed the characterization of at least 2 classes of multipotent cells, long-term (LT-HSC) and short-term repopulating hematopoietic stem cells (ST-HSC), the last ones able to self-renew for a definite
interval (≈8 weeks in mice) (Passagué 2003, Morrison 1995). Stem cells have the
ability to self-renew, and are able to persist in recipients for long period of time after transplantation, continuously replenishing the blood with mature differentiated cells or remaining quiescent. The competitive repopulating units (CRUs) represent a functionally defined class of very primitive HSCs with the potential of long-term reconstitution of all hematopoietic lineages in recipient animals. The CRU-assay allows not only the quantification of these primitive HSCs, but also allows establishing a competitive pressure on the HSCs originating from the compromised irradiated host, from the transduced HSCs and the cotransplanted competitor HSCs (Szilvassy 1990, Miller 1997).
Chapter 1 – Introduction
Self-renewal. Self-renewal is the property of a stem cell to generate progeny with
exact stem cell properties of the parental cell. A stem cell can divide symmetrically to give rise to two daughter stem cells, each possessing stem cells properties, or alternatively, asymmetrically, wherein one daughter cell is a stem cell and the other is a rapidly cycling downstream progenitor with a reduced capacity of self-renewal (Warner 2004). The downstream progenitor of an HSC displays a partially increased proliferation capability and it leads to clonal expansion and production of numerous committed progenitors and more differentiated hematopoietic cells. The short-term repopulating stem cell gives rise to the non-self-renewing oligolineage progenitors which in turn give rise to progeny that are more restricted in their differentiation potential, and finally to functionally mature cells. In a steady state bone marrow HSCs divide rarely but mostly asymmetrically to retain their original pool numbers as well as to produce the entire complement of cells necessary for normal hematopoiesis, which is the result of a sophisticated equilibrium between self-renewal and differentiation. The mechanisms regulating the fate decision are poorly understood. However, many gene families have been associated to this process, like the Hox genes family (Antonchuk 2001, Buske 2002), the Wnt family (Reya 2003), and the Polycomb group (Lessard 2003). Other factors have been reported to play a role in the maintenance of quiescence as well as in the activation of HSCs, like Notch (Karanu 2000) and Hedgehog (Bhardwaj 2001), in particular in relation to the function of the stem cell niche in the bones.
Multipotency. The adult stem cells are multipotent, i.e. are able to give rise to all
the cells of a given tissue, while the embryonic stem cells are able to give rise to all the cells of every tissue of an organism, which is called totipotency. The HSCs are multipotent cells capable to long-term repopulate both the lymphoid and myeloid hematopoietic compartments via differentiation into committed progenitors, which can proliferate extensively but have increasingly limited differentiation potential (Orlic 1994). In leukemias the HSCs undergo a loss of multipotency in form of block of differentiation and/or dysregulation of certain lineage specific transcription factors.
Plasticity and heterogeneity. In the recent years many efforts have been done
in order to investigate the possibility that adult mammalian stem cells may differentiate across tissue lineage borders, which could represent an
Chapter 1 – Introduction
extraordinary tool to establish new therapeutic issues as tissue regeneration. The first studies using BM cells or HSCs to regenerate other tissues have been controversial (Goodell 2003, Raff 2003). The more promising results were obtained in an effort to define the capacity of enriched BM populations to restore myocardial function in infarct models (Orlic 2001). In a number of reports BM cells have been described to repopulate renal, neuronal, cardiac and liver tissues in response to certain injuries, but the significance of these results still remains to be clarified. Interestingly, some authors have suggested that tissue-committed stem cells (TCSCs), which express mRNA/protein for different markers, could be normally present in the adult BM compartment (Kucia 2005).
An opposite concept that has been developed is the heterogeneity of HSCs. Although a relatively simple surface phenotype may be ascribed to HSCs (for example, Thy1.1+Lin-Sca+ckit+) (Morrison 1994) and is of enormous value in their prospective enrichment, it is also evident that even highly purified HSC populations are heterogeneous, either with respect to other surface markers or functions (Weissman 2000b, Morrison 1995b). Whereas a model invoking stem cell heterogeneity may account for the majority of recent findings, reprogramming of HSCs, albeit at a low rate, may best explain the contribution of purified HSCs to liver, as shown by the experiments of Lagasse et al (Lagasse 2000), where purified HSCs seemed to differentiate into hepatocytes in vivo (Orkin 2002).
Quiescence. Quiescence or the relatively slow cycling of HSCs, in contrast to the
rapidly proliferation of the downstream progenitors, is necessary to protect the stem cell compartment from toxic and oxidative stress and to prevent consumption of the regenerative cell pool, an occurrence known as stem cell exhaustion (Cheng 2000). Bonnet et al have calculated the frequency of HSCs to be 1 in 10,000 to 100,000 cells in peripheral blood. The HSCs occupy in relatively larger number well defined “stem cell niches” in adult BM where they are normally in an inactive state (Bonnet 2002). It was demonstrated by 5-bromo-2´-deoxy-uridine (BrdU) incorporation studies (for the measurement of cell proliferation) in
mice, that approximately 75% of long-term repopulating HSCs were in the G0
phase/quiescence at any given time in steady state BM (Cheshier 1999). LT-HSCs divide very rarely and give rise to the more proliferative ST-LT-HSCs which in turn give origin to the non-self-renewing lineage committed progenitors. HSCs can however proliferate rapidly symmetrically in response to myelosuppressive
Chapter 1 – Introduction
chemotherapy or irradiation prior BM transplantation to give rise to committed progenitors as well as copies of more HSCs, which then return to the quiescent state (Dixon 1981). The control of the quiescent state is especially crucial in conditions of stress, such as myelotoxic injury, to prevent hematopoietic death. There is little information about the molecular events that promote this process, though the BM microenvironment or the “stem cell niche” is believed to play an important role generating signals that regulate the self-renewal and the differentiation of normal stem cells (Lemischka 1997).
1.2 Leukemia
1.2.1 Acute leukemia
The leukemias are a group of diseases in which the common manifestation is a malignant, unregulated proliferation of cells originating from the bone marrow. Leukemia may involve any of the blood-forming cells or their precursors and may be found throughout the body, including brain, liver, spleen, and lymph nodes. Although each type of leukemia progresses differently, the unregulated proliferating cells (1) usually displace normal BM cells, (2) can interfere with normal marrow function, (3) may colonize other organs, and (4) eventually lead to death if not treated. Based on the progress, leukemias are distinguished into chronic (first described in 1845 by Bennet and Virchow, Bennet 1845, Virchow 1846) and acute leukemias, which were described 25 years later when patients with “white blood” were observed to die rapidly after a short debilitating illness (Friedrich 1857, Ebstein 1889). Acute and chronic leukemias can be distinguished based on their presenting signs and symptoms, and the cell type involved. Acute leukemias are characterized by rapid onset of clinical signs (e.g., infection, haemorrhage, and pallor) and symptoms (e.g., fatigue, weakness, bone and joint pain), by the detection of normocytic anemia, neutropenia and/or thrombocytopenia, and death occurs within months if treatment is not initiated. In 1976 the FAB (French-American-British) classification of leukemias was introduced, which was based on the number of blasts (immature cells of myeloid or lymphoid origin) of at least 30% of all nucleated bone marrow cells, and on the morphology of these cells. The proposed World Health Organization classification has modified the percentage of blasts to 20% in either peripheral blood or bone marrow (Brunning 1999). The diagnosis of acute myeloid leukemia can be based
Chapter 1 – Introduction
also on the presence of less than 20% of blasts in the bone marrow, if typical chromosomal aberrations are detected. Overall, peripheral blood white cell counts can be increased, decreased, or within reference range, although they are typically increased. The use of light microscopy is the initial step in the diagnosis of acute leukemias, which are classified cytomorphologically into acute myeloid (AML) and acute lymphoblastic leukemia (ALL) on the basis of the blasts’ morphologic similarity to myeloblasts or lymphoblasts. For example, Auer rods (spindle-shaped pink-red inclusions composed of azurophilic granule derivatives) may be seen in the cytoplasm of any subtype of human AML. The old FAB classification system used a combination of Romanowsky-based stains and cytochemical reactions, including staining for myeloperoxidase, chloracetate esterase, non-specific esterase, and stains with Sudan black B, periodic acid
Shiff and TdT. In 2008 the World Health Organization has published the 4th
revision of the classification of tumors of hematopoietic and lymphoid tissues (Figure 1.2.1). The guidelines presented there include the analysis of PB and BM specimens, the assessment of blasts and blast lineage by morphological, immunophenotypical and cytochemical analyses, as well as the evaluation of genetic features, like the karyotype (for the detection of chromosomal alterations), and point mutations (like NPM1, CEBPA, FLT3, and RUNX1), which have been demonstrated to be significantly associated with different prognosis. Chromosomal alterations have been seen consistently in leukemic cells. Using standardized banding high-resolution techniques, almost all leukemic cells will present a clonal cytogenetic abnormality of one type or another. These abnormalities can be of number (ploidy) or of structure (translocations, deletions, and rearrangements). The follow up of these molecular markers in patients showing morphological remission enable to detect groups of patient at high risk of relapse. The persistence of these markers is defined as minimal residual disease (MRD).
Myeloproliferative neoplasms (MPN) Myeloid and lymphoid neoplasm associated with eosinophilia and abnormalities of PDGFRA, PDGFRB, or FGFR1
• Chronic myelogenous leukemia, BCR-ABL1 positive
• Polycythemia vera • Essential thrombocythemia • Chronic eosinophilic leukemia, n.o.s. • Chronic neutrophilic leukemia • Primary myelofibrosis • Mastocytosis
• Myeloproliferative neoplasm, unclassifiable
• Myeloid and lymphoid neoplasms associated with
PDGFRA rearrangement
• Myeloid neoplasms associated with PDGFRB
rearrangement
•Myeloid and lymphoid neoplasms associated with FGFR1 abnormalities
Myelodysplastic/myeloproliferative neoplasms (MDS/MPN) Myelodysplastic syndromes (MDS)
Chapter 1 – Introduction
• Chronic myelocytic leukemia
• Atypical chronic myeloid leukemia, BCR-ABL1 negative • Juvenile myelomonocytic leukemia
• Myelodysplastic/myeloproliferative neoplasms, unclassifiable
Provisional entity: refractory anemia with ringsideroblasts and thrombocytosis
• Refractory cytopenia with unilineage dysplasia
- Refractory anemia
- Refractory neutropenia
- Refractory thrombocytopenia
• Refractory anemia with ring sideroblasts • Refractory cytopenia with multilineage dysplasia • Refractory anemia with excess blasts
• Myelodysplastic syndrome with isolated del(5q) • Myelodysplastic syndrome, unclassifiable • Childhood myelodysplastic syndrome
Provisional entity: refractory cytopenia of childhood
Acute myeloid leukemia and related neoplasms Acute leukemia of ambiguous lineage
• Acute undifferentiated leukemia
• Mixed phenotype acute leukemia with t(9;22)(q34;q11.2);
BCR-ABL1
• Mixed phenotype acute leukemia with t(v;11q23); MLL
rearranged
• Mixed phenotype acute leukemia, B-myeloid, n.o.s. • Mixed phenotype acute leukemia, T-myeloid, n.o.s.
Provisional entity: natural killer (NK) cell lymphoblastic leukemia/lymphoma
Precursors lymphoid neoplasms
• Acute myeloid leukemia with recurrent genetic abnormalities
- AML with t(8;21)(q22;q22); RUNX1-RUNX1T1 - AML with inv(16)(p13.1q22) or t(16;16)(p13.1;q22);
CBFB-MYH11
- APL with t(15;17)(q22;q12); PML-RARA - AML with t(9;11)(p22;q23); MLLT3-MLL - AML with t(6;9)(p23;q24); DEK-NUP214
- AML with inv(3)(q21;q26.2) or t(3;3)(q21;q26.2); RPN1-EVI1
- AML (megakaryoblastic) with t(1;22)(p13;q13); RBM15-MKL1
Provisional entity: AML with mutated NPM1 Provisional entity: AML with mutated CEBPA
• Acute myeloid leukemia with myelodysplasia-related changes • Therapy-related myeloid neoplasms
• Acute myeloid leukemia, n.o.s.
- AML with minimal differentiation
- AML without maturation
- AML with maturation
- Acute myelomonocytic leukemia - Acute monoblastic/monocytic leukemia - Acute erythroid leukemia
Pure erythroid leukemia
Erythroleukemia, erythroid/myeloid
- Acute megakaryoblastic leukemia - Acute basophilic leukemia - Acute panmyelosis with myelofibrosis • Myeloid sarcoma
• Myeloid proliferations related to Down syndrome
- Transient abnormal myelopoiesis
- Myeloid leukemia associated with Down syndrome
• Blastic plasmacytoid dendritic cell neoplasm
B lymphoblastic leukemia/lymphoma
• B lymphoblastic leukemia/lymphoma, n.o.s.
• B lymphoblastic leukemia/lymphoma with recurrent genetic abnormalities
- B lymphoblastic leukemia/lymphoma with t(9;22)
(q32;q11.2); BCR-ABL1
- B lymphoblastic leukemia/lymphoma with t(v;11q23); MLL rearranged
- B lymphoblastic leukemia/lymphoma with t(12;21)
(p13;q22); TEL-AML1 (ETV6-RUNX1)
- B lymphoblastic leukemia/lymphoma with
hyperdiploidy
- B lymphoblastic leukemia/lymphoma with
hypodiploidy
- B lymphoblastic leukemia/lymphoma with
t(5;14)(q31;q32); IL3-IGH
- B lymphoblastic leukemia/lymphoma with
t(1;19)(q23;p13.3); TCF3-PBX1
T lymphoblastic leukemia/lymphoma Mature B-cell neoplasms Mature T-cell and NK-cell neoplasms
• T-cell prolymphocytic leukemia
• T-cell large granular lymphocytic leukemia • Chronic lymphoproliferative disorder of Nk-cells
• Aggressive NK-cell leukemia
• Systemic EBV positive T-cell lymphoproliferative disease of childhood
• Hydroa vacciniforme-like lymphoma • Adult T-cell leukemia/lymphoma
• Extranodal NK/T-cell lymphoma, nasal type • Enteropathy-associated T-cell lymphoma • Hepatosplenic T-cell lymphoma
• Subcutaneous panniculitis-likeT-cell lymphoma • Mycosis fungoides
• Sézary syndrome
Primary cutaneous T-cell disorders
• Primary cutaneous CD30 positive T-cell lymphoproliferative dosirders
- Lymphomatoid papulomatosis
- Primary cutaneous anaplastic large cell lymphoma
• Primary cutaneous gamma-delta T-cell lymphoma
• Primary cutaneous CD8 positve aggressive epidermotropic cytotoxic T-cell lymphoma
• Primary cutaneous CD4 positive small/medium T-cell lymphoma
• Chronic lymphocytic leuekemia/small lymphocytic lymphoma • B-cell prolymphocytic leukemia
• Splenic B-cell marginal zone lymphoma • Hairy cell leukemia
- Splenic B-cell lymphoma/leukemia, unclassifiable - Splenic diffuse red pulp small B-cell lymphoma
- Hairy cell leukemia variant
• Lymphoplasmacytic lymphoma
- Waldenström macroglobulinemia
• Heavy chain diseases
- Alpha heavy chain disease
- Gamma heavy chain disease
- Mu heavy chain disease
• Plasma cell lymphoma • Solitary plasmocytoma of bone • Extraosseous plasmocytoma
• Extranodal marginal zone lymphoma of mucosa-associated lymphoid tissue (MALT lymphoma)
• Nodal marginal zone lymphoma
• Paedriatic nodal marginal zone lymphoma
• Follicular lymphoma
• Paedriatic follicular lymphoma
• Primary cutaneous follicle centre lymphoma • Mantle cell lymphoma
• Diffuse large cell lymphoma (DLBCL), n.o.s.
- T-cell/hystiocyte rich large B-cell lymphoma
- Primary DLBCL of the CNS - Primary cutaneous DLBCL, leg-type - EBV positive DLBCL of the elderly
Peripheral T-cell lymphoma, n.o.s. Angioimmunoblastic T-cell lymphoma Anaplastic large cell lymphoma, ALK positive
Chapter 1 – Introduction
Anaplastic large cell lymphoma, ALK negative
Hodgkin lymphoma
• Nodular lymphocyte predominant Hodgkin lymphoma • classical Hodgkin lymphoma
- Nodular sclerosis classical Hodgkin lymphoma - Mixed cellularity classical Hodgkin lymphoma
- Lymphocyte-depleted classical Hodgkin lymphoma
Histiocytic and dendritic cell neoplasms
• DLBCL associated with chronic inflammation • Lymphomatoid granulomatosis
• Primary mediastinal (thymic) large B-cell lymphoma • Intravascular large B-cell lymphoma
• ALK positive large B-cell lymphoma • Plasmablastic lymphoma
• Large B-cell lymphoma arising in HHV8-associated multicentric Castleman disease
• Primary effusion lymphoma • Burkitt lymphoma
• B-cell lymphoma, unclassifiable, with features intermediate between DLBCL and Burkitt lymphoma
• B-cell lymphoma, unclassifiable, with features intermediate between DLBCL and classical Hodgkin lymphoma
Post-transplantation lymphoproliferative disorders (PTLD)
• Early lesions
- Plasmacytic hyperplasia - Infectious mononucleosis-like PTLD
• Polymorphic PTLD
• Monomorphic PTLD (B- and T/NK-cell types) • Classical Hodgkin lymphoma type PTLD
• Histiocytic sarcoma • Langerhnas cell histiocytosis • Langerhans cell sarcoma
• Interdigitating dendritic cell sarcoma • Follicular dendritic cell sarcoma • Fibroblastic reticular cell tumor • Indeterminate dendritic cell tumor • Disseminated juvenile xanthogranuloma
Fig 1.2.1. WHO classification of hematopoietic and lymphoid neoplasms (Vardiman 2009, Vardiman 2010). n.o.s.: not otherwise specified.
1.2.2 Leukemic stem cells
The cells within a certain cancer are heterogeneous and a growing amount of evidences suggest that cancers originate from a rare population of cancer stem cells (CSCs) with unlimited proliferation potential, which induce the generation and growth of a tumor (Bonnet 1997, Reya 2001). This can explain the treatment failure of therapies currently in use, which are cytotoxic to the tumor bulk, but are not able to exhaust the cancer stem cells. The blood-related cancer leukemias were the first diseases for which human cancer stem cells, or leukemic stem cells (LSCs), were isolated through the ground breaking work of Bonnet and Dick (Bonnet 1997, Dick 2003). Most of the therapies currently used for acute leukemias have been designed to target the high proliferating malignant blasts. However, one hallmark of the human LSCs studied so far is the quiescence, which is protecting them from the toxicity of the common chemotherapeutic agents (Holyoake 1999). Nowadays, the characterization of the LSCs is based on
the immunophenotype analysis together with functional assays in vivo like the
xenotransplantation of primary human AML cells in immunodeficient NOD-SCID
mice. It has been shown that the LSCs reside in the CD34+CD38- or
CD34+/CD38+ subpopulation, which match with the phenotype of the normal
HSCs, but the LSCs differentially express also other markers, like CD123/IL3-Rα
or CD33 (Jordan 2000, Taussig 2005). This allowed the design of a promising therapeutic approach with the administration of an IL3/diphteria toxin fusion protein to transplanted animals (Feuring-Buske 2002). This treatment schedule
Chapter 1 – Introduction
has been used for a phase I clinical study for patients with chemo-refractory AML. Another intriguing aspect of the LSCs is that they can arise from both self-renewing HSC and non-self-self-renewing progenitor populations which are supposed to re-aquire HSCs specific features (Goardon 2011). This could allow the development of more effective drugs targeting e.g. common leukemogenic self-renewal pathways displayed by all the different LSCs, which could be used in combination with conventional therapies (e.g. imatinib, chemotherapy) (Passegué 2005).
1.2.3. Molecular pathways leading to leukemia
The carcinogenesis is a multistep process where the cancer cell acquires increasing numbers of somatic mutations leading to disruption of determinant biological pathways. In details, the cancer cells can gain and lose important functions: initially a clonal event causes increased proliferation, while further mutations drive to block of differentiation, leading to malignant transformation. This is characterized by self-sufficiency in growth signals, resistance to antigrowth and apoptotic signals, capacity to change the microenvironment and to induce angiogenesis and metastasis (Hanahan 2000). The genetic alterations lead in most of the cases to the activation of an oncogene and to the inactivation of a tumor suppressor gene. In general many genetic alterations and leukemic-associated fusion genes are perturbing the normal hematopoietic differentiation programs, but in most of the cases further cooperative mutations are necessary to allow a full malignant transformation, as supported by murine transplantation models (Kelly and Gilliland 2002). Additional supports to this hypothesis are coming from the observations that there are inherited gene mutations predisposing to the development of leukemia and that in many sporadic AMLs more than one mutation can be detected. A significant group of genes that are altered in the leukemogenesis are the proto-oncogenes as shown in the Fig. 1.2.3a (Domen 2000, Fröhling 2005). In detail, the genetic mutations observed in acute leukemia can be classified in three groups: (1) activating mutations of genes in the tyrosine kinase-RAS/BRAF or -FLT3 receptor signal transduction pathway (Ozeki 2004), leading to increased cell proliferation and/or survival of leukemic progenitor cells (class I mutations, e.g. BCR-ABL, TEL-PDGFRB and other translocations); (2) inactivating mutations of genes encoding hematopoietic
Chapter 1 – Introduction
transcription factors, resulting in disturbed cell differentiation (class II mutations, e.g. RUNX1-ETO, RUNX1-EVI1, TEL-RUNX1, CBFB-SMMHC, RUNX1 point mutation, PML-RARA) (Speck 2002); and (3) inactivating mutations of the tumor suppressor gene p53.
Fig 1.2.3a. Deregulated pathways leading to leukemia (Passegué 2003).
Additionally in the AML with normal karyotype other mutations have been identified in the last few years, which have been shown to correlate differentially with the prognosis, and are therefore often included in the panel of the routine investigations in order to help in taking adequate therapeutic decisions. These mutations include partial tandem duplications (PTD) of the MLL gene, internal tandem duplications (ITD) or tyrosine kinase domain (TKD) mutations of the FLT3 gene, and mutations in the NMP1 (Nucleophosmin1), CEBPA, NRAS and WT1 genes (Fig 1.2.3b). At present many efforts are done in developing molecular therapies which are targeting these aberrantly mutated factors.
Gene Biological/clinical features Frequency
NPM1 Protein with pleiotropic functions; associated with
FLT3-ITD/TKD mutations 25-35% of AML; 45-62% of CN-AML
FLT3 - ITD - TKD
Class III receptor tyrosine kinase In frame mutation
Point mutation 28-34% of CN-AML 11-14% of CN-AML
CEBPA Transcription factor mediating lineage specification
and differentiation into mature neutrophils Predominantly in CN-AML
MLL PTD; rationale for use of DNA
methyltransferase/histone deacetylase inhibitors 5-11% of CN-AML
RAS No prognostic significance 9% of CN-AML
WT1 Wilms tumor gene 10% of CN-AML
Fig 1.2.3b. Gene mutations predominantly occurring in cytogenetically normal AML. CN: cytogenetically normal (American Society of Hematology, 2007).
A number of experiments have shown that the prevention of cell death is one of the crucial events in myeloid leukemogenesis and may even be the first step that
Chapter 1 – Introduction
defines a platform for additional mutations (Delia 1992). Mutations leading to the overexpression of the anti-apoptotic proteins like Bcl-2 have been shown to be involved in malignant transformation in follicular lymphoma, lymphoid leukemia as well as in myeloid cells. Many groups are focusing on the research on gain-of-function mutations that promote constitutive self-renewal, such as stabilization of
β-catenin. Stabilized β-catenin has been shown to promote the self-renewal of
stem cells and other types of progenitor cells (Reya 2001), and activation of β -catenin and deregulation of Wnt signalling pathway is a common phenomenon in cancer (Polakis 2000). Additionally, other factors playing a role in the epigenetic regulation of the DNA have been identified to be relevant in the leukemogenesis. The TET1 protein has been described to catalyse the conversion of cytosine-5 methylation (5mC) to 5hmC, which seems to affect the methylation pattern of DNA. TET1 has been described to be fused to MLL in the t(10;11)(q22;q23), leading to a dysregulated expression of tumor suppressors and oncogenes (Lorsbach 2003). Moreover, TET2 has been reported to be mutated in 12.1% of primary (Abdel-Wahab 2009) and in 34.2% of secondary myeloid malignancies (Delhommeau 2009).
A further classification of AMLs is based on their onset. We can distinguish
primary AMLs, which appear to arise de novo, and the secondary AMLs, which
can develop from myelodysplasia and other hematological diseases, such as myeloproliferative diseases (s-AML) or follow previous treatment with highly mutagenic cytostatic drugs or after irradiation for various types of primary tumors (therapy related, t-AML). Secondary AMLs are more often observed in elderly patients and are associated with a worse prognosis. The myelodysplastic syndromes (MDSs) are very heterogeneous hematopoietic disorders characterized by increasing deficiency of normal bone marrow function, pancytopenias, and tendency to progress to AML. Clonal cytogenetic abnormalities can be identified in approximately 50% of MDS. Also the MDSs can
occur de novo or as therapy-related. The majority of patients with MDS and AML
diagnosed at major centres are de novo diseases (80-90%), whereas the
therapy-related MDS/AMLs are less frequent (10-20%). The International Prognostic Score System (IPSS) helps to identify MDS patients with higher risk of progression to AML or with bad prognosis, and it is based on the percentage of blasts in the bone marrow, on the grade of cytopenias, and on BM cytogenetic
Chapter 1 – Introduction
analysis. The genetic alterations in the de novo and the therapy-related cases are
often the same in MDS and in AML, although they occur with different frequencies.
1.2.4. Chromosomal translocations in AML
Chromosomal aberrations are a common finding in many cancers and their occurrence correlates with the biology and the progression of the tumor. In the solid cancers the diagnosis is made relatively late in their development, and it is supposed that several chromosomal rearrangements can accumulate after an initial genetic event. In the leukemia the presence of clonal chromosomal aberrations represents at the moment the strongest prognostic factor for prediction of response to therapy and survival, and the cytogenetic analysis of AML samples allows the classification of three risk groups: favourable, intermediate, or adverse. In 80% of AML cases at least one chromosomal rearrangement has been reported (Pandolfi 2001) and over 100 chromosomal translocations have been cloned (Gilliland 2002). Leukemia-associated fusion proteins generally function as aberrantly activated signalling factors or transcriptional regulators that directly perturb the proliferation and differentiation program of hematopoietic cells, as it has been shown from a variety of experimental models. One of the components of each fusion protein is often a
transcription factor (AML1, CBFβ, or RARα) whereas the fusion partner has
normally a different function, like the control of cell survival and apoptosis as well as structural function in the nucleus like PML. Interestingly, in many AMLs the type of fusion protein often defines the specific stage of maturation arrest in the differentiation cascade (Tenen 2003), and they seems to act through common mechanisms, like the recruitment of aberrant corepressor complexes, alteration of chromatin remodelling, and disruption of specific intracellular compartments (Alcalay 2001). It has been demonstrated that the chimeric fusion protein or the activation of a certain proto-oncogene by a single translocation event can be responsible alone for the transformation (Rabbitts 1991, Rabbitts 1994). The cloning of chimeric genes and the assessment of their oncogenic potential using e.g. mouse bone marrow transplantation models is one of the useful tools to identify new proto-oncogenes and one of the first steps that can be taken to
Chapter 1 – Introduction
understand the mechanisms of leukemic transformation. The most common chromosomal abnormalities are reported in Table 1.2.4.
Rearrangement Frequency Prognosis
AML1-ETO t(8;21)(q22;q22) 5-12% Favourable
Inv(16)(p13q22) or t(16;16)(p13;q22) (CBFβ-MYH11) 10-12% Favourable
PML-RARα t(15;17)(q22;q12) and variants 5-8% Favourable
Involving MLL 11q23 5-6% Intermediate
Others, e.g. del(5q), -5, del(7q), -7 5-6% Unfavourable
Complex karyotype (≥ 3 abnormalities) Unfavourable
Table 1.2.4. Common chromosomal abnormalities found in AML. AML1 encodes Core-Binding Factor α (CBPα); ETO is Eight-Twenty-One gene; CBFβ: Core-Binding Factor β; MYH11 encodes smooth Muscle mYosin Heavy chain; PML: ProMyelocytic Leukemia gene; RARα: Retinoic Acid Receptor α; APL: acute promyelocytic leukemia; MLL: Mixed Lineage Leukemia gene.
1.3 The homeobox genes
1.3.1. The homeobox genes in hematopoiesis and leukemogenesis
Homeobox genes encode nuclear transcription factors, which regulate the morphogenesis and cellular differentiation during the embryonic development of several animals. In mammals, Hox genes are mainly grouped in the primordial Hox cluster and in the ParaHox cluster, which are supposed to derive from the duplication of a putative ProtoHox cluster of four genes early in evolution (Fig 1.3.1a, Garcia-Fernandez 2005a and 2005b). Moreover, the homeobox genes of vertebrates can be classified in two subgroups: the clustered Hox genes, which are linked on a chromosome, and the non-clustered, or divergent, homeobox genes. The highly conserved homeobox sequence motif (homeobox means binding to the DNA), which encodes the homeodomain, a 60 amino-acid helix-turn-helix DNA-binding domain, is the common element defining these two broad classes of genes. Based on this homology, different Hox genes have been shown to recognize similar regulatory sequences in vitro, although the specific sequence
they recognize, the affinity of DNA binding, and the transactivating potential depend on the co-factors that are recruited, like Pbx and Meis/Prep. The
aminoacidic substitution at position 211 (N→A) has been shown to abolish alone
the DNA binding (Beslu 2004). The clustered homeobox genes (class I homeobox genes) are evolutionary highly conserved, and their organization in clusters mirrors the temporal and spatial expression during the development of body structures along the anterior-posterior body axis (Krumlauf 1994). In
Chapter 1 – Introduction
mammals, this class of genes comprehends 39 hox genes organized into four
genomic clusters (A-D) located on four different chromosomes (HOXA on 7p15,
HOXB on 17q21, HOXC on 12q13, HOXD on 2q31). Additionally 13 paralogous
groups have been identified, which include several Hox genes that belong to different clusters but have similar homeobox sequence (Fig 1.3.1b).
Fig 1.3.1a. Genesis and evolution of Hox and Parahox clusters. It has been postulated that an ancestral ProtoHox-like gene underwent a series of cis-duplications giving rise to an ancestral Hox-like cluster that consisted of the ProtoHox cluster linked to the ancestor of even-skipped homeotic gene (Evx) and mesenchyme homeobox (Meox). Segmental tandem duplications
generated a set of primordial ParaHox, Meox, Hox and Evx genes, which was subsequently separated into two clusters at the level of the posterior ParaHox gene caudal-type homeobox (Cdx) and the Meox gene (red arrow). Subsequent cis-duplications, expansions and genome
duplications led to the current mammalian full set of extended Hox and ParaHox genes, consisting of four clusters of each cluster type (A-D). A further gene cluster, EHGbox (not shown), has been identified, consisting of gastrulation brain homeobox (Gbx), motor neuron restricted (Mnx) and engrailed (En). This cluster derives through a cis-duplication of a founder gene that
was probably linked to the ProtoHox gene. Colour codes for the four paralogous groups are:
Anterior, purple; Group 3, yellow; Central, green; Posterior, red. Gsh, genomic screened
homeobox; Xlox, Xenopus laevis homeobox 8 (Garcia-Fernàndez 2005b).
Hox genes exhibit a high degree of homology to the clustered homeotic genes
(HOM-C) of the fruit fly Drosophila melanogaster, which are located in two gene
clusters, the Antennapedia (Ant-C) and bithorax complexes (BX-C). The study of
Chapter 1 – Introduction
these genes has been initially useful to understand the function of the mammalian hox genes. Non-clustered or non-Hox homeobox genes (class II homeobox genes) are more divergent and numerous (approximately 160 in the humans) (Tupler 2001), and are dispersed throughout the genome. Gene expression analyses of both mouse and human BM samples revealed that the majority of Hox genes of the A, B, and C clusters are expressed in lineage- and stage-specific combinations in HSCs and, for the most part, are preferentially expressed in HSC-enriched subpopulations and in immature progenitor compartments and downregulated during differentiation and maturation (Sauvageau 1994, Pineault 2002). Nowadays, the expression of homeobox genes has been characterized for normal tissues, for cancer cells as well as for other diseases, like metabolic disorders. In the normal development the homeobox genes are controlling proliferation and differentiation, which are major clues in the cancer development. In fact it is known since many years that homeobox genes play an important role in the oncogenesis, and in particular they can be disregulated in AML by several mechanisms, like chromosomal translocations.
For example, in the t(7;11) and t(2;11) the HOXA9 and HOXD13 are
dysregulated through fusion with the gene encoding the nucleoporin 98 kDa (NUP98) nuclear protein (Nakamura 1996, Raza-Egilmez 1998, Kroon 2001,
Pineault 2004). The overexpression of HOXA9 alone has been reported to
strongly correlate as single gene with the poor prognosis in a set of 6817 AMLs (Golub 1999). Another well characterized example is represented by the
chromosomal aberrations involving the MLL gene (11q23), that leads to the
overexpression of the hox genes HOXA6, HOXA7, HOXA9, and the Hox cofactor
myeloid ecotropic viral integration site 1 (MEIS1) (Schoch 2003). This expression
pattern is common in many AML patient samples (Lawrence 1999; Kawagoe
1999, Yeoh 2002). The MLL (mixed lineage leukemia) gene is the human
homolog of the Drosophila Thritorax gene and is the archetypal member of the
Trithorax group of genes that encode chromatin modifiers that are required for
the proper maintenance of hox genes expression during development.
Rearrangements involving MLL gene, generated as a consequence of
chromosomal translocations fusing N-terminal sequence of MLL to 1 of over 40
functionally diverse groups of C-terminal fusion partners, constitute 5% of all AML
Chapter 1 – Introduction
cases and 22% of those with acute lymphoblastic leukemia (De Braekeleer 2005). Interestingly, also in a number of AML cases, bearing rarer translocations,
like t(8;16)(p11;p13) where the MYST3-CREBBP fusion gene is expressed, the
hoxgenes HOXA9, HOXB9, HOXA10, and MEIS1 are also overexpressed.
Interestingly, the upregulation of other genes like HOXC4 has been reported in
the NB4 PML-RARα-positive cell line following all-trans retinoic acid–induced
(ATRA-induced) differentiation, as well as in BM from acute PML patients during
ATRA treatment (Kim 2005). The dysregulated HOX expression has been
confirmed to be a signature of AML, as well as in lymphoid leukemias where MLL
expression is disregulated (Imamura 2002).
Considering their transcriptional specificity, hox genes are able to function as
both transcriptional repressors and activators. By performing in vitro
co-precipitation assays, Shen et al have shown that the CBP-p300 histone acetyltransferase (HAT) is binding to representative Hox proteins from each paralog groups (HOX4, 6, 7, 9, 10, 12, 13), but not to the non-Hox homeodomain cofactors Pbx and Meis. Moreover the Pbx-binding motif within the Hox proteins is not required for CBP binding (Shen 2001). The Hox-CBP interaction variably reduces the Hox-DNA binding: the higher paralogs tested (groups 9 through 11) seemed to show somewhat greater sensitivity to CBP-induced blocking of DNA binding than the lower paralog proteins from groups 1 to 8. This could be explained by the ability of the AbdB-like Hox proteins to directly bind to DNA without cofactors, while Hox proteins from 1 to 8 paralog groups can strongly interact with DNA only in the presence of other cofactors, like Pbx and/or PREP1. Moreover, Hox proteins are not acetylated by CBP, whereas they are reported to even inhibit CBP activity in vitro and in vivo (Shen 2001).
In summary, the Hox proteins are essential for the embryonic development, play a key role in defining the cellular identity and regulate genes involved in the cell division, cell adhesion and migration, morphological differentiation and apoptosis (Ulijaszek 1998) (Fig 1.3.1c). The Hox genes expression is mostly regulated by the Polycomb group proteins (PcG), which were first identified in Drosophila and
are highly evolutionary conserved. They are known to maintain specific repressive states of hox genes expression patterns within body segments development from flies to humans (Lewis 1978). The PcG proteins are components of multimeric transcriptional repressor complexes, which include
Chapter 1 – Introduction
DNA-binding and chromatin remodelling factors, as well as noncoding small RNAs, and RNA interference machinery, and they are essential in maintaining cell fate, sustaining stem cells and lineage specification (Rajasekhar 2007).
Fig 1.3.1b. Clustered hox genes organization. Each of the four cluster contains 8-11 genes, which are located on four different chromosomes (Chr.7, 17, 12, and 2, respectively). Identical clusters can be aligned into paralogous groups (identical colours) based on the sequence homology within their homeobox regions, and with the homeotic genes of the Drosophila HOM-C cluster. A box above a gene summarizes the important hematopoietic phenotypes exhibited upon engineered overexpression of that hox gene. Brackets under one or more genes, denote mouse knockout models where the role of the indicated gene(s) was assessed in hematopoiesis (Argiropoulos 2007).
Chapter 1 – Introduction
Fig 1.3.1c. Hox downstream targets include a significant number of factors involved in numerous cellular processes like organogenesis, cellular differentiation, cell adhesion and migration, cell cycle and apoptosis (Svingen 2006).
Recently, Hox proteins have been reported to act as general downstream DNA-binding proteins recruited by BMP/Smad pathway, which regulate a broad range of morphogenetic events during embryonic development, and their transcriptional activities are regulated by Smad proteins (Li 2006). Additional studies have revealed that Hox genes transcription is controlled by a modular system of enhancers located within a few kilobases up- or downstream of the gene. Generally, each enhancer can orchestrate tissue- and spatially-specific subsets of expression patterns and can often independently modulate other regulatory factors. Through accurate analysis of these regulatory regions other important regulators of Hox gene expression have been identified, like the retinoic acid and retinoid X receptors, the Cdx family proteins, Krox20, Kreisler, members of the AP-2 family of transcription factors, and Sox/Oct heterodimers. Intriguinly, Hox proteins themselves via interaction with the Pbx and Meis families of cofactors are capable to regulate the Hox genes expression themselves. Some of these factors are involved in the leukemogenesis. For example, the caudal-type homeobox transcription factor 2 (CDX2), which belongs to the ParaHox cluster, affects Hox gene expression during embryogenesis, is aberrantly overexpressed in 90% of patients with AML, whereas it is absent in normal hematopoietic progenitors (Scholl 2007), and its overexpression induces a transplantable AML in murine models (Rawat 2004). Taken together, these observations allow gaining additional alternative explanations for Hox-induced leukemogenesis and contribute to better understand the hierarchy of Hox genes regulation in AML (Rice 2007).
1.3.2 Cofactors of the Hox genes
The Hox genes have been reported to need the interaction with heterologous cofactors to display their functional specificity. The cofactor Pbx1 belongs to subclass of homeodomain proteins, named PBC family, where PBC indicates the conserved motif at the N-terminus of their homeodomain. This PBC subclass together with the MEIS family belongs to the TALE superclass of non-Hox homeodomain proteins, characterized by a Three-Amino-Acid-Loop Extension
Chapter 1 – Introduction
within the homeodomain. Pbx1 and Meis1 were both found expressed in subpopulations of BM cells expressing Hox genes, but also had distinct gene-specific differences in their expression pattern throughout hematopoiesis. The primary interaction between Pbx and Hox occurs between the three amino acids loop in the Pbx homedomain, and a tryptophan-containing hexapeptide motif
(YPWM) N-terminal to the homeodomain in almost all Hox proteins, with the
exception of the paralog groups 11-13 (Chang 1995, Chang 1996). In particular, Hox9 has been shown to directly interact with Pbx and Meis/Prep proteins separately, Hox13 only with Meis/Prep, and Hox10 with both Pbx and Prep. Moreover, the occurrence of functional trimeric interactions between Hox, Pbx and Meis proteins on native Hox enhancers have also been observed (Jacobs 1999). These interactions seem to be Hox protein- and cellular context-dependent in the regulation of hematopoietic cell behaviour. It has been suggested that the Hox genes acquire a more stringent DNA binding selectivity
when they cooperatively bind to these cofactors (Mann 2000), but the in vivo
effects of this binding are not yet completely understood. Depending on the target, Hox-Pbx complexes can act as transcriptional activators or as transcriptional repressors (Fig 1.3.2). Moreover, it has been suggested from several works that the transcriptional effect is not only determined by the presence or absence of cofactors, but also and especially by the recruitment of other factors into the complex depending on the cell signalling involved and/or on the extracellular signals (Saleh 2000).
Fig. 1.3.2. A model for the function of Hox-Pbx complexes. The N-terminal activation and repression domains of Hox and Pbx proteins are believed to make intramolecular contact with their respective homeodomains. When Hox and Pbx or other cofactors of the Meis/Prep family interact on cooperative sites on DNA, their domains became exposed to the interaction with coactivators and corepressors such as CBP and HDAC1 and -3. In certain cellular conditions, the
Chapter 1 – Introduction
net repressor function dominates. However, in response to enhanced PKA signalling or to treatment with the HDAC inhibitor TSA, net activation function could prevail (top). Other changes could affect this balance, like an increase in the amount of coactivator or an increase of affinity for the Hox N-terminus or for Pbx. However, other possible interactions cannot be excluded. The black vertical arrows indicate increases or decreases in HAT (e.g. CBP) or HDAC activity. AD, HOX activation domain; RD, PBX repression domain; black box, homeodomain; small white circle, HOX YPWM motif (Saleh 2000).
In fact, the abolishment of Pbx-binding with a Hox protein does not only lead to the loss of Hox function, but can even antagonize the Hox downstream effects. Interestingly, the interaction with Pbx has been recently shown to reduce the Hoxb4-dependent self-renewal of hematopoietic stem cells (Beslu 2004). However, this effect was observed under overexpression of Hoxb4, which may not completely reflect in vivo functional roles of Hoxb4-Pbx interaction.
1.3.3 Hoxb4
Hoxb4 (initially called Hox-2.6) has been described for the first time in the mouse in 1988 as related to the Drosophila Deformed gene (Dfd), encoding a protein of
250 amino acids. Interestingly, in several tissues the presence of different transcripts (at least 6 ranging from 2.4 to 10 kb), which are differentially detected with the time during embryonal and post-natal development, has been reported (Graham 1988). Nowadays, Hoxb4 is known to significantly increase self-renewal and proliferation of primitive murine and human hematopoietic progenitor cells in
vitro and in vivo without perturbing the differentiation (Buske 2002). The Hoxb4
gene is conserved in chimpanzee, dog, cow, mouse, rat, chicken, and zebrafish, and it is expressed in fetal and adult tissues. In situ hybridization analysis of
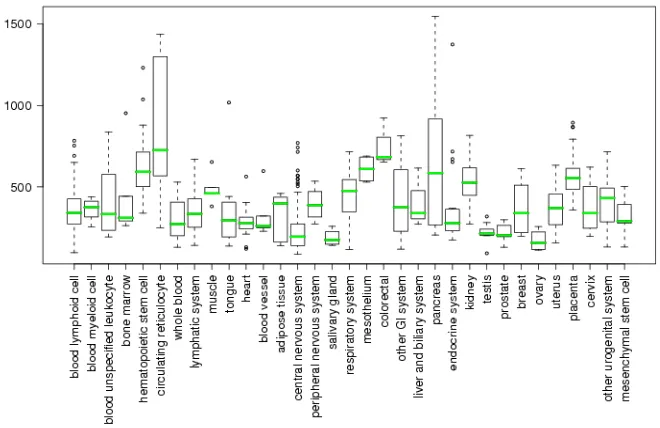
mouse embryos showed that the Hoxb4 is expressed in tissues derived from the ectoderm: spinal cord, hindbrain, dorsal root ganglia, and the Xth cranial ganglia. In mesodermal derivatives, Hoxb4 is expressed in the kidney, the mesenchyme of stomach and lung, and the longitudinal muscle layer of the gut, whereas it is not detected in structures derived from embryonic endoderm (Graham 1988). At present, several screening methods have been employed to define consensus databases, which are based on all the reports where expression profiling results of known genes have been investigated. In the database of GeneSapiens (www.genesapiens.org) it is possible to obtain information about the transcriptome of human genes. In Fig. 1.3.3a and 1.3.3b the available data regarding the expression of Hoxb4 in normal tissues and in cancers are reported.
Chapter 1 – Introduction
Brun et al have shown in Hoxb4-deficient mice that the lack of this gene leads to hypocellularity in hematopoietic organs (spleen and BM) and impaired proliferative capacity, demonstrating that it is not required for the generation of HSCs or the maintenance of normal hematopoiesis. In the murine model established from these authors the animals showed a reduction in red blood cell counts and in hemoglobin values, and a mild reduction in the numbers of primitive progenitors and stem cells in adult BM and fetal liver, whereas lineage distribution was normal. In these Hoxb4-deficient mice the primitive progenitors had normal cell cycle kinetics during endogenous hematopoiesis, whereas the
proliferative capacity of BM Lin- Sca1+ c-kit+ stem and progenitor cells was
reduced in vitro and in vivo after transplantation of BM and fetal liver derived
stem cells.
Fig. 1.3.3a. Expression of Hoxb4 in normal tissues. (www.genesapiens.org).
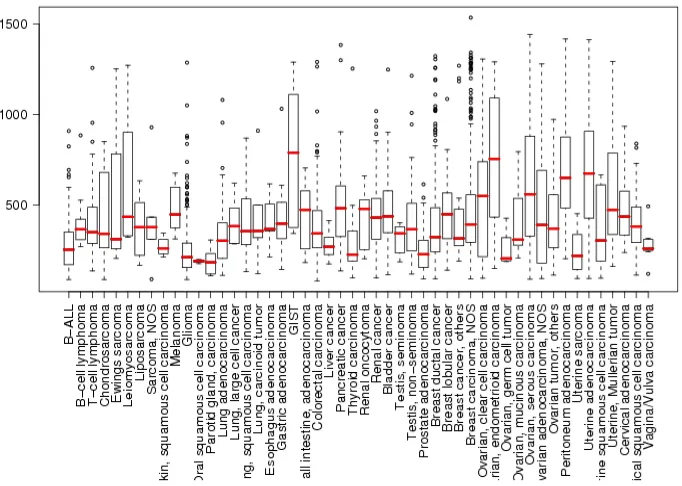
Interestingly, in this mouse model the lack of Hoxb4 led to a change in the expression of several other Hox genes and of genes controlling the cells cycle regulation, as demonstrated by mRNA analysis from fetal liver (Brun 2004). Several others works have reported Hoxb4 overexpression in different types of cancer, like ovarian carcinoma (Hong 2010), cervical carcinoma (Lopez 2006), osteosarcoma, lung and breast carcinoma (Bodey 2000). However, the significance of these findings has still to be investigated.
Chapter 1 – Introduction
Fig. 1.3.3b. Expression of Hoxb4 in cancers. (www.genesapiens.org).
In the last decades many efforts have been focused to understand the regulation of Hoxb4 expression. The transcription factors NFY and YY1 have been reported to bind the promoter and two intron sequences of Hoxb4 regulating its expression during the embryonic development (Gilthorpe 2002). Additionally, the transcription factors USF-1, USF-2 and MITF have been shown to bind to the E-box binding site within the Hoxb4 promoter. USF-1 and USF-2 induce Hoxb4 expression in presence of signals to self-renew in stem cells downstream of activated MAPK pathway (Giannola 2000). Some promoter sequences seem to be determinant for the maintenance of the expression initiated by the intronic enhancer, whereas other sequences in the 3’ untranslated region (UTR) are responsible for the preservation of the specific and correct anterior boundary in the paraxial mesoderm throughout embryonic development. Other control mechanisms have been suggested to occur at transcriptional and post-transcriptional levels. It has been shown that the 3’UTR is required to destabilize
Hoxb4 transcripts, while the 5’UTR to stabilize them, although in different
domains of the paraxial mesoderm (Brend 2003). Recently, the homeodomain transcription factor Prep1 has been shown to bind to the 3’UTR of the mRNA of Hoxb4 leading to the inhibition of its translation and the full length of the 3’UTR
Chapter 1 – Introduction
has been shown to be necessary for this effect (Villaescusa 2009). Although the promoters and other controlling regions of the majority of Hox genes maybe contribute to the proper spatio-temporal regulation of these genes, their role in the development of cancer disease remain unknown.
1.3.3.1 Hoxb4 in the hematopoiesis
Several hox genes of the Hox A and B clusters, such as HOXB3 and HOXB4, are
highly expressed in the most primitive hematopoietic cell types, like the CD34+
cells of the BM (Sauvageau 1994) (Fig. 1.3.3.1a). The engineered overexpression of Hoxb4 in hematopoietic progenitor cells induces a dramatic increase in the proliferation and self-renewal of HSCs without affecting the normal differentiation. Moreover, this gene is the only Hox gene, which is able to convert in vitro cultured progenitor cells from the early yolk sac and differentiating
embryonic stem cells into HSCs capable to long-term engraft lethally irradiated primary and secondary recipient mice (Kyba 2002). In a recent report a Hoxb4-YFP reporter mouse model has been used to investigate in detail its normal expression in the hematopoietic system, where it has been shown to be expressed in BM Lin-Sca1+c-kit+ cells, in AGM-derived CD45+CD144+ cells, in HSCs isolated from yolk sac and placenta, whereas its expression in the fetal liver HSCs was significantly lower than in the BM derived HSCs (Hills 2011). Despite these determinant reports on the Hoxb4 activity, the induced expansion of HSCs has not been yet completely clarified.
In Fig. 1.3.3.1b the structures of the Hoxb4 gene (A) and Hoxb4 protein (B) are
reported.
C D 3 4
-C D 34+/C D 3 8lo w C D 3 4+/
C D 3 8m e d /h ig h
H O X B 4 H O X B 3
H O X A 1 0
H em a to p o ie tic C e ll N u m b e r C D 3 4
-C D 34+/C D 3 8lo w C D 3 4+/
C D 3 8m e d /h ig h
H O X B 4 H O X B 3
H O X A 1 0
H em a to p o ie tic C e ll N u m b e r
Fig 1.3.3.1a. Expression of hox genes (HoxB3, B4 and A10) in human BM cells. Hox genes are expressed in early hematopoietic progenitor cells, and their expression decreases during the differentiation (Sauvageau 1994).
Chapter 1 – Introduction
A)
PBX-ID HD
Fig. 1.3.3.1b. A) Structure of the Hoxb4 gene. B) Structure of Hoxb4 protein. PBX-ID: Pbx
interaction domain; HD: homeodomain.
In the protein sequence two known domains are present: the Pbx-interacting domain at position 142-147, and the homeodomain at position 163-218. As other Hox proteins, Hoxb4 dimerizes with the cofactor Pbx1. Mutational studies, where
the Pbx-binding motif YPWM was mutated by the substitution W→G, have shown
that the direct Hoxb4-Pbx interaction is not required for the HSC-expanding activity of Hoxb4, as mentioned above. Interestingly, the down-regulation of Pbx1 through a vector encoding its antisense sequence led to a further increase of Hoxb4-mediated HSCs expansion. This suggests that these two genes might affect the hematopoietic cells behaviour by different mechanisms (Krosl 2003).
The deletion of the homeodomain of Hoxb4 (substitution N→A) leads to the loss
of its DNA-binding ability and thereby to the loss of its proliferation activity (Beslu 2004). Between the amino acids 71 and 123 there is a proline rich region where no structural domains have been described so far. The function of this putative domain has been investigated in the present work.
1.3.3.2 Hoxb4 as amplification tool of HSCs
A number of Hox genes have been overexpressed using e.g. retroviral vectors in early murine as well as human hematopoietic progenitor cells, showing significant effects on the proliferation and differentiation programs. As unique Hox gene,
Hoxb4 dramatically enhances the proliferation of primitive murine hematopoietic
cells both in vivo and in vitro without perturbing their differentiation or the
production of mature progeny (Thorsteinsdottir 1999, Kondo 2003). By retroviral transduction of primitive lineage-negative human cord blood cells, Hoxb4 has been shown to increase the number of secondary CFCs both in semisolid and
142-147
118-123 163 218
Proline-rich Region
71 88 B)
A)