COMMUNITY EDUCATION IN BRITISH URBAN PRIORITY AREAS WITH SPECIAL REFERENCE TO HULL
JAMES ANTHONY McELLIGOTT
Submitted to the University of London Institute of Education
for the Degree of DOCTOR OF PHILOSOPHY
(Ph.D.)
BBL LONDIN.
ABSTRACT
This thesis develops a model of community education for non traditional adult learners from the least socially and educationally advantaged groups living in the priority areas of urban Britain. The model is investigated through a case study of a community education project situated within North Hull.
The thesis is organised into six chapters. Chapter One commences with a detailed analysis of urban priority areas and examines the cumulative effects of post war material conditions, social dislocation and educational underachievement. Educational proposals for ameliorating the situation are reviewed, including the idea of closer links with the home and neighbourhood as part of a community education solution.
Chapter Two develops this emerging theme of community education by examining compensatory and reconstructionist models of British community education in which USA models of compensation and the idea of community problem solving became influential
Following this early discussion, a model for community education in priority areas is proposed in Chapter Three. The model has the overall purpose of developing adult learners and achieving more open and accessible institutions through a two stage continuum of learning opportunities.
Chapter Four describes the North Hull Community Outreach Project which investigates the model in practice. In Chapter Five an evaluation of the case study is carried out to analyse the potential value of the model.
Chapter Six brings together the main findings of the thesis. These suggest that the educational problems of non traditional adult learners are the result of the cumulative interaction between situational, institutional and dispositional factors in the priority area situation
which serve to diminish the importance of education.
.CONTENTS
Page
LIST OF TABLES AND MAPS 7
LIST OF FIGURES 8
INTRODUCTION 9
CHAPTER ONE: THE URBAN PRIORITY AREA CONTEXT
Introduction 16
Part 1. Urban Priority Areas in Context 20 1.1 Urbanisation and suburbanisation 20
1.2 Economic decline 26
1.3 Housing conditions 31
1.4 A gradient of urban disadvantage 35 1.5 Dislocation and social polarisation 41
in priority areas
Part 2. Education and Disadvantage 47 2.1 Educational underachievement 47 2.2 Educational responses in priority areas 52
Appendices 61
Notes 63
CHAPTER TWO: COMMUNITY EDUCATION AND URBAN PRIORITY AREAS
Introduction 69
Part 1. Educational Compensation and Urban 74 Priority Areas
Page Part 2. The Reconstructionist Strand of Community 94
Education
2.1 The notion of community regeneration 95 2.2 The community oriented relevant curriculum 1C4 2.3 Adult education and community action 111 2.4 Community control and participative management 116
Part 3 Developmental Issues 123
3.1 Views about priority area life 123 3.2 The concern over community problem solving 126 3.3 The issue of community control 130
and participation
Notes 133
CHAPTER THREE: A MODEL FOR COMMUNITY EDUCATION
Introduction 142
Part 1. Barriers to Learning 147
1.1 Situational barriers 148
1.2 Institutional barriers 150
1.3 Dispositional barriers 152
Part 2. Developing Locally Based Educational 157 Activity
2.1 Establishing contact in local areas 158 2.2 Negotiation and ownership of learning 163 Part 3. Influencing Institutionally Based Provision 170 3.1 Working towards equal educational opportunities 171 3.2 Supporting learners in education 175 3.3 Developing responsive institutions 183 Part 4. Towards a Model for Community Education 193
Page CHAPTER FOUR: COMMUNITY EDUCATION IN PRACTICE: THE
NORTH HULL COMMUNITY OUTREACH PROJECT
Introduction 204
Part 1. A Profile of Hull and the Orchard Park Estate 208
1.1 Population statistics 211
1.2 Employment trends 213
1.3 Housing conditions 216
1.4 Educational provision 219
Part 2. Establishing the North Hull Community 223 Outreach Project
2.1 The LEA and community education 223
2.2 Launching the Project 226
2.3 Methodology for the Project 230 Part. 3. Describing the North Hull Community 233
Outreach Project
3.1 Building the Project team 234 3.2 Identifying activities and establishing 237
networks
3.3 Developing educational activities 241 3.4 Management and ownership of the Project 252
Appendices 259
Notes 263
CHAPTER FIVE: EVALUATING THE NORTH HULL COMMUNITY OUTREACH PROJECT
Introduction 269
Part 2. Issues Raised in the Evaluation of the Project
2.1 The organisation of the Project
2.2 Negotiation and ownership in education 2.3 Concluding remarks
Appendix Notes
Page 296
296 307 311 313 315
CHAPTER SIX: CONCLUSION 318
Notes 336
LIST OF TABLES AND MAPS_ '
Page Tables
1. Average annual population growth rates by type 22 of district, mid-1977 to mid-1990
2. Population change in urban areas 23 3. Changes in Employment. 1951-1981 27
4. Unemployment. Rates 1981 29
5. Indices of social deprivation - ranking of 36 most deprived areas
6. Gradient of deprivation 38
7. Proportions of recruits who left school at 15, 48 16, 17 or 18+ in relation to occupation of
father (1959-60)
8. Percentage of 18 year olds entering university 49 by social class 1961 and 1968
9. Home candidates and acceptance by social class 49
10. EPA Mean EPVT and SRA Scores 51
11. Broad occupational distribution of employment 1981 61
12. Disadvantaged households 62
Maps
1. Humberside: National Context and County Map 209 2. Orchard Park Estate: Ward Profile 210 3. North Hull Community Outreach Project: 229
Area of Benefit
LIST OF FIGURES Page 1.
2. 3.
Inner Areas 1981: Ethnic Minorities
Lacking exclusive use of basic amenities The cycle of powerlessness
24 33 42 4. Patterns of achievement in verbal skills at
various grade levels by race and region
77
5. Urban and Rural Britain: overlapping sets of problems
96
6. Obstacles to re-entry 155
7. The Community Education Process 193 8. A Community Education Model 194 9. Population profile for Hull and Orchard Park 211 10. Social class composition for Hull and Orchard Park 212 11. Type of employment of residents 213 12. Unemployment rates for Hull and Orchard Park 1981 214
13. Unemployment rates 1991 215
14. Household type: Hull and Orchard Park 216
15. Disadvantaged households 217
16. Free school meals and clothing grants: percentage take up
220 17. GCSE passes and staying on rates: 220
Orchard Park Estate
18. Qualifications: why not? 221
19. North Hull Community Outreach Project: System of Management and Support
227
20. Outreach Project Staffing Structure 234
21. Local Group Support 238
22. Involvement by Orchard Park Residents in 249 Hull College of Further Education Courses
23. Base Users Group 257
INTRODUCTION
I have worked for the past twenty years in a variety of educational contexts as a teacher, development officer and latterly, in local authority administration. My special field of interest has been community education in the inner city where I have worked with parents in inner London, developed adult education and youth work strategies in Coventry and Birmingham and led a variety of initiatives in post sixteen education in Humberside.
It has always puzzled me throughout my endeavours that despite the efforts of community educators'in areas experiencing severe disadvantage, the involvement and subsequent performance of children and adults from such places has been disappointing. This despite community education in Britain having a long-standing reputation as the user friendly arm of mainstream educational provision and, as a consequence, often been expected to provide a point of connection between education and learners who have become disengaged from educational opportunities.
conditions arising out of economic and social decay has proved too great a hurdle for community education alone to overcome.
The time has come to have a closer look at the role and purpose of community education in urban areas undergoing serious socio-economic decline. The social and economic changes of the past fifteen years particularly, have produced a new condition for education which has been reflected in legislation. Market and competitive forces have become the dominant factors guiding educational activities, jeapordising the kind of developments outside of the mainstream which community education has promoted.
The consequence of this position has been to lessen the scope for developing activities to support less advantaged groups which may be regarded as on the margins of educational provision and non-profitable. Yet the needs that such programmes set out to address are no less, and arguably, greater, amongst the groups in question. It is therefore imperative that community education continues to respond to these needs and develop strategies to encourage the re-engagement of non-traditional adult learners in education.
in education and proposing ways in which institutions can become more open and accessible.
There is nothing particularly new in this proposal; community educators in urban areas would argue that their central purpose is to seek the educational participation of disadvantaged groups. That is not being disputed. What is suggested however, is that the overtly social bias of past community education theory and practice has led to the development of educational strategies that have operated on the margins of the educational mainstream with proposals that have remained outside of the main body of provision. The model of community education proposed in this thesis is not concerned with creating an alternative educational methodology nor a pre conceived set of solutions labelled community education. Rather it seeks to raise the educational involvement of people who have remained outside of the system as adults by actively creating routes back into education through a developmental role for community education, stressing the importance of change in institutional practice which leads to the encouragement of greater access and participation in the main educational systems by less advantaged groups.
providers and institutions undertake. Thus, in urban areas of decline, the model of community education is distinguished by its approach which takes account of the
material conditions, outreaching in the area in a cautious and developmental process which brings people along to the point at which they can feel confident enough to want access into the main educational opportunities. The institutions then need to be prepared to become open and inclusive to encourage this emerging potential group of participants.
This thesis therefore is concerned with community education in urban areas suffering from decline. In giving consideration to this, the discussion will develop from community education as it has been presented during the post war years to proposals for a new model that takes account of the modern urban educational condition.
The structure of the thesis reflects this purpose and is divided into three main areas:
(i) A detailed examination of the urban and educational context within which community education developed. (ii) The development of a model for community education
based upon this contextualising as well as further and relevant literature and personal experience of twenty
years work in the field of community education.
The thesis is subsequently organised into six chapters. Chapter One commences with a discussion of urban priority areas, reviewing the development from urbanisation to suburbanisation which left the inner areas of many industrial cities experiencing economic and physical decline. The connection between population loss and subsequent social dislocation is argued and the role of education and in particular, community education, in responding to underachievement and disadvantage examined.
Chapter Two develops the emerging theme of community education by considering the influence in Britain of the United States compensatory programmes of the 1960s. The emergence in the UK of positive discrimination strategies in which the stress was on altering the cultural outlook of children and their families is examined and their influence on the early idea of community education analysed. As the compensatory strand in community education became criticised, more radical formulations of community education
were developed and are summarised in the chapter as a broadly reconstructionist approach.
suitability of such an approach in meeting the educational needs of the least educationally advantaged groups.
In Chapter Three therefore, the discussion focuses on a model for community education in which the overall purpose is to develop adult learners and achieve more open and accessible insitutions through a continuum of learning opportunities. In practice, the community education model has a number of key elements which assists in the development of individuals to be able and ready to re-engage in the educational mainstream and encourages educational providers to become more accessible and participative in their acceptance of non-traditional adult learners. The elements are summarised as interventionist, supportive and responsive to reflect the stages and types of community education practice contained in the model.
In carrying out its core purpose the model seeks to equalise educational opportunities for the least advantaged groups in society and in working towards this goal, takes account of the complex interactions of situational, institutional and dispositional factors which serve to inhibit their participation in education.
Chapter Six brings together the main findings of the thesis. These suggest that the problems of the least advantaged adult learners in urban priority areas cannot be seen simply as an issue of the inadequate articulation between educational providers and educational consumers but that the cumulative disadvantages found in the priority area context are so overpowering as to relegate the importance of education. The proposed model has the potential capacity of engaging adults in educational opportunities which may provide them with the skills and knowledge to challenge and possibly change the educational and social inequalities in their situation.
CHAPTER ONE
THE URBAN PRIORITY AREA CONTEXT
INTRODUCTION
The purpose of this thesis is to examine and analyse the development of community education in British urban priority areas with special reference to Hull. The notion of the priority area includes existing and emerging areas in decline, both in the inner cities and amongst some of the peripheral estates of the conurbations. In these areas are gathered disproportionate numbers of people who live on lower incomes or in poverty, have limited employment opportunities, inhabit inadequate housing than elsewhere and persistently record low educational achievements.1 As Harrison suggests, these priority areas are now and "likely to remain, Britain's most dramatic and intractable social problem"2 where the combination of the "worst housing, the highest unemployment, greatest density of poor people"3 serves to materially disadvantage whole areas.
at risk or have become disengaged from the main social and economic mechanisms of society as a result of their situation.
These will include those who are unemployed, people dependent on state benefits, socially vulnerable groups such as pensioners living alone, single parents and many ethnic minorities. Such groups make up the least socially and educationally advantaged sections of society and can be generally found amongst those groups of people who are classified by the Registrar General as Social Class V5 or as various government departments describe, Socio Economic Group 116. Collectively they come from lower social class groups whose lack of money contributes significantly to their deprivation.
The purpose of this chapter therefore, is to provide the context for the discussion in the following chapters on community education in urban priority areas by examining and analysing the material conditions that characterise such areas and disadvantage the groups of people who live there. In carrying out this task, it will be shown that the effect of adverse material conditions has been to increase the social polarisation of priority areas away from the main body of society. As a consequence, concentrations of residents are being dislocated from the main social and economic mechanisms of society because of the severity of their position in the local area.
responses to this evident.failure were concentrated over the post war period on widening access and improving the skills of pupils to meet the growing demands of the economy.8 The emphasis on removing the barriers to educational achievement for the least educationally advantaged focused on strategies which promoted equality of access such as the implementation of comprehensive schooling.9 The early development of the notion of community education which also emerged during the period however, concentrated more on strategies of compensation and on improving the cultural outlook of children and their families through schooling in an attempt to improve performance. The subsequent proposal to develop community schools and create closer links between school, home and neighbourhood contained in the Plowden Reportl° was illustrative of this movement.11
The chapter is consequently arranged in the following two parts to enable an examination and analysis of the priority area context and educational developments to take place.
1. Urban Priority Areas in Context. 2. Education and Disadvantage.
material disadvantage and concentrations of socially vulnerable groups serves to dislocate life within priority areas and further to polarise such areas away from the rest of affluent Britain. Evidence too is produced which suggests that the priority area situation is no longer limited to the older declining inner areas but is now spreading to include other parts of the conurbations in a gradient outwards from the core.
The second part of the chapter focuses on the position of education in relation to disadvantage and is discussed with particular reference to the educational performance- of children from lower social class backgrounds and the range of educational responses which were developed in an attempt to improve achievement.
1. URBAN PRIORITY AREAS IN CONTEXT
The purpose of this first part of the chapter is to describe and analyse five important and related aspects in the material conditions that affect urban priority areas. These are namely:
1. The movement of population associated with the development from urbanisation to suburbanisation during the 20th century and especially from the 1960s.
2. The effects of economic decline in the inner areas of cities.
3. The deteriorating housing conditions in cities.
4. The emergence of a gradient of disadvantage out from the core areas of the conurbations.
5. The existence of dislocation in priority areas and subsequent social polarisation away from main society. It will be argued in this part of the chapter that it is the combination of all these factors which produces the economic, physical and social difficulties of priority areas and provides a particular context which affects education and the performance of learners in such areas.
1.1 Urbanisation and suburbanisation
the USA during the 1920s.13 Essentially he used the MELA to describe a daily urban system using the concept of an urban field linking place of work with residential area; it also included places that were employment cores and those that
were outlying commuting areas.14
Although this explanation has useful definitional value when considering the wider urban system it offers little towards explaining the process which has resulted in over 90 per cent of the British population living in MELAs.15 To describe this process will require an understanding of the development from urbanisation to suburbanisation.
The process of urbanisation, of which the MELA is a functional description, has been occurring since the late 19th century when the early crowding of people and jobs into the urban cores of Britain during the early and middle parts of the 19th century gave way to a movement into the suburbs, smaller towns and rural fringes during the course of the 20th century as industrial and commercial centres developed ou twards 6 The transformation from 19th century urbanisation, when almost three quarters of the population lived in or near the urban centres to 20th century suburbanisation, resulted in the depopulation of the older centres of the urban conurbations and has been summarised by Hall as a process of growth and dispersal.17
population of many inner city areas as people, and employment opportunities, moved directly into suburban areas. Thus between 1961 and 1974, the metropolitan counties and Greater London lost 5.4 per cent of their populations while the rest of Britain had a population increase of 12.8 per cent.19
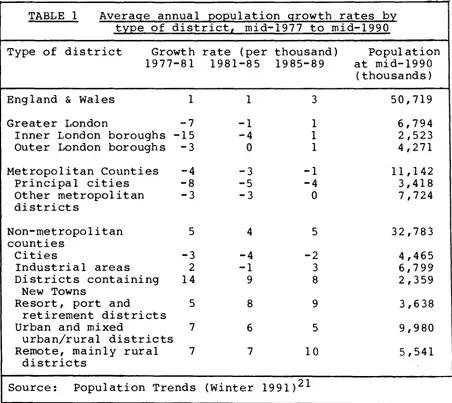
With a growth in the suburban population from 39 per cent to 43 per cent between 1971 and 198120 the movement away from the large connurbations continued unabated. Table 1 shows how between 1988 and 1990 the metropolitan areas and cities in non metropolitan areas continued to lose people while districts away from these areas gained population.
TABLE 1 Average annual population growth rates by type of district, mid-1977 to mid-1990
Type of district Growth rate (per thousand) Population 1977-81 1981-85 1985-89 at mid-1990
(thousands) England & Wales 1 1 3 50,719
Greater London -7 -1 1 6,794
Inner London boroughs -15 -4 1 2,523 Outer London boroughs -3 0 1 4,271 Metropolitan Counties -4 -3 -1 11,142 Principal cities -8 -5 -4 3,418 Other metropolitan
districts
-3 -3 0 7,724
Non-metropolitan counties
5 4 5 32,783
Cities -3 -4 -2 4,465
Industrial areas 2 -1 3 6,799
Districts containing 14 9 8 2,359 New Towns
Resort, port and
retirement districts
5 8 9 3,638
Urban and mixed
urban/rural districts
7 6 5 9,980
Remote, mainly rural districts
7 7 10 5,541
TABLE 2 Population change in urban areas 1971-1981
Area Population
Change (%)
1. Hull inner -35.8
2. Nottingham inner -31.3
3. Manchester and Salford inner -25.5
4. Liverpool inner -23.1
5. Lambeth special area -23.0
6. Glasgow -22.0
7. Derby inner -20.1
8. Birmingham inner -19.3
9. Hackney and Islington -19.1
10. Other Inner London -17.1
11. Docklands special area -16.9 12. South Yorkshire inner (Sheffield) -16.0 13. Teeside inner (Hartlepool, Middlesborough
and Stockton)
-15.6 14. Merseyside peripheral (Knowsley special area) -15.3 15. Haringey, Kensington and Chelsea, Westminster -15.0 16. Inner West Yorkshire (Leeds and Bradford) -14.4
17. Southampton inner -14.1
18. Inner Tyne and Wear (Newcastle and Gateshead) -13.8
19. Bristol inner -13.5
20. Other Merseyside inner -13.2
21. Plymouth inner -13.1
22. Other inner Greater Manchester -11.5
23. Stoke inner -11.5
24. Portsmouth inner -11.3
25. Rest of Outer London - 9.0
26. Brent and Ealing special area - 8.7 Source: Begg and Eversley (1986)22
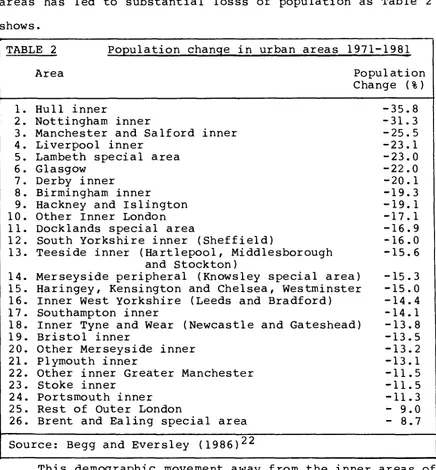
Thus, while there was a general overall increase in growth, all the metropolitan counties continued to lose population, as did cities in non metropolitan areas, with smaller urban areas, resort and remote rural areas experiencing increased growth. The resulting post war demographic trends hence, was for a shift of population away from the centres of the conurbations towards a substantial growth in the suburbs. This movement away from the inner parts of the larger urban areas has led to substantial losss of population as Table 2 shows.
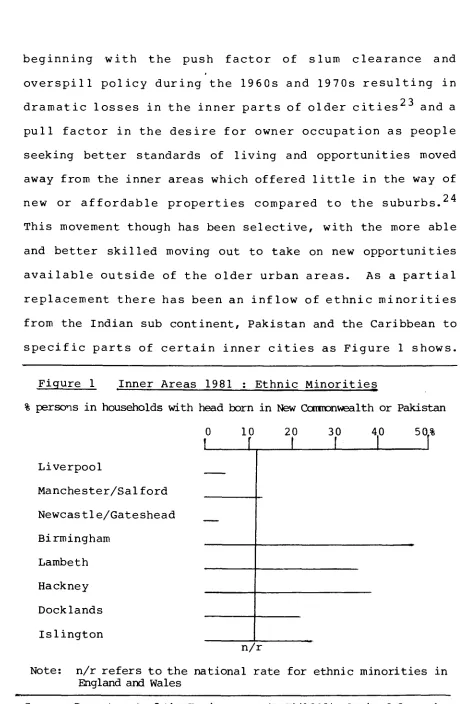
beginning with the push factor of slum clearance and overspill policy during the 1960s and 1970s resulting in dramatic losses in the inner parts of older cities23 and a pull factor in the desire for owner occupation as people seeking better standards of living and opportunities moved away from the inner areas which offered little in the way of new or affordable properties compared to the suburbs.24 This movement though has been selective, with the more able and better skilled moving out to take on new opportunities available outside of the older urban areas. As a partial replacement there has been an inflow of ethnic minorities from the Indian sub continent, Pakistan and the Caribbean to specific parts of certain inner cities as Figure 1 shows.
Figure 1 Inner Areas 1981 : Ethnic Minorities
% persons in households with head born in New Commonwealth or Pakistan 0 10 20 30 40 51% Liverpool
Manchester/Salford Newcastle/Gateshead Birmingham
Lambeth Hackney Docklands Islington
n/r
Note: n/r refers to the national rate for ethnic minorities in England and Wales
priority areas as those living within and that many people in priority areas would not be classified as being poor.31
However a substantial problem does exist amongst the population in inner priority areas particularly if the indicators of deprivation used to designate urban priority areas for assistance through the Urban Programme are considered. The criteria used, namely, unemployment, pensioners living alone, single-parent families, overcrowding, houses which lack basic amenities and ethnic minority populations, are all direct measures of poverty and produce a picture of widespread material and social disadvantage. Two features which serve to particularly materially disadvantage residents in priority areas are declining economic conditions and the physical deterioration of the housing stock. These aspects of priority area life will be the concern of the following sections commencing first with an examination of economic decline.
1.2 Economic decline
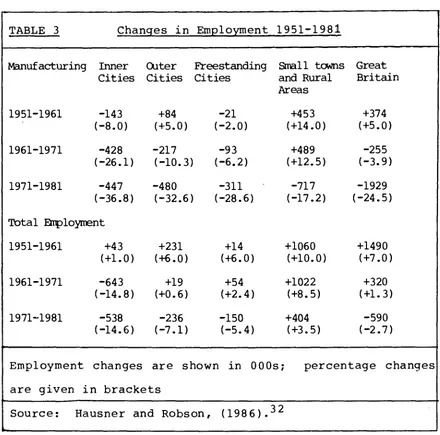
in the inner cities were, over the post war period, rapidly declining, as Table 3 shows.
TABLE 3 Changes in Employment 1951-1981
Manufacturing Inner Cities
Outer Freestanding Small towns Cities Cities and Rural
Areas
Great Britain
1951-1961 -143 +84 -21 +453 +374 (-8.0) (+5.0) (-2.0) (+14.0) (+5.0) 1961-1971 -428 -217 -93 +489 -255
(-26.1) (-10.3) (-6.2) (+12.5) (-3.9) 1971-1981 -447 -480 -311 -717 -1929
(-36.8) (-32.6) (-28.6) (-17.2) (-24.5) Total Employment
1951-1961 +43 +231 +14 +1060 +1490 (+1.0) (+6.0) (+6.0) (+10.0) (+7.0) 1961-1971 -643 +19 +54 +1022 +320
(-14.8) (+0.6) (+2.4) (+8.5) (+1.3) 1971-1981 -538 -236 -150 +404 -590
(-14.6) (-7.1) (-5.4) (+3.5) (-2.7)
Employment changes are shown in 000s; percentage changes are given in brackets
Source: Hausner and Robson, (198 6).3 2
provided by these industries for a predominantly low skilled workforce had subsequently disappeared with little alternative investment by new industry. Any growth in white collar jobs which occurred in either inner or outer areas largely attracted employees from the outer rings rather than those from the central areas of cities which contained disproportionate numbers of unskilled workers. Thus it was the combination of the absolute decline in the number of manual jobs and the higher than average concentration of manual workers in the inner areas which created a mismatch between employment opportunities and the skills available in such areas. Thus, many of the new job opportunities that were becoming available required a more skilled workforce, particularly in the growing demand from clerical, administrative and service industries. The consequence of a
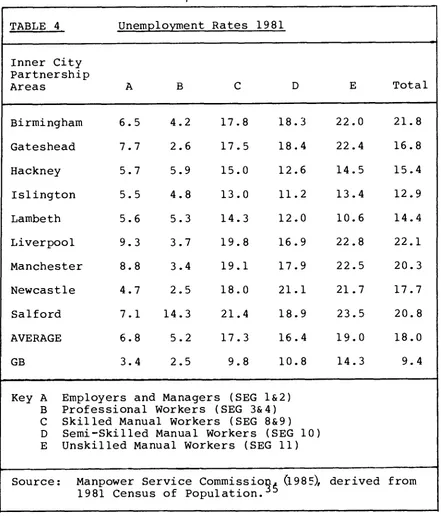
high concentration of unskilled manual workers and semi-skilled workers in priority areas with much smaller numbers of people from the higher social class groups led to the demand for skilled workers to be met from elsewhere leaving large numbers of the unskilled group out of work with little hope of finding any (see Appendix One). This mismatch in the available labour and urban employment demands resulted in higher than average unemployment amongst the unskilled groups from inner areas, as Table 4 demonstrates.
TABLE 4 Unemployment Rates 1981
Inner City Partnership
Areas A B C D E Total
Birmingham 6.5 4.2 17.8 18.3 22.0 21.8 Gateshead 7.7 2.6 17.5 18.4 22.4 16.8 Hackney 5.7 5.9 15.0 12.6 14.5 15.4 Islington 5.5 4.8 13.0 11.2 13.4 12.9 Lambeth 5.6 5.3 14.3 12.0 10.6 14.4 Liverpool 9.3 3.7 19.8 16.9 22.8 22.1 Manchester 8.8 3.4 19.1 17.9 22.5 20.3 Newcastle 4.7 2.5 18.0 21.1 21.7 17.7 Salford 7.1 14.3 21.4 18.9 23.5 20.8 AVERAGE 6.8 5.2 17.3 16.4 19.0 18.0
GB 3.4 2.5 9.8 10.8 14.3 9.4
Key A Employers and Managers (SEG 1&2) B Professional Workers (SEG 3&4) C Skilled Manual Workers (SEG 8&9) D Semi-Skilled Manual Workers (SEG 10) E Unskilled Manual Workers (SEG 11)
Source: Manpower Service Commissioq4 4980, derived from 1981 Census of Population.
averaged an unemployment rate of 29.7 per cent against the national average for that age range of 17.8 per cent and 60- 64 year olds who also suffered with an unemployment rate of 16.6 per cent against a national average of 12.0 per cent.37 In the peripheral estates on the edge of the large cities too, recent experience has been of economic deterioration on a similar scale to the inner areas with unemployment levels sometimes as high as three times the national average.38 These areas remain isolated as the economic decline and lack of employment opportunities is heightened by poor transport links thus reducing access to employment opportunities elsewhere.
For both the inner areas and peripheral estates that make up priority areas the position remains that in general they experience higher than the national or regional average unemployment rates with disproportionate concentrations of unskilled manual workers. Moreover, because residents living in priority areas suffer an unequal share in terms of access to economic opportunity they hold a weak position in the job market which subsequently affects their ability to compete in other markets. Stewart has suggested that there exists a connection between the relative positions held in the job and housing markets so that
The lack of affordable good quality housing and the existence of older decaying property particularly in the inner priority areas presents serious accommodation difficulties for those on low incomes as the discussion in the the next section shows.
1.3 Housing conditions
A great deal of the property in inner city areas is characterised by concentrations of terraced housing and in some places, larger housing now used for multi-occupation, mostly privately rented, generally decayed and poorly maintained."
The disproportionate accumulation of poor quality housing in the inner areas of the large cities is a visible reminder of 19th century industrialisation when vast increases of population had to be contained in towns and cities lacking the social and physical infrastructure to cope with the new demands of industrial and urban growth.41 The subsequent unchecked, substandard and cheaply constructed accommodation remains today to dominate the inner areas. While just over a quarter of housing in England was built before 1919 the proportion contained in the inner areas of large cities varies from between 40 - 60 per cent.42
environments with many owners tending to be older and poorer and unable to afford the cost of improvements to their property. The Inner Area Studies for instance noted that it was the combination of the inability of residents to fund their share of improvement costs and the refusal by absentee landlords to finance the upkeep of rented property which contributed significantly in delaying progress with improvements. 43
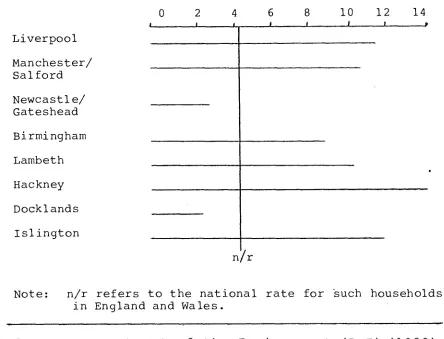
Figure 2 Lacking exclusive use of basic amenities % Households lacking exclusive use of basic amenities
0 2 4 6 8 10 12 14 Liverpool
Manchester/ Salford Newcastle/ Gateshead Birmingham Lambeth Hackney Docklands Islington
nir
Note: n/r refers to the national rate for such households in England and Wales.
Source: Department of the Environment (DoE),(19,83), derived from the 1981 Census of Population4'
Therefore, as many of the more affluent have over time moved out to the suburbs to become owner occupiers those that are left experience two problems, namely, that much housing in deprived areas "is in poor condition, and the choice is often very limited".47 Paradoxically as the better able move out to inhabit relatively cheaper amounts of land the poor are left to contend with finding space amongst scarce and expensive inner city land. The paradox is partly resolved by the poorer residents adapting to higher rents by living at higher densities and hence taking up less land.
As the movement to rehouse residents from the inner cities gathered pace during the post war period, the number of overspill estates close to the periphery of the large cities increased and initially appeared to resolve many of the problems inherent in the older properties. However, the housing that was built needed to be constructed to avoid encroaching on the green belt. The emphasis therefore centred on retaining the densities of previous housing resulting in the erection of tower blocks or medium rise deck access blocks set in an environment short of parks and open play spaces.48
facilities.49 The consequence of these conditions in both inner and outer priority areas is for groups of people to be largely excluded from having access to good quality housing. Hall has suggested that they, due to "lack of money, lack of credit-worthiness, lack of information, lack of opportunity, lack of political power and influence"50 have been unable to gain access to the suburban owner occupier market or the public sector housing system and have subsequently become forgotten people in the housing system.
Thus the argument so far in this chapter has suggested that a significant effect of the movement in population away from the older, inner parts of large cities has been to leave behind disproportionate and socially disadvantaged groups of people who experience deteriorating economic and physical conditions. In the next section a recent extensive survey by Begg and Eversley51 will be drawn upon to demonstrate that not only is there evidence of a connection between population loss and disadvantage but that such priority area conditions are no longer exclusively appearing in the inner areas but spreading to other parts of the conurbations to create a gradient of disadvantage.
1.4 A gradient of urban disadvantage
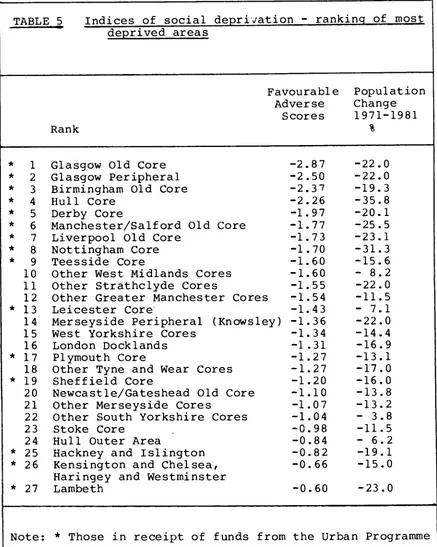
TABLE 5 Indices of social deprivation - ranking of most deprived areas
Favourable Population Adverse Change
Scores 1971-1981
Rank %
* * * * * * * * * * * * * * *
1 Glasgow Old Core -2.87 -22.0 2 Glasgow Peripheral -2.50 -22.0 3 Birmingham Old Core -2.37 -19.3
4 Hull Core -2.26 -35.8
5 Derby Core -1.97 -20.1
6 Manchester/Salford Old Core -1.77 -25.5 7 Liverpool Old Core -1.73 -23.1 8 Nottingham Core -1.70 -31.3
9 Teesside Core -1.60 -15.6
10 Other West Midlands Cores -1.60 - 8.2 11 Other Strathclyde Cores -1.55 -22.0 12 Other Greater Manchester Cores -1.54 -11.5 13 Leicester Core -1.43 - 7.1 14 Merseyside Peripheral (Knowsley) -1.36 -22.0 15 West. Yorkshire Cores -1.34 -14.4 16 London Docklands -1.31 -16.9 17 Plymouth Core -1.27 -13.1 18 Other Tyne and Wear Cores -1.27 -17.0 19 Sheffield Core -1.20 -16.0 20 Newcastle/Gateshead Old Core -1.10 -13.8 21 Other Merseyside Cores -1.07 -13.2 22 Other South Yorkshire Cores -1.04 - 3.8
23 Stoke Core -0.98 -11.5
24 Hull Outer Area -0.84 - 6.2 25 Hackney and Islington -0.82 -19.1 26 Kensington and Chelsea, -0.66 -15.0
Haringey and Westminster
27 Lambeth -0.60 -23.0
By using over seventy indicators grouped to correspond to identifiable policy areas53, the authors of the survey were able to compare urban areas across a broad range using a method of scoring across favourable and adverse factors.54 In considering the findings it is noticeable that Glasgow, the six English metropolitan county cores and the four inner London areas included in the most deprived areas are also included in the top eighteen rates of population loss illustrated earlier in Table 2, with Hull as the outstanding case amongst the free standing towns and cities, though not exactly in the same order. The connection therefore between population loss and deprivation is strongly evident from this study, reinforcing the belief that out migration has been highly selective and that the greater the rate of loss, the more disadvantaged becomes the social composition of the remaining population.55
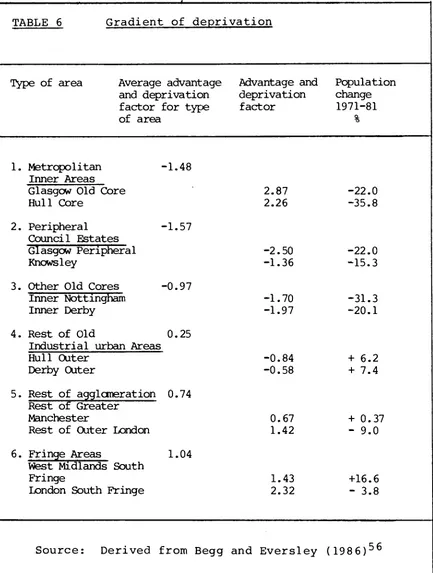
TABLE 6 Gradient of deprivation
Type of area Average advantage Advantage and Population and deprivation deprivation change factor for type factor 1971-81 of area
1. Metropolitan Inner Areas
-1.48
2.87 2.26
-22.0 -35.8 Glasgow Old Core
Hull Core
2. Peripheral -1.57 Council Estates
Glasgow Peripheral -2.50 -22.0
Knowsley -1.36 -15.3
3. Other Old Cores -0.97
Inner Nottingham -1.70 -31.3
Inner Derby -1.97 -20.1
4. Rest of Old 0.25 Industrial urban Areas
Hull Outer -0.84 + 6.2
Derby Outer -0.58 + 7.4
5. Rest of agglomeration 0.74 Rest of Greater
Manchester 0.67 + 0.37
Rest of Outer London 1.42 - 9.0 6. Fringe Areas 1.04
West Midlands South
Fringe 1.43 +16.6
London South Fringe 2.32 - 3.8
What can be seen is that nearly all outer areas are better off than inner areas, mostly by a significant margin. Hence, for instance, the inner area of Hull registers one of the worst overall scores in the country at -2.26, an outcome equally composed of high adverse indicators, an absence of favourable indicators together with the highest percentage population loss at 35.8 per cent over the 1971-81 period. The outer area of Hull by comparison scores -0.84 on the favourable-adverse factors and has a percentage population gain of +6.2 between 1971-81. The higher adverse score for outer Hull is explained by the fact the area includes pockets of severe disadvantage including the North Hull and Orchard Park Estates, the subject of the case study discussed later in Chapter Four.
Thus, what has emerged from the survey by Begg and Eversley is a demonstrable linkage between the decline in parts of the urban conurbations with the outward movement of population, encouraged by push and pull factors associated with planning policies of the post war period and more recently, the disadvantages in priority areas being exacerbated by the effects of wider structural changes affecting national economies . 5 8 Furthermore, the traditional assumption that severe disadvantage is only to be found in the older declining inner areas of the larger towns and cities now no longer adequately reflects the situation. Other inner and outer parts of the conurbations are exhibiting similar combinations of adverse conditions in a gradient outwards that include more recently developed post war peripheral estates.
declining parts may be found in the outer parts of towns and cities as well as near the centre. It is in these areas therefore that the priority areas of urban Britain can be found where there exists a low economic and skills base as well as high levels of unemployment. These lead to many people experiencing poverty with lower than average household incomes. Residents furthermore, live in unpopular and declining housing conditions amidst widespread physical decay, and the educational record is poor with low levels of achievement and progression. The 1977 White Paper "Policy for the Inner Cities"" in noting this situation commented on the
shabby environment, lack of amenities, the high density remaining in some parts and the poor condition of the older housing stock in the inner areas contrast sharply with better conditions elsewhere. They combine together to make these areas unattractive, both to many of the people who live there t9 new investment in business, industry and housing.'
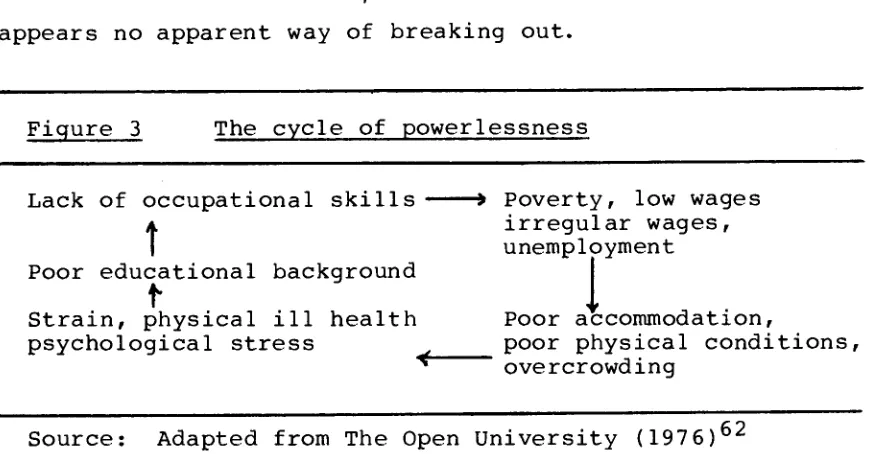
The situation thus, is worsened by the cumulative effects of the material disadvantages which produces deprivation in the form of a lack of access, limited participation and a denial of opportunity in the social and economic mechanisms of society. This in turn results in a dislocation of priority area life and is the concern of the next section.
of powerlessness, illustrated in Figure 3, from which there appears no apparent way of breaking out.
Figure 3 The cycle of powerlessness
Lack of occupational skills --0 Poverty, low wages irregular wages, unemployment Poor educational background
Strain, physical ill health Poor accommodation,
psychological stress poor physical conditions, ÷--- overcrowding
Source: Adapted from The Open University (1976)62
Thus in areas in severe decline it is the cumulative effects of disadvantage and poverty which is the fundamental problem. If "earned income is low and government support limited"63 the lack of purchasing power which follows brings with it a loss of dignity and self esteem arising from the absence of a regular income. As a consequence, people experiencing poverty become socially isolated and excluded from participating in the mainstream of society.
This combination of disadvantages therefore contributes to a collective deprivation in priority areas which affects all the residents, even thou9n individually many people in such areas are content with their homes and and satisfactorily employed. The 1977 White Paper believed that the cumulative effects of disadvantage gives rise to
exposure to crime and vandalism... This collective deprivation amounts to more than the sum of all the individul disadvantages with which people have to contend."
Furthermore, the concentration of the worst housing, the highest unemployment and he greatest density of poor people in priority areas has served to fragment, unhinge and dislocate those who live there. Cohen65 has associated this position with the breakdown of traditional neighbourhood and extended family arrangements which he believed was typified by the disappearance of the focal points of the traditional community in the shape of the corner shop, the pub and the street as a major area of "communal space".66 This movement away from traditional neighbourhood in urban priority areas has been described by Wilmott67 and can largely be traced back to the influence of the post war programmes of clearance and redevelopment in Britain's towns and cities which not only broke up existing local networks but also redeveloped the old districts in new physical forms making it difficult for people to get to know their new neighbours.
... has sometimes been one of continuing disruptioi of local life and a loss of local community.
These factors have been used to help explain the dramatic changes in social relationships and subsequent breakdown of traditional community. While contemporary writers like Harrison70 and White71 largely confirm that older, inner areas of large cities are more often characterised by social isolation and conflict than by any sense of community, while other evidence has suggested that under certain circumstances there can exist local social networks and a sense of community. For example, the Inner Area Studies72 noted how a concentration of fellow residents with the same ethnic background in a neighbourhood contributed towards strong local associational ties and extensive networks amongst people. The Birmingham and Lambeth studies particularly, reported that those who felt most attached to the places were the ethnic minorities, Asians in Birmingham73 and West Indians in Lambeth.74
conditions of material disadvantage and the consequent personal deprivation encountered by residents in priority areas.
In overall terms though, the material disadvantages affecting urban priority areas have served to deprive those who live in such places of the benefits enjoyed by the rest of society and, as the study of eighty five urban areas has demonstrated, contribute to socially polarise whole areas of the conurbations. The findings furthermore confirm the geographical bias to polarisation: all the areas surveyed, excepting inner London and Plymouth, were in the north and midlands of Britain where the legacy of 19th century industrial and urban growth still persists.
Furthermore, the prognosis is not good either for priority areas: Urban Programme funding and other assistance directed at disadvantaged urban areas has been around since the late 1960s75 yet the evidence in this chapter shows that far from a diminution in the problem there has been a growth in the extent of areas in decline. New research evidence from the Policy Studies Institute too, suggests that the gap between deprived areas and the rest of the country in housing, unemployment, education and other conditions of life remains as wide as 15 years ago, when the
White Paper was launched.76
2. EDUCATION AND DISADVANTAGE
The available evidence suggests that the educational performance of children from priority areas over the post war period has been poor with low levels of achievement and progression being persistently recorded amongst the least socially advantaged groups concentrated in inner areas. This part of the chapter examines in the first section the evidence supporting this assertion while in the second section, the discussion focuses on the educational responses that were directed towards improving educational achievement. In particular, the emergence of early notions of community education as one solution to the educational difficulties being experienced in priority areas is considered.
2.1 Educational under-achievement
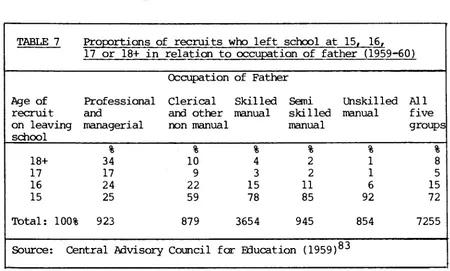
had "poor" reading scores compared to 9 per cent of those from Social Class I78 while over 40 per cent from Social Class V compared to 12 per cent from Social Class I recorded poor' arithmetic scores.79 Furthermore, when looking at the incidence of social disadvantage among these children, they considered the three factors of family composition (five or more children or only one parent), low income and poor housing to be crucial to disadvantage." Both the Crowther 81 and Newsom Reports82 too reached similar conclusions concerning the attainment levels of children from lower social class backgrounds while statistics from as early as 1959-60 showed that greater proportions of children from low income groups were leaving schooling at the earliest opportunity, as Table 7 indicates.
TABLE 7 Proportions of recruits who left school at 15, 16, 17 or 18+ in relation to occupation of father (1959-60)
Occupation of Father
Age of Professional Clerical Skilled Semi Unskilled All recruit and and other manual skilled manual five on leaving
school
managerial non manual manual groups
% % % % % %
18+ 34 10 4 2 1 8
17 17 9 3 2 1 5
16 24 22 15 11 6 15
15 25 59 78 85 92 72
Total: 100% 923 879 3654 945 854 7255 Source: Central Advisory Council for Education (1959)83
TABLE 8 Percentage of 18 year olds entering University Father's
by social class 1961 and 1968
1968 (entrants)
Social Class 1961
(undergraduates)
1 Professional, managerial 19 19
11 Intermediate 42 32
lila Clerical 12 18
111b Skilled manual 20 19
IV Semi-skilled manual 6 10
V Unskilled 1 2
TOTAL 100 100
Source: UCCA Reports for 1967/6884
A decade later the situation had hardly improved for lower social class groups as Table 9 illustrates. This led Halsey and his colleagues to point out that while class chances of access to university remained more or less constant over the period the absolute gains from the middle class were massive compared with those from the manual classes.85
TABLE 9 Home candidates and accestance b social class Accepted Candidates Father's Social Class 1977 1978 1979
1 Professional, managerial 20.9 21.7 21.9
11 Intermediate 41.2 41.5 42.3
lila Clerical 14.8 14.4 13.4
111b Skilled manual 16.6 16.1 16.3 IV Semi-skilled manual 5.2 5.2 5.0
V Unskilled 1.2 1.2 1.0
TOTAL 100 100 100
On the basis of this and other evidence, Westergard and Resler suggested that manual workers' children were less likely to enter university than children from professional backgrounds by a factor of nearly nine times.87 The statistics further supported the claim by Douglas that the social class background of parents was influential in the post school destinations of children.88 Others like Floud89 claimed that the gap between the educational opportunities and achievements of children from low income and manual backgrounds and that of middle class children widened as they grew older.
t
TABLE 10 EPA Mean EPVT and SRA Scores .
White
British Caribbean Asian
(n) (n) (n)
1. EPVT Level 1: Ages 5-6 years
London 97.9 (957) 86.9 (298) - - Birmingham 89.5 (342) 81.6 (96) 69.6 2. EPVT Level 2:
Ages 7-10 years
London 92.9 (1162) 84.5 (250) - - Birmingham 86.4 (785) 81.6 (209) 72.7 (373) 3. SRA:
Ages 8-10 years
London 93.0 (878) 88.1 (161) - - Birmingham 86.4 (360) 83.5 (107) 78.4 (173)
Source: Payne (1974)91
Thus, in terms of, the educational performance of children in priority areas, the overall situation was one of limited achievement which produced yet another disadvantage that served to further deprive the least advantaged groups in society. In addition therefore to economic decline, poor quality housing and a run down residential environment with relatively high concentrations of socially vulnerable groups over reliant on welfare benefit and social services, was the problem of children who performed badly within the educational system. How such educational failure in priority areas was tackled will be the concern of the next section in this part of the chapter.
2.2 Educational responses in priority areas
As far back as 1959, the Crowther Report picked out the "special and depressing characteristics"95 of the "...inner, declining rings of impoverished districts near the centre of the great cities"96 as being in need of urgent attention from education.
required for economic expansion the response was crucially articulated as a concern with working class failure in education and subsequent waste in the available pool of labour.99
Part of the answer was to change the structure of education and to provide more of it in an attempt to widen opportunities. Thus educational spending during the 1960s grew faster than any major national enterprise apart from gas and electronics. Whereas education spending as a proportion of the gross national product was 3.2 per cent in 1955, by 1969 it had grown to 6 per cent.100
neighbourhood differences. The emphasis in the early manifestation of equality of opportunity thus was not concerned with the social processes within and outside schools which generated or reinforced inequality but with education as a means to personal social mobility through the improvement of access to education. In this universalistic approach to equality of educational opportunity it was perceived that the problem with education lay not so much in what it was or what it did, but how it was distributed.
Yet despite the movement towards greater equality of opportunity afforded by the removal of educational barriers and improvements in access, the school performance of children from lower social class backgrounds remained disappointing, with confirmation that there existed a spatial polarisation in respect to educational achievements.103 Evidence was emerging that suggested children from families living in the suburbs of large cities took both advantage of educational provision and benefited from it while families living in the inner area of cities were neither benefiting from opportunities offered in the education system nor achieving within it.104
that where there was a better 'cultural fit'107 between home and school in terms of values and behavioural norms for example, the likelihood of success in school was made more possible. As Douglas pointed out:
When housing conditions are unsatisfactory, children make relatively low scores in the tests. This is so in each social class but whereas the middle class children, as they got older, reduce this handicap, the manual working class children from unsatisfactory homes fall even further behind; for them, overcrowding and other deficiencies at home have a progres4n digressing influence in their test performance.
The suggestion that educational problems could be related to the inadequacies of the home background and upbringing of children coincided with the debate promoted by Sir Keith Joseph's concern over why deprivation and problems of maladjustment persisted despite long periods of full employment and relative prosperity.112 The ensuing notion of a cycle of deprivation that was developed to explain the problem proposed the existence of a "cyclical process of transmission of deprivation and social maladjustment from one generation to another"113 which was basically internal to the family. Thus the family was thrust into a position of crucial importance in affecting educational and social disadvantage. Wisemann argued that home variables had "pro rata, twice the weight of 'neighbourhood' and 'school' variables put together"114 and suggested ,_hat school absenteeism was linked to an unsatisfactory home life and uninterested parents.115
CSE compared with 22 per'cent nationally117 Similarly, the Liverpool Study showed that while inner Liverpool contained 7 per cent of the secondary school population it only had 5 per cent of those in the city taking CSE exams while over 50 per cent of school leavers in the inner area had not taken CSE or 0 level exams at all.118
Against a growing belief that people from lower social class groups were bearers of educationally disadvantageous behaviour with an internal pathology at work which affected the educational performance of children, calls were made for greater intervention and closer links between schools, the family and the neighbourhood through a strategy of positive discrimination and programmes of compensatory education to meet the needs of "deprived children of limited family and social backgrounds".119 The suggestion progressed further, with claims that in improving the education of children from the poorest neighbourhoods the school would need to "transcend its environment and create within itself a community of good living" 120
of social groups found in priority areas their underachievement became linked to a lack of motivation, language deficiency, economic background, literacy levels of parents and cultural traditions.124
Interspersed with the concern to compensate for cultural deficiencies was the emergence of an idea for the urban school to become "a social centre for its neighbourhood"125 built on a different design and scale as part of a community focus seeking to alter the cultural attitudes of the neighbourhood. The proposal in the 1967 Plowden Report for closer home and school links to influence the family's whole cultural outlook through "a programme for contact with children's homes"126 represented the introduction of community education as one approach for solving the problems of educational underachievement in urban priority areas.
The recommendation in the Plowden Report for the school to become a focus for community activities127 and stimulate closer links with the home, however, was also part of a broader concern for improving working class cultural behaviour as well as improving educational performance. As Vaizey put it
Thus, the early manifestation of community education focused on the compensating role of schooling in attempting to improve the cultural and educational performance of children from lower social class groups through a strategy that linked urban communities and schools more closely. By attempting to influence the attitude of the home the early supporters of community education believed that children would display a more positive approach to learning and subsequently improve their performance. Improving education in this perspective was not directly linked to improving the major socio economic disadvantages discussed in this chapter; the emphasis was more on remediated cultural and social behaviour in respect to schooling.
Subsequent developments in community education broadly continued this interventionist approach amongst urban priority communities, although a different view emerged which stressed the function of education to regenerate local community life as a prerequisite to wholesale alteration of the social and economic circumstances in such areas. Hence, the purpose in the later strategies of community schooling and community development would be to educate people to be able to tackle and potentially change their disadvantageous social and economic conditions.
APPENDIX ONE
TABLE 11 Broad occupational distribution of employment 1981 (Numbers in each group as % of total employment
Inner City Partnership
Area A B C D E
Birmingham 6.4 2.4 23.0 22.0 9.6 Gateshead 6.4 1.7 27.6 16.0 10.4
Hackney 8.3 2.4 17.7 15.7 8.0
Islington 9.1 4.3 15.2 13.1 8.4
Lambeth 8.8 3.5 14.4 11.4 10.7
Liverpool 5.9 1.8 20.8 18.4 12.1 Manchester 6.3 2.1 22.1 18.1 11.1 Newcastle 7.9 3.3 22.4 12.4 11.0
Salford 5.2 1.2 23.6 20.5 13.6
GB 12.3 4.1 19.8 12.1 5.6
Key: A Employers and Managers (SEG 1&2) B Professional Workers (SEG 3&4) C Skilled Manual Workers (SEG 8&9) D Semi-Skilled Manual Workers (SEG 10) E Unskilled Manual Workers (SEG 11)
APPENDIX TWO TABLE 12 Disadvantaged households
% 0
Pensioners Living Alone
living alone 12 14 16 18 Households with pensioners
2 4 6 8 10 Liverpool
Manchester/ Salford Newcastle/ Gateshead Birmingham Lambeth Hackney Docklands Islington
n/ r
Single Parent Households % Single parent households
0 2 4 6 8 10 12 14
I j
Liverpool Manchester/ Salford
Newcastle/ Gateshead Birmingham Lambeth Hackney Docklands Islington
nir
Note: n/r refers to the national rate for England and Wales
Notes to Chapter One
SO
1. For a detailed analysis of the condition of priority areas see Hall, P. (1981) The Inner City in Context
which brought together the findings of the Social Science Research Council Working Party on inner cities in Britain. In addition to the work of Hall, source material for this chapter has largely been drawn from the 1981 Census statistics which in lieu of the 1991 Census findings, provides the most relevant and reliable available data on urban areas. However, whenever more recent information has been made available, for instance, Population Trends or the Economic and Social Research Council, this has also been used.
2. Harrison, 1983, p.21. 3. ibid.
4. Townsend, 1979, p.88.
5. See Reid, (1977), Social Class Differences in Britain for a fuller discussion of socio-economic classifications.
6. ibid.
7. The survey carried out by Halsey, A.H., Heath, A.F. and Ridge, J.M. (1980) Origins and Destinations is particularly informative on this point.
8. The major government reports and enquiries of the period were concerned with the inadequacies of the existing system to produce the types of labour power required for economic expansion. The Crowther Report (1959) 15-18 and the Newsom Report (1963) Half our Future both stressed the importance of schooling to prepare pupils for future employment.
9. See the Crowther Report, 1959, paras. 614-618 for a discussion on comprehensive schooling.
10. Central Advisory Council for Education (CACE), 1967. 11. ibid, paras. 102-130.
12. Harrison, op.cit., p.21. 13. Hall et al, 1973, p.128. 14. ibid.
15. Denham, 1984, pp.10-18.
17. ibid. 18. ibid.
19. ACUPA (Archbishop's Commission on Urban Priority Areas), 1985, p.7.
20. ibid.
21. Population Trends, Winter 1991, p.4. 22. Begg and Eversley, 1986, p.71.
23. Hall, 1981, op.cit., pp.22-24.
24. ibid. This pull factor is associated with the perceived attractiveness of suburban living which included not just better housing and environmental features but improved education and social opportunities.
25. DoE, 1983.
26. Hall, 1981, p.cit., pp.19-21.
27. See for example Field, S. et al (1981) Ethnic Minorities in Britain for evidence of discrimination in employment and Brown, C. (1984) Black and White Britain which deals with the housing disadvantages faced by ethnic minorities. 28. Townsend, op.cit.
29. Webber, 1975. 30. Holtermann, 1975.
31. See Townsend, op.cit., pp.553-60 for instance. 32. Hausner and Robson, 1986.
33. Davies, 1978, pp.5-7.
34. Hausner and Robson, op.cit., p.9.
35. Manpower Services Commission (MSC), 1985, p.198. 36. Hausner and Robson, op.cit.
37. ACUPA, op.cit., p.201. 38. ACUPA, op.cit., p.14. 39. Stewart, 1973, p.212.
41. Allnutt and Gelardi,•1979, p.41. 42. ibid, p.42.
43. DoE, 1977a. 44. Bor, op.cit. 45. DoE, 1983.
46. See the study by Rex, J. and Moore, R. (1967) Race Community and Conflict : A Study of Sparkbrook for an expansion of this point.
47. Bor, op.cit., p.156. 48. ACUPA, op.cit., p.176. 49. ibid.
50. Hall et al, op.cit., p.628. 51. Begg and Eversley, op.cit. 52. ibid.
53. ibid. These included ten housing or household indicators, seven employment indicators, four ethnic indicators, nine demographic indicators, seven economic activity indicators, eight indicators related to social class, four family indicators and five other indicators.
54. ibid. 55. ibid. 56. ibid.
57. The official use of single indicators in urban programmes related to a few measurable phenomena were regarded by Begg and Eversley as unsatisfactory in measuring present needs or future trends.
58. The downturn in the national economy which has led to recession has consequently produced further contraction in employment opportunities and a squeeze on public sector expenditure and support for low income groups.
59. ACUPA, op.cit., pp.176-177. 60. DoE, 1977b.
62. The Open University,'1976, p.7. 63. Bor, 1973, pp.156-63.
64. DoE, 1977b, p.4. 65. Cohen, 1977. 66. ibid.
67. Willmott, 1986. 68. ibid, p.92.
69. DoE, 1977b, p.17. 70. Harrison, op.cit. 71. White, 1979.
72. DoE, 1977a, op.cit. 73. DoE, 1977d.
74. DoE, 1977a, op.cit.
75. Urban programme funding had been launched in 1968 by the then Labour Government in response to growing concern at the disadvantages experienced by ethnic minority groups in the inner cities. The following decade saw a variety of initiatives directed at urban areas culminating in the 1977 White Paper "Policy for the Inner Cities" which was the first comprehensive Government statement on urban policy. 76. New research edited by Willmott and Hutchison, (1992) Urban Trends 1, has examined these issues and suggested that little progress has been made to improve the material conditions of disadvantaged groups.
77. Davie et al, 1972. 78. ibid, p.104.
79. ibid, p.103. 80. ibid, pp.27-47.
81. Central Advisory Council for Education (CACE), 1959. 82. CACE, 1963.
84. UCCA, quoted in Mortimore, J. and Blackstone, T. (1982) Disadvantage and Education, p.20.
85. Halsey et al, op.cit., p.217. 86. UCCA, 1980.
87. Westergard and Resler, 1975. 88. Douglas, 1964, pp.39-51. 89. Floud et al, 1956.
90. See Payne, 1974.
91. ibid, Figure A (1-6). 92. CACE, 1963, pp.17-26. 93. CACE, 1967, par. 132. 94. NUT, 1962.
95. CACE, 1959, par. 59. 96. ibid.
97. See CACE, 1959 (The Crowther Report) and CACE, 1963 (The Newsom Report) for further discussion of this
point.
98. ibid. As far as gender was concerned however, the sexes were accepted unquestionably as different with different needs. In the Newsom Report for instance, it was suggested that girls should understand their responsibility as mothers and home managers, CACE, 1963, par. 397.
99. ibid.
100. Whiteside, 1978, p.11. 101. Simon, 1978, pp.112-16.
102. CACE, 1959, op.cit., par. 617. See also DES Circular 10/65, 1965 in which comprehensive schools were
proposed.
103. The evidence emerging from Floud, 1956, and Crowther, 1959, supported the concern over differential achievements in schooling by children from suburban backgrounds and from middle class groups and those living in the older urban areas from predominantly lower social class groups.
105. Douglas, 1964.
106. See Vaizey, J. (1962) Education for Tomorrow, and The Newsom Report (1963), for example.
107. Douglas, op.cit.
108. ibid, p.67.
109. CACE, 1963, par. 50.
110. ibid, pp.17-26.
111. CACE, 1967, par. 184.
112. Joseph, 1972.
113. ibid.
114. CACE, 1967, Vol. 2, p.369.
115. ibid, p.370. Douglas too, regarded the influence of the level of parental interest in schooling to be greater than all other factors, op.cit., p.57.
116. DoE, 1977c and 1977d, op.cit.
117. DoE, 1977d, ibid.
118. DoE, 1977c, ibid.
119. Schools Council, 1970, p.7.
120. CACE, 1947, p.45.
121. See Table 10, p.51.
122. CACE, 1967, par. 190-198.
123. ibid, par. 113-118.
124. See CACE (1967), par. 183-186 for example.
125. CACE, 1947, p.26.
126. CACE, 1967, par. 130.
127. See the section discussing the idea of the community school in the Report, ibid, par. 121-123.
128. Vaizey, 1962, p.19.
129. MSC, op.cit.
CHAPTER TWO
COMMUNITY EDUCATION AND URBAN PRIORITY AREAS
INTRODUCTION
The previous chapter described the post war physical decline in the economic and social fabric of British urban priority areas and suggested that the cumulative effect of subsequent material disadvantage has resulted in a dislocation of relationships and an increasing polarisation between such areas and the main social and economic mechanisms of society. It was demonstrated too, that these conditions are spreading out from the inner cities to affect other parts of the urban conurbations, including some of the outer estates on the periphery of the large towns and cities. Furthermore, the poor educational achievements over the period by children from lower social class backgrounds gave cause for concern, raising the question of what constituted a relevant educational experience for children living in such areas. It was suggested by Edwards that if
...a child's parents are poor and live in an inner city area of decay, the chances are that he will go to a poor school; his education will be deficient and the motivation for advancement througkii examination success will be low or absent.
shifted to the part environmental and cultural factors played in education. In particular, the effect of adverse social conditions and the attitudes of the family towards education were increasingly regarded as significant in affecting school performance. Consequently, the debate shifted to consider cultural factors in children and their homes which it was believed had the effect of reinforcing what were regarded as deficiencies in an educational setting.
What followed were calls for schools to intervene in providing a compensatory environment for children who were seen as culturally deprived, to enable such children to compete on equal terms with others from more favoured backgrounds. This led to a greater intervention by schools in their neighbourhoods through closer links being forged between home and school and the development of schools as community centres. These proposals formed part of the early compensatory education response to under-achievement that influenced the developing notion of community education found in the Plowden Report.2