90
Simulation Validation of Wireless Sensor Network Linear
Resource Reservation Congestion Control Protocol (LRRCCP)
N. N. Chukwu1, B.O. Ogbe2, F.E.Orizu3, F.N. Ugochukwu4, K.C.Okafor5
1.2&3
Department of Research & Development, National Engineering Design Development Institute Nnewi Anambra State, Nigeria
4
Department of Research &Development, Electronics Development Institute Awka Anambra State., Nigeria
5
Department of Electrical/Electronic Engineering, Federal University of Technology Owerri Imo State Nigeria.
Abstract
Event-driven wireless sensor networks can operate under both idle and light load intensity. They however suddenly become active in response to a detected or monitored event. But, the transport of event impulses is likely to lead to varying degrees of congestion in the network depending on the sensing application. During these periods of event impulses, the probability of traffic congestion is very high. As such, congestion occurs when the traffic load being offered exceeds the available capacity of sensor nodes. In most applications, every sensor node will send the event it has sensed to a sink node. This operation makes the sensors closer to the sink, resulting in congestion. Congestion may cause packets loss, lower network throughput and sensor energy waste. In order to study, understand, and exploit the properties of the dynamic behavior of LRRCC discussed in a previous work, this paper used a simulation approach to evaluate the performance of the proposed scheme for WSN. Consequently, a validation comparison was made with OPNET Modeller considering two other related schemes-CODA and ESRT.
Keywords:Event-driven, Traffic, Congestion, Sensors, OPNET Modeller, Energy Resources, Packet
1. Introduction
The Wireless Sensor Network (WSN) is an event driven paradigm that relies on the collective effort of numerous microsensor nodes [1]. This has several advantages over traditional sensing including greater accuracy, larger coverage area and extraction of localized features. In order to realize these potential gains, it is imperative that desired event features are reliably communicated to the sink [1].
Recall from previous reviews in [2],[3],[4],[5] and [6] that congestion leads to both waste of communication and energy resources of the sensor nodes and also hampers the event detection reliability because of packet losses. Since the focus of this study is on a linear topology which other works have failed to address. This work leveraged a different experimentalapproach to investigate on the
validity of LRRCC from the real world. Essentially, congestion can manifest in two main ways, viz:
- Excessive Packet loss in the radio itself. - Overflowing queues on nodes.
Hence, it is mandatory to address the congestion in a linear sensor field to prolong the network lifetime, and to provide the required quality of service (QoS) that WSN applications demand.
As seen from the literature in [2],[3],[4],[5] and [6], several control schemes have been proposed with most of the works not showing resource reservation considerations in controlling congestion. Even rate control methods that appear to be the most effective cannot meet sink’s application fidelity requirements during crisis state. The research gap is the missing global framework that can succeed in congestion alleviation while meeting the sink’s application requirements as well as conserve energy.
ISSN 2348 – 7968
91 Since RRA establishes a reservation for simplex flows,
reservations for traffic can be made from any or both directions. RRA is a hop-by-hop QoS signaling protocol. This means that RRA messages are transmitted from one node to another through all RSVP-aware nodes along the data path in the linear topology. The following steps show the event sequence for RRA resource reservation in a uncast scenario for the LRRCCP scheme viz:
i.The transmitting basic sensor node knows the characteristics of the traffic it generates, such as data rate and the deviation from data rate, buffer and channel effects, etc.
As it transmits data, the sender’s RRA module periodically sends data and Path messages to the sinks (DRN, DDD and NCC) which do the following:
- Describe the traffic generated by the sensor node - Create a state on each intermediate RRA-aware
node along the data path. The Path messages are sent with the destination address of the sinks and its data sent.
ii. Path messages create a path state in each sink that is traversed. Through this path setup mechanism, all devices along the path become aware of their adjacent RRA nodes for data flow to the sources.
iii. When a local sensor node notifies a sink of its data traffic along the path length, the sink host then decides if resources should be reserved of dropped.
iv. Once a decision is made to request network resource reservation, the host application sends a request to the local RRA module to assist in the reservation setup. v. The LRRCCP then carries the request as messages to all
nodes along the reverse data path to the data source. The reservation is made on a hop-by-hop basis, each intermediate node checks for sufficient resources and decides if the request can be granted. If the reservation is successful, the reservation request is forwarded to the previous hop in the data path.
In the previous work [2], the system model for congestion management was presented while noting that the LRRCCP is composed of three main parts: (1) congestion detection, (2) feedback signal sending and local congestion processing, and (3) feedback signal processing in upstream node and the resource reservation module. In this work, the LRRCC model used for the linear topology follows closely with two major algorithms for the congestion management in a proposed linear topology, viz: congestion detection and a feedback signal and Local Congestion Processing algorithms. The RRA at the sinks optimizes the traffic flow in the event of buffer overflows and drain in the channel capacity.
Figure 2.7 shows a typical sensor node considered in this work.
2. System Design
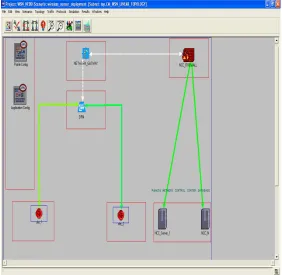
This section starts by introducing the platforms used to evaluate the Wireless congestion management scheme (LRRCCP) and then offers a description of its implementation and provides the results of the proposal. The LRRCC scheme has been implemented in OPNET IT guru 9.1[7] simulation tool using Fig 1. At the top of the platform of simulation software are three types of entities includes: the source entity (sensor nodes or BSN), the sinks (DRN, DDN and NCC). These constitute the whole congestion control system.
In the methodology, the LRRCC schemes comprises of priority signaling in the linear topology, congestion dictation using rate regulator and buffer occupancy, feedback signaling and local congestion processing at the sinks and BSN. The components of the simulated model are described next.
i. Source Entity: The entity source represents a node that has events to report. It realizes the following functions:
Accept subscription: Before sending event reports, the source needs to know who and where the sink node is. It obtains such information by accepting matched interest subscribed by the sink.
Report events: After accepting subscription, the source node will monitor such interesting events and report them to the sink(s).
Regulate sending rate (RR): In the course of reporting events, the sending rate will be controlled according to the condition of network. Adaptive Additive Increase and Multiplicative Decrease (AIMD) is implemented. The source entity communicates the sensed data from the data relay sink to the Network Control Center (NCC). ii. Sink Entity
The sink entity carries out the functions of a sink node (It is also called base station in some networks). Its main routines are listed as follows.
Subscribe events: The sink node subscribes its interested events from the network by calling the interface subscribes. The interest is represented by a set of attributes.
92 Filter Entity
The filter entity in the sink’s process model is associated with each sensor node and implements intermediate nodes' functions related to congestion control. It works with the RRA in the sinks and its tasks include:
Monitor queue: the filter periodically monitors the queue length and averages it in the axis of time. Detect congestion: The filter determines local
congestion if the averaged queue length exceeds a threshold.
Record events: The filter records the event-ID and the last-hop information of any event report which passes an intermediate node.
Handle feedback: Once congestion is detected, intermediate nodes will initiate or forward the feedback packets to the corresponding source entities. At the various rounds, the packet data is verified while various comparisons and checks are carried out before calling the methods for schedule feedback, priority signaling and buffer management.
Fig1: LRRCC System Model [2]
3. Simulation Implementation
3.1. Network Demonstration
This work made its contribution by using discrete Event Simulation (DES) procedure to control execution order of concurrent events for the LRRCC. Based on the prototype stack, this work develops a linear self-powered WSN, with the aim of building a demonstration network for monitoring the environmental and infrastructure parameters. The demonstration network contains one sink (master) node and seventeen SNs. The SNs have been
designed as alert nodes to detect critical events and generic monitoring nodes to measure different parameters such as infrastructure components temperature, ambient temperature, and humidity. The SNs in the network have been deployed with a gap varying from 50m to 100m that can cover approximately 1.2 km of infrastructure as shown in Fig 3. Each node can communicate with the upstream nodes. The SNs have been programmed to respond to event traffic. To reduce the amount of information transmitted over the air, these sets of commands have been encoded. If a user or the master node transmits in the upstream data flow to different nodes using unicast addresses or multicast addresses, these sensors will put their raw measurements in the downstream data flow.
Since the WSN works on top of IEEE 802.15.4 packets (125 bytes), the master node can only read the measurements from the entire network in two communication cycles. In this case , one cycle was used to collect data from the first line devices to the last line devices and the alert sensors. This pattern is normally used to perform near real time measurements using a communication period of 5s. In this way the self-power SNs can stay in sleep mode between cycles of communication to reduce the power consumption. The discrete event subsystem block execute only at event times (whenever event is detected at an input port).
In the next section, a detailed discussion on the simulation procedure will be outlined. The Fig 1 was translated into a two subnet deployment in OPNET 9.1, IT guru while the LRRCC events are simulated with a TCP traffic as described next.
3.2. Simulation Procedure Modelling Attributes
Each node with TCP as one of its contained protocols provides an attribute, called “TCP Parameters”, used to specify TCP configuration parameters. The preset values available for this attribute was used in configuring explicit traffic. For traffic transmission, the Transmission Control Protocol (TCP) is a widely used connection-oriented transport layer protocol that provides reliable packet delivery over an unreliable network. The LRRCC procedure used the TCP key features shipped as part of the standard OPNET model library. TCP model suite captures the following protocol behavior viz: Reliability where acknowledgments and retransmissions triggered by adaptively calculated retransmission timers
Flow control where dynamic windowing of
ISSN 2348 – 7968
93 Re-sequencing where reordering of out-of-order segment arrivals
is achieved.
3.3. Creating Explicit Traffic
To configure the RSVP explicit traffic, this was achieved by editing the application attributes on the wireless sensor nodes potential source. The user profile was set while configuring the rates/characteristics of the application. Fig 2shows the explicit application configuration used in the simulation. Besides, another approach used to generate explicit traffic in the network context is by capturing an application packet trace using the ACE (Application Characterization Environment) product and replaying the trace in the model.
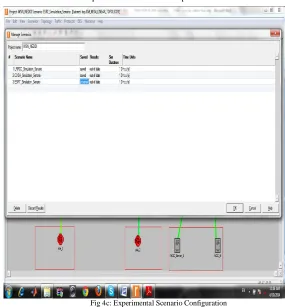
3.4. Scenario Configurations
Fig. 3 showed the LRRCC scheme simulation environment for the two site subnets, each subnet site has 20 nodes initially communicating with a DRN, DDN and the remote NCC for status updates. After the first initial run with 20nodes, the simulation parameters are set as follows:
This work used three scenarios for 100, 50 and 30 sensor nodes (including source nodes and sink nodes) in a linearly distributed pattern in a square region of 100m×100m for site_1 and site_2. The nodes communication radius is
30m. The routing protocol used is Resource Reservation Protocol of the RRA as discussed previously while using the flowchart in Fig 3.6a for the congestion management procedure. The network bandwidth is 2Mbps. The transmission rate is 2Mbps, 5.5Mbps and 11Mbps. The threshold of buffer occupancy ratio Bmax is set to 0.4. The initial energy of sensor nodes is 0.05J but less than 100pJ/bit/m2. The main energy consumption of nodes for delivering data packets is 10−4J/packet. The total buffer size is 256000 data packets. The size of every packet is 200Kbytes. The offered load is 5 packets/second (pps),the packet received rate (PRR) threshold = 95%, each node sensing range R>=radio range, MAC layer CSMA/CA This study uses three scenarios in Fig. 3 to evaluate the LRRCC for the linear topology performance (NeddiNet). Each scenario has the same pipe area coverage. Scenarios #1, #2, and #3 have the 100nodes, 50nodes and 30nodes while varying the rates, buffer sizes and channel bandwidth of simulated BSN and sinks. To measure node deployment performance, each test scenario was repeated five times for a total of 15 ( ie. 3 scenarios x 5 runs per scenario) test runs. The procedure for each test run involved the following steps. (1) All sensor nodes were deployed at each site (2) In the simulation testbed, the configuration parameters were set. The scenarios (#1, #2, and #3) specifically targets the CODA, ESRT and LRRCC schemes. Their algorithms were captured also in Fig 4a, 4b and 4c.
Fig 2: RSVP Explicit Application Configuration Window
94 Fig 4a: LRRCC Configuration window
After the source and sink deployments, the object statistics was configure before executing the simulation runs for each scenario. Global object statistics for data collection was shown. During data collection, sensor nodes transmitted data packets to the gateway nodes/sinks and the Data sheet is place at d last of the report.
To analyze network performance, there are several statistics that can be collected during simulation execution. The statistics can be collected on a per-TCP connection, per-node or a global basis.
- Connection-based TCP statistics, grouped under the heading “TCP Connection”, are useful for studying low-level TCP performance metrics (for example, the “Congestion Window” maintained at each connection process can be probed). - Node-based (and global) statistics provide grouped information for all TCP processes running in a node (and network) collectively. These are useful to determine the total flow of traffic traversing through the TCP layer or the average TCP layer delayed experienced by segments submitted by the application processes. For all the scenarios, the transmission link connections were established and their respective MAC, application and TCP parameters were carried out in Fig 4a-4c. Fig 5a shows sensor node deployments (100Node scenario), Fig 5b shows the sensor node deployments (50 Node
Fig 4b: LRRCC Configuration window
ISSN 2348 – 7968
95 scenarios) while Fig 5c shows the sensor node
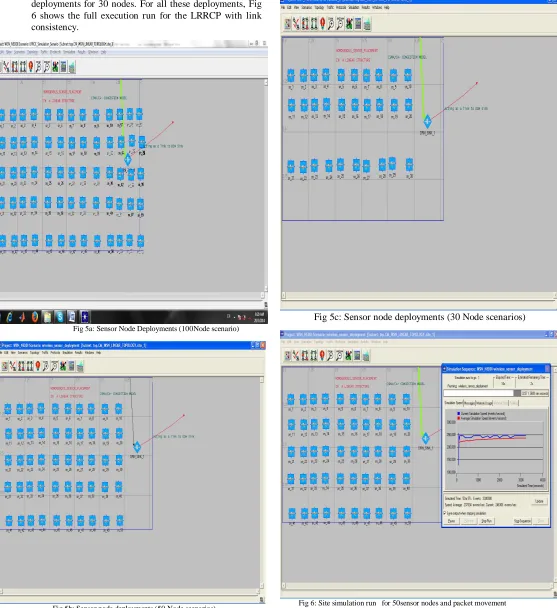
deployments for 30 nodes. For all these deployments, Fig 6 shows the full execution run for the LRRCP with link consistency.
Fig 5a: Sensor Node Deployments (100Node scenario)
Fig 5b: Sensor node deployments (50 Node scenarios)
Fig 5c: Sensor node deployments (30 Node scenarios)
96
4. Performance Evaluations
To assess the performance of the proposed scheme, three congestion control schemes including LRRCC, CODA, and ESRT are simulated as described previously (see Fig.3 and Fig 6). For the LRRCC scenario, the analytical discussions vis-a-vis congestion priority signaling, buffer management, rate regulation, packet flow model, CSMA-CA and the packet filter schemes were taken into considerations. After each simulation run, the simulation statistics for the evaluated parameters below was collected. Consequently, the analysis of the performance of these three mechanisms in terms of packet loss ratio, network throughput, average source transmission rate (i.e. average transmission rate of source nodes), energy efficiency and fairness evaluation was carried out.
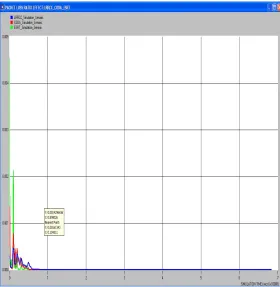
4.1. Packet Loss Ratio
Packet loss occurs when one or more packets of data travelling across the network coverage fails to reach their destination, hence affect the line throughput. Packet loss is distinguished as one of the three main error types encountered in Basic Service Set (BSS) Baseline WLAN model. Fig. 7 depicts packet loss ratio (with respect to time) associated with the three congestion control schemes. Now, the packet error rate (PER) is the number of incorrectly received data packets divided by the total number of received packets. A packet is declared incorrect if at least one bit is erroneous. The expectation value of the PER is denoted packet error probability pp, which for a data packet length of N bits can be expressed as
(1)
Assuming that the bit errors are independent of each other. For small bit error probabilities, this is
approximately Pecan be obtained from the
equation above. Again, Pe redefined for long rang
communication such as:
(2)
Under congestion traffic condition in Fig 7, a spurious Packet loss ratio was observed. This is caused by signal degradation over the network medium due to multi-path fading and in Fig. 4.6, under high traffic condition, the packet drop ratio was evident because of channel congestion, alongside with corrupted packets rejected in-transit. Other possible causes could be faulty networking hardware, faulty network drivers or normal routing routines. As depicted in Fig.7, it was observed that the packet loss ratio with LRRCC is 0.0005 (i.e.,7.81%) lower than that of CODA 0.0014.(i.e., 21.88%) and ESRT
0.0045.(i.e., 70.3%) most of the time. The superiority is especially clear during the beginning stage of system running. LRRCC yields a better response owing to the control scheme rendered by the LRRCC algorithm discussed previously in [2]
4.2. Network Throughput
This is the average rate of successful message delivery over a WSN communication channel measured in bits per second (bit/s or bps), or bytes/secs. It is the sum of the data rates that are delivered to all nodes in a network. Recall a key objective of sensor networks is to maximize the operational lifetime while delivering acceptable data fidelity to the applications. This demands a mechanism to control the network so that the energy tax does not exceed an acceptable value, which is an application-specific choice. This is the rationale for CODA’s closed-loop control. Under overload conditions, assume that the network does not drop ACKs from the sinks, (i.e. ACKs are delivered through high-priority queues), and the majority of packet loss in the network is due to congestion. The objective can be realized through a hybrid rate-based and window-based algorithm. This algorithm governs the window sizes at both source and
sink with the ETax in the following Equ 3
[8]: (3)
ISSN 2348 – 7968
97 Wsrc is the window size or the number of event packets a
source is allowed to send at the current rate r without receiving an ACK from the sink. Wsink is the window size or the number of accumulated event packets a sink receives before it sends an aggregated ACK. r is the source rate during the current observation cycle and ( f + b) is the sum of the forward and backward one-way delays between a source and the sink.
The throughput equation is then given as [8]:
(4)
Where packet size is the Wsrc
Fig. 8a and 8b compares network throughput for these three schemes. The results show that the throughput with LRRCC is relatively satisfactory compare to the other three schemes, especially when the bit error rate becomes smaller. This accounts for a better deployment in a high density sensing environment. Now, in Fig 8a, considering the average network throughput response for Poisson distribution, LRRCC have 69036.7 (i.e., 53.40%), CODA yielded 40030.6. (i.e., 30.96%) while ESRT yielded 20229.4 (i.e., 15.65%). Similarly, in Fig. 8b, considering the average network throughput response for cumulative distribution function, LRRCC yielded 0.9939 (i.e., 33.80%), CODA yielded 0.9832.(i.e.,33.45%) while ESRT yielded 0.9618.(i.e., 32.73%). These results show that the proposed LRRCC is optimally scalable for WSN deployments.
4.3. Source Transmission Rate
The theoretical value to use for the source data transmission rate is the bandwidth delay product which is given by Bottleneck Bandwidth (BB) × Round Trip Time (RTT). Fig 9 shows the average transmission rate of source nodes under different schemes. As observed in Fig 9, LRRCC yielded 322324.2bytes (i.e., 50.53%), CODA yielded 20727.8bytes. (i.e., 32.40%) while ESRT yielded 108868.501bytes. (i.e., 17.07%). The source transmission rate with LRRCC optimally high compared with others as well as maintaining quite a stable level after the transient process. Though the performance of the three schemes is comparable in this regard, ESRT shows a bit more serious fluctuation in the steady state than the others, hence offering a poor source transmission rate.
Fig8a: Average Network Throughput response distribution
98
4.4.
Energy Efficiency
For a simple first order radio model for wireless communications, [9], let Eelectric be the energy dissipated by the transmitter-receiver and Eamplifier be the energy dissipated by the transmit amplifier. Then,
(5a) (5b) Where Eelectric and Eamplifier have values 50nJ/bit and 100pJ/bi/m2 respectively, k is the data rate in bits per packet and d is the distance. The base station is located far away from the test bed and thus communicating with the base station is a high energy operation. The sensors are randomly deployed on a test bed of L × L meters. The number of cluster heads is set to be 6% of the total sensors participating in the layer, which is a reasonable value. An important performance metric was use to evaluate the relative overheads of global and locally unique addressing is efficiency which is defined in [10] to be:
(6)
Where D is number of data bits with an H bit header.
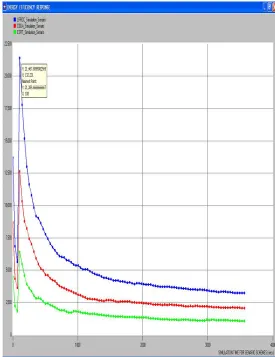
Fig 10 gives the comparisons in terms of energy efficiency, which is calculated as the ratio of the sum of
nodes’ remaining energy to the sum of nodes’ initial energy. It can be seen that LRRCC has relatively satisfactory energy efficiency compared with CODA and ESRT, viz LRRCC showed 54.4% energy efficiency, CODA showed 31.7% energy efficiency while ERST showed 13.94% energy efficiency. This reveals the only weakness of the congestion management scheme. In this regard, LRRCC will function optimally in a non-mission critical scenario.
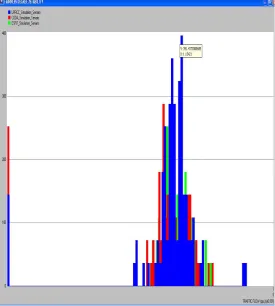
In Fig 11, a comparison on the fairness of the three schemes is shown. In this set of simulations, the fairness degree, denoted Φ, is chosen as the metric, which can be computed as given in [11]:
(7)
Where N is the number of nodes and ri is the average data transmission rate of node i. Obviously the value of Φ will vary with data traffic flow. As can be seen from Fig 11, Fig 9: Average transmission Rate
ISSN 2348 – 7968
99 the fairness under the three schemes witnessed LRRCC
as having the best fairness as the traffic flow increases. As observed in Fig 11, LRRCC yielded 395.90 (i.e., 42.24%), CODA yielded 288.05 (i.e.,30.74%), ESRT yielded 283.24 (i.e.27.02%). In particular, CODA and ESRT performs less in terms of fairness. Although the fairness issue was not been taken into account during the course of LRRCC design, but it still yielded relatively better fairness performance than the other two schemes.
5. Conclusions
In this paper, a LRRCCP proposed for low-power linear WSNs was presented and evaluated. This protocol is evaluated in order to meet the objectives of efficiency, and reliability in WSNs linear deployments where congestion is eminent. First, the work introduced the linear scale infrastructure framework, focusing on the use of self-powered WSNs for monitoring the network architecture. Then, the work briefly presented the LRRCCP as a candidate protocol for linear wireless networks with bidirectional communication. The advantages of this protocol in linear topology such as the possibility to transmit a variety of information, the use of poll/final procedure for control, or the use of unicast and multicast
addresses with extending capability has been discussed. The work also discussed the simulation approach while presenting a three case scenario for evaluation studies. The preliminary results of a Wireless LRRCCP demonstration network with these sensors are very encouraging and also revealing. Using the protocol, a user can interact at any time with different nodes in the network and can collect various types of data from many sensors at one time, which is an important capability for a linear network. Another advantage for low-power WSNs is that the LRRCCP does not increase the size of messages significantly and it does not introduce complex headers or fields to sensors data. Therefore, the Wireless LRRCCP is a low power WSN which can help to evacuate congestion very quickly. The investigation performed in this paper was an attempt to make open standard linear WSNs with an ultimate aim of achieving a standard low-power wide monitoring system, an essential requirement for the next generation of Linear WSNs deployments. A validation comparison was made with OPNET Modeller considering two other related schemes-CODA and ESRT with their results discussed. Future work will dwell on characterization of a field testbed and obtaining real life data for analysis using readily available sensor nodes
6. Acknowledgments
We wish to acknowledge Kswitche Consults for providing the hardware and Software platforms for this research. The authors also wish to express their gratitude to Engr. Okoro O. Valentine from the Electronic Engineering Department of University of Nigeria Nsukka for the valuable resource materials offered in this research Finally, we want to thank the wireless sensor community for their invaluable contributions in this research.
References
[1] Y. Sankarasubramaniam, O. Akan, and I. Akyildiz.Event-to-sink reliable transport in wireless sensor networks. In Proc. of the 4th ACM Symposium on Mobile Ad Hoc Networking & Computing (MobiHoc 2003), pages 177–188. Annapolis, Maryland, June 2003.
[2] Nelson Nnaemeka.C, G.N.Onoh, Ohaneme C.O, A. C. O. Azubogu, K.C Okafor, “Enhancement of Wireless Sensor Network QoS Using Linear Resource Reservation Congestion Control Protocol (LRRCCP)”, [3] Okoro O. V, E. O. Muoegbunam, A. Ekene, K. C. Okafor, A. N. Uzoamaka, The Impact of Traffic Congestion on Wireless Sensor Networks; a Case for Traffic Distribution on TelosB RF Transceiver
100
Device”, In Engineering and Technology, 2015; 2(2): Pp. 35-47,March 30, 2015 .
[4] Jiangwen Wan, Xiaofeng Xu, Renjian Feng and Yinfeng Wu,“ Cross-Layer Active Predictive Congestion Control Protocol for Wireless Sensor Networks, Sensors 2009, 9, 8278-8310; doi:10.3390/s91008278.
[5] Helonde J B Dr. Wadhai V Vivek Deshpande Shiv Sutar, EDCAM: Early Detection Congestion Avoidance Mechanism for Wireless Sensor Network”, International Journal of Computer Applications (0975 – 8887) Volume 7– No.2, September 2010, Pp.11-14. [6] Radosveta Sokullu, Eren Demir, “Mac Layer Protocols
For Linear Wireless Sensor Networks: A Survey”, Recent Advances In Telecommunications, Informatics and Educational Technologies, 2014, Pp 247-256.
[7] OPNET IT Guru: A tool for networking education, REGIS University,Ranjan Kaparti and http://
www.opnet IT guru.com,2014.
[8] Ray S. Carruthers J.B.,Starobinski D. “RTS/CTS-induced congestion in ad hoc wireless LANs”, Volume: 3, On page(s): 1516- 1521 vol.3, 16-20 March 2003.
[9] JaeWon Kang, Yanyong Zhang, Badri Nath, “Adaptive Resource Control Scheme to Alleviate Congestion in Sensor Networks”, In the First Workshop on Broadband Advanced Sensor Networks.
[10]Chieh-Yih Wan, Shane B. Eisenman, Andrew T. Campbell, Jon Crowcroft: “Siphon: overload traffic management using multi-radio virtual sinks in sensor networks”, SenSys 2005: 116-129.