T
HE
G
OVERNMENT
’
S
C
HILD
P
OVERTY
T
ARGET
:
HOW MUCH PROGRESS HAS BEEN MADE?
The government’s child poverty target:
how much progress has been made?
Mike Brewer
Tom Clark
Alissa Goodman
Institute for Fiscal Studies
Copy-edited by Judith Payne
Published by
The Institute for Fiscal Studies 7 Ridgmount Street London WC1E 7AE Tel: +44-20-7291 4800 Fax: +44-20-7323 4780 Email: [email protected]
Internet: www.ifs.org.uk
© The Institute for Fiscal Studies, April 2002
ISBN 1-903274-25-7
Printed by
KKS Printing The Printworks 12–20 Rosina Street
Preface
Financial support from the ESRC-funded Centre for the Microeconomic Analysis of Public Policy at IFS (grant number M535255111) is gratefully acknowledged. Data from the Family Resources Survey and the Households Below Average Income data-sets were made available by the Department for Work and Pensions, which bears no responsibility for the interpretation of the data in this Commentary. The authors wish to thank Andrew Dilnot for useful discussion of the issues and comments on previous drafts. Any errors that remain and all opinions expressed are those of the authors.
Contents
Executive summary
1. Introduction
2. Why a child poverty target?
3. Why this child poverty target?
4. Labour’s tax and benefit policy towards families with children
5. Official numbers on child poverty over Labour’s first term
6. Why do the official numbers not agree with earlier estimates?
6.1 Real income growth
6.2 Families that get no benefits but look as if they should
6.3 Change in employment and earnings amongst low-income families 6.4 Timing issues
6.5 Conclusion: why hasn’t child poverty fallen by 1.2 million?
7. Is the government’s child poverty target inconsistent with its policies?
7.1 Are incomes adjusted for family size in the appropriate way?
7.2 Does the poverty line chosen mean that many of those the government has helped were never in poverty?
7.3 Conclusion: is the target measuring the wrong thing?
8. How much might further progress in reducing child poverty cost?
8.1 Perfect targeting on low income
8.2 Attacking child poverty through the forthcoming child tax credit
9. Conclusion
Appendix A. Number of children below various poverty lines
Appendix B. Reliability of recorded changes in poverty rates
References
1
2
5
7
11
14
18 20 22 25 26 27
29
29 30
31
32 32 34
37
38
39
Executive summary
The government wants to abolish child poverty by 2020, to halve it by 2010 and to reduce it by a quarter by 2004. To help achieve this, the government has redistributed towards poorer families with children. A year ago, the Treasury said that ‘tax and benefit reforms announced in this Parliament [i.e. 1997–2001] will lift over 1.2 million children out of relative poverty’. But official figures released on 11 April show a smaller fall in child poverty: on the same definition as used by the Treasury, it fell by about 0.5 million, from 4.4 million in 1996–97 to 3.9 million in 2000–01.
Can this discrepancy be explained? In fact, the Treasury clarified last year that it never intended to imply that the official child poverty figures would decline by 1.2 million over the Parliament, even though that was the most common interpretation. Three main reasons explain why the new data show a decline of less than 1.2 million:
• The 1.2 million figure abstracted from income growth. But average incomes tend to grow each year, and this affects child poverty because the poverty lines used by the government increase each year with average income growth. Child poverty measured against the 1996–97 poverty line has fallen by 1.3 million since that time. So, poor children’s incomes have been increasing, but insufficiently fast to reduce relative child poverty at the desired rate.
• The 1.2 million figure assumed that families receive all the benefits to which they are entitled. In practice, many entitled families do not claim means-tested benefits, perhaps because they do not know how or do not want to claim. Children in these households have not gained from the main anti-poverty policies.
• The official poverty rates understate the impact of the significant benefit increases in Autumn 2000. Considerably fewer children were in poverty in the last six months of 2000–01 than in the first six months. Focusing on the second half of the year suggests child poverty has fallen by about 150,000 more since 1996–97.
All these factors contribute to the difference between the two figures and have made it harder for the government to reduce child poverty rates rapidly. But employment growth amongst parents has worked in the opposite direction, as the 1.2 million estimate ignored increases in the number of working parents.
1. Introduction
The government has the goal of abolishing child poverty. It has been keen to emphasise that poverty is multi-faceted, with 31 different indicators set out in its annual audit of poverty, Opportunity for All.1 But low incomes have been the primary focus of its
anti-poverty policies: the extra government expenditure on increasing the family incomes of poor children has been especially significant, and the government has set itself significant and explicit targets on reducing child income poverty (see Box 1.1). For these reasons, the numbers of children recorded as being below various income thresholds in the official figures are watched especially closely. This Commentary presents results from the latest set of these figures, showing that the government is progressing towards its target, but that progress is proving slower than had been expected.
Box 1.1. Children in income poverty: what has the government committed to? In the Beveridge speech in March 1999, the Prime Minister announced a radical ambition – to abolish child poverty within a generation. Though no details have yet been given of exactly what abolishing poverty in 20 years would entail, a further raft of policy aims have followed. Soon after the Prime Minister’s speech, the Treasury announced its aim was to halve child poverty within 10 years, and in 2000 an intermediate goal was defined: in a Public Service Agreement (PSA), the Treasury and the Department of Social Security jointly undertook to ‘make substantial progress towards eliminating child poverty by reducing the number of children in poverty by at least a quarter by 2004’.a
In the agreement, poverty was given an explicit definition, and the method by which movement towards this target would be quantified was also stated: ‘the target will be monitored by reference to the number of children in low income households in 2004. Low income households are defined as households with income below 60% of the median, as reported in the Households Below Average Income statistics’. ‘Progress will be measured against the 1998/9 baseline figures and methodology’.b
Although the PSA target does not say whether ‘median income’ means the contemporary median income in each year (a moving target) or median income in 1998–99, it is widely understood that the target is a relative income one, and indeed the statements of ministers reporting progress towards the target have cited poverty numbers that correspond to the moving income line.c
The wording of the PSA target also does not specify whether income is to be measured before housing costs (BHC) or after housing costs (AHC), so the government could measure its progress on either poverty count. In practice, ministers’ statements have tended to focus on progress on the AHC measure.d
a The Department of Social Security is now the Department for Work and Pensions. See Department for
Work and Pensions (2001b) – the quote is from page 1. Note that the target is joint with the Treasury.
b From page 1 of Department of Social Security (2000b).
c For example, see Alistair Darling’s comments on the release of last year’s Households Below Average
Income statistics in Department for Work and Pensions (2001d).
d See Department for Work and Pensions (2001d).
During the last Parliament, the government introduced a number of tax and benefit reforms that benefited low-income families with children, such as large increases in income support and the introduction of the working families’ tax credit. The actual effect of these measures on income poverty is known only with considerable delay, because it takes a long time to collect and process data on incomes. Indeed, at the time of the last election, the most recent figures were from financial year 1998–99, the baseline year for the PSA child poverty target. But the government was sufficiently confident that its measures would make a big difference to publish estimates of their effect. These suggested that impressive progress had been made. In early 2001, the Budget report claimed that ‘tax and benefit reforms announced in this Parliament [i.e. 1997–2001] will lift over 1.2 million children out of relative poverty’.2 At the time of the June 2001
general election, the government went further, proposing that ‘the task for the next Parliament is to help another one million children out of poverty’.3 This suggests that the
government wants child poverty to be about 2 million lower in 2004–05 than it was in 1996–97.
In these ways, strong expectations developed that child poverty was falling substantially. But when, in July 2001, the official poverty figures for financial year 1999–2000 were released, they indicated that progress to date was actually rather modest: 300,000 fewer children were in poverty than during the last year of the Conservative government. This was certainly progress, but it left the government a long way short of its claim to have lifted over 1.2 million children out of poverty. The explanation offered then was that many of the reforms that the government had put in place had not yet been effective. Alistair Darling, the Secretary of State for Work and Pensions, pointed out that the figures covered ‘a period in which we only began to introduce key anti-poverty policies’, citing the working families’ tax credit as an example of a reform that was not fully effective during 1999–2000 (see Department for Work and Pensions (2001d)). The expectation remained that when the figures from the last full year of the Parliament, 2000–01, were published, a really substantial fall in poverty would become evident. But this Commentary will show that a fall of the kind of magnitude expected has again failed to materialise. In fact, the Treasury rather belatedly clarified, towards the end of 2001, that it never intended to imply that child poverty would be 1.2 million lower in 2001–02 than it was in 1996–97, even though that was the most common interpretation given to its forecast (HM Treasury, 2001b).
The structure of this Commentary is as follows. To set the scene, we ask, in Chapters 2 and 3, why the government has a child poverty target, and briefly review the particular targets that the government has focused on alongside possible alternatives. Chapter 4 reviews the range of reforms that Labour has introduced that might have been expected to have reduced child poverty, and Chapter 5 presents the latest counts of children in income poverty, which show that there has been progress to date, but that it has been rather modest. We then explore, in Chapter 6, why these numbers would be expected to differ from government estimates that suggested that Labour’s policy had lifted over a million children out of poverty. In Chapter 7, we consider whether the discrepancy
2 See page 87 of HM Treasury (2001a).
2.
Why a child poverty target?
4Children are not simply a private luxury. They are an asset to the community, and the community can no longer afford to leave the provision for their welfare solely to the accident of individual income.
Eleanor Rathbone, The Case for Family Allowances, 1940.
Economists usually divide arguments for government action in some area into those about economic efficiency and those about equity. Both have special force in the case of child poverty, as it is known to have long-term effects.
Most governments accept the need for some redistribution of money from the richest households to the poorest households because they want to achieve a fairer distribution of living standards or income, however that may be measured (this is the equity argument). Families with children tend to do well from this principle both because families’ consumption needs increase and because their ability to do paid work falls as they have children. There may be particular cause for intervention on equity grounds because of the long-term effects of child poverty – meaning that it leads to inequality in many more outcomes that governments may care about further down the line. Child poverty is also probably more troublesome than adult poverty from an equity perspective because a child has almost no control about whether it lives in poverty or not.
Some commentators have also suggested that there could be a role for intervening to reduce child poverty on efficiency grounds. The efficiency argument is that society has an interest in the outcomes for all children over and above the parents’ and their own interest: in other words, that there are externalities attached to the outcomes for children. For example, it has long been noted that children growing up in deprived households and communities do less well in terms of life chances, and that many of these negative outcomes may impose costs on society – for example, in terms of extra crime. This suggests that, even if parents have the best interests of their children at heart, there could be a role for the government to intervene to try to prevent these adverse outcomes from coming about. Evidence on the size of any such externalities, however, is limited.
Of course, cross-sectional correlations between childhood poverty and adult disadvantage may reflect a range of possible causal linkages. In the past few years, evidence has mounted that suggests that financial deprivation has an impact on educational attainment, wages, employment rates and other social outcomes in adulthood, even after controlling for child ability and aspects of family background. Some commentators argue that the political will to address childhood poverty arose from a growing acceptance among policy-makers that childhood deprivation has identifiable longer-term consequences (see Brewer and Gregg (2001)).
The UK evidence relies mainly on the birth cohorts of the National Child Development Survey of 1958 and the British Cohort Study of 1970. These surveys follow children from birth through to adulthood, giving a wider range of individual child and family characteristics than is common in other available evidence (see, for example, Bradshaw (2001), Gregg and Machin (2000a and 2000b) and Hobcraft (1999)). However, though these studies link low incomes with adverse outcomes, it need not be the case that increasing family income will improve these outcomes – there may be some hidden factor that is producing the apparent causation (for example, some unobserved parental characteristic may lead to both higher parental incomes and better child outcomes). Some recent studies attempt to deal directly with such issues. For example, recent evidence is emerging from the British Household Panel Survey about the possible causal impact of childhood poverty on children and young adults (see Ermisch, Francesconi and Pevalin (2001)). What evidence there is suggests that, if anything, the impacts of low incomes on outcomes are much more pronounced for young children than for teenagers and young adults.
One problem that confronts all governments that want to help children is that governments cannot directly affect children’s own incomes, only those of their parents. Nor can they be sure that parents will spend any extra cash they receive in a way that will improve their children’s well-being. In fact, although there is a great deal of evidence that links deprivation as an adult to growing up in a low-income family when a child, there is little direct evidence as yet from the UK on what impact increasing incomes through extra government transfers has upon children’s well-being.5 Indeed, two recent studies
(Gordon et al., 2000; Middleton, Ashworth and Braithwaite, 1997) suggest that parents in low-income households make sacrifices that ensure that they suffer more material deprivation than do their children. If this is true, then increasing the amount of money going to low-income families with children – which is all that we are measuring when we say that child poverty is falling – might alleviate parents’ deprivation more than children’s. These points help explain why governments provide a great deal of support and assistance for parents and children through public services (which they can be sure will directly benefit children) as well as through income transfers.
5 Kooreman (2000) used Dutch data and found that increases in benefits for children resulted in higher spending on
3. Why
this
child poverty target?
The government could have chosen from a vast array of alternative poverty measures when setting its Public Service Agreement target for 2004. The chosen target – the number of children living in households below 60% of median income – is one of several income measures of poverty monitored over recent years in the government’s official low-income statistics, Households Below Average Income.
As a measure of poverty, the PSA target has advantages – it is a relative measure, which accords well with many people’s notion that poverty should be assessed in the context of the living standards enjoyed by society as a whole.6 The notion of social exclusion may
also weigh in favour of using such a relative target. One cause of social exclusion is having an insufficient income to allow engagement in ‘normal’ social activities. As incomes in general rise, more costly activities will become normal, and so a higher income will be needed to avoid exclusion. The chosen target captures this. At the same time, because it is pegged to the median, the target avoids some of the problems associated with relative measures that are pegged to the mean – these can be prone to sharp fluctuations due to income changes occurring amongst the rich.
The PSA target is also simple to track over time (and compare across countries), and, because it is measured against income, the effect on the numbers in poverty of tax and benefit measures designed to tackle poverty should, in principle, be directly assessable. In addition, as a head count measure – one that counts all people below a particular line as poor – it is intuitively straightforward to grasp. However, the government has fallen short of making this its official poverty measure, and indeed has yet to define exactly what it means when it says it aims to halve child poverty over 10 years and abolish it over 20. Perhaps this is because it recognises that this particular poverty measure – like any other – is imperfect.7
What are the particular problems with the PSA target? In the first instance, the exact location of the poverty line (in this case, at 60% of the median) is an arbitrary choice. Because there are a large number of people bunched at income levels around the chosen line, setting it instead at 59% of median income, for example, would result in a big change in the number of people who would be defined as poor. A related criticism is that the line is not directly linked to any concept of need – either purely physical needs such as food and water, or more general prerequisites for well-being – whereas most people’s
6 For an argument that most people in Britain hold a relative concept of poverty, see Hills (2001).
7 There are some variations on the poverty line mentioned above. For example, incomes can be measured before or
after housing costs – indeed, there is some ambiguity in the wording of the PSA target about which of these progress is to be measured against – and with or without the self-employed. These issues are discussed further in appendix A of
Households Below Average Income. Unless the text says otherwise, when we talk about child poverty, we mean children in
definition of poverty would include some reference to the notion of need (however defined).8
In addition to this, counting the number of people below a particular line takes no account of how far below the line they are, or, in other words, the depth of poverty being experienced. One solution to this problem would be to calculate the poverty ‘gap’ rather than the poverty ‘count’ – i.e. add up across poor families the number of pounds below the poverty line that they fall. This more sophisticated approach, however, may reduce transparency if it proved difficult for the public to grasp.
Another important facet to poverty is the length of time it persists. In the last chapter, we argued that the pernicious long-term consequences of child poverty are one important reason for wanting to reduce it. But such effects seem stronger when poverty is prolonged: there is evidence from the UK and elsewhere that suggests persistent poverty is especially detrimental to children’s outcomes – for example, in terms of educational attainment, health and self-esteem.9 In principle, this facet of poverty can also be
measured by using surveys that track the same individuals over time and so enable us to separate out those whose low incomes are short-lived from those in persistent poverty.10
Such data may pose additional problems of reliability, but an ‘ideal’ child poverty target might well want to prioritise the reduction of persistent poverty that such longitudinal surveys identify.
In practical policy terms, the PSA target also has a number of additional drawbacks. Although not a technical impossibility, it is likely that poverty measured in this way would prove very difficult to eliminate. Even countries such as Sweden and Norway, which are considered to have very low poverty, have not eliminated relative income poverty altogether (see Box 5.1 later). In the UK, it is proving difficult even to reduce the number of children below 60% of median income by one-quarter. In part, this is because the ‘snapshot’ measure of income being focused on will always mean some people appear poor – some individuals may have no income, for example, because they are in the process of claiming benefits or because they are having a break between jobs. From a political point of view, this difficulty makes it unlikely that the government would want to measure progress towards its long-term goal of completely eradicating child poverty against this target.
It is unlikely that a consensus could be reached on any measure of poverty the government could choose. However, we have seen that there are a number of particular objections to the PSA target, and so it is worth touching briefly on the range of possible alternatives that the government could consider for assessing its performance in the future. There is a vast academic literature on measuring poverty, and a staggering array of different measures have been devised which could be used for either monitoring or
8 Coincidentally perhaps, estimates of expenditure needs for families with children calculated by the Family Budget
Unit suggest that income levels slightly below 60% of the median BHC income would be adequate to attain a basic minimum living standard (see Parker (1999)).
9 See Ermisch, Francesconi and Pevalin (2001).
Box 3.1. Alternative poverty indicators A host of indicators – the Opportunity for All approach
The PSA target measure appears as just one of a host of different indicators of childhood poverty published in Opportunity for All, the annual audit of poverty published by the Department for Work and Pensions. Opportunity for All contains 15 indicators of childhood poverty, including being below fixed as well as relative income lines, and indicators of health, work, education and housing.
Other fixed income lines?
Besides the fixed income lines published in Opportunity for All, the government also adheres to a fixed income poverty line for its ambitions regarding eliminating poverty worldwide. An agreement signed at the United Nations in New York in September 2000 between 149 heads of state contains the aim to halve the number of children living in what the UN has defined as ‘absolute’ poverty – where households are on less than $1 a day – by 2015.a The official US poverty line is another fixed-income measure.
Budget standards
The budget standard approach addresses directly the question of how much money is required to meet people’s needs, by calculating the cost of a carefully constructed basket of goods – including food, housing and other items. People are defined as poor if they fall below the income level required to buy this basket. Such an approach has a long historical pedigree in the UK, with the pioneering studies of Rowntree (1901) based on this method. Most recently, the Family Budget Unit has published budget standards for families with children (Parker, 1999) and pensioners (Parker, 2000). Though transparent and explicitly related to need, deciding on the contents of the basket of goods involves thousands of individual decisions by social scientists.
Inability to afford particular necessities
One way of measuring poverty that has received much attention is the ‘Breadline Britain’ approach, so called after an influential study published in the 1980s (see Mack and Lansley (1985)), and subsequently followed up, most recently in the Poverty and Social Exclusion Survey of Britain (see Gordon et al. (2000)). This approach identifies people as in poverty if they lack a critical number of socially perceived necessities (usually two or three), which have been identified through large-scale surveys of the public. Examples of items that a majority of the population consider to be necessities include a damp-free home, a warm waterproof coat and two meals a day. One attraction of this approach is that it allows us to combine a concern with relative poverty with a focus on need. It also captures the longer-term circumstances of families rather than just their current income status.
A hybrid approach?
The Irish solution to measuring poverty has been to develop a headline poverty indicator that combines a relative income measure with an indicator of deprivation similar to that taken in the Breadline Britain approach (see Nolan and Whelan (1996) for the theory and Callan et al. (1999) for the practice). This is generally considered to have been successful in combining the advantages of the two approaches.
targeting it. Indeed, a number of different approaches are already taken within government in different policy contexts. Box 3.1 outlines some of the possible approaches to measuring poverty.
4.
Labour’s tax and benefit policy towards families with children
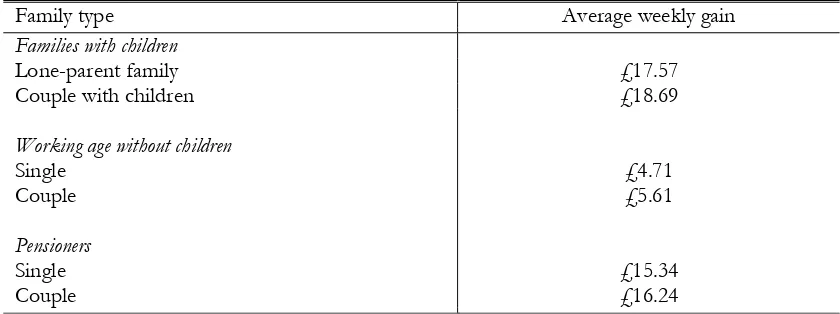
The Labour government has increased support for low-income families with children considerably since 1997. Families with children gained much more from the changes to personal taxes and benefits than did those of working age without children, as Table 4.1 highlights.Table 4.1. Average weekly gains by family type, for all announced direct tax and benefit measures between 1997 and 2001
Family type Average weekly gain
Families with children
Lone-parent family £17.57
Couple with children £18.69
Working age without children
Single £4.71
Couple £5.61
Pensioners
Single £15.34
Couple £16.24
Notes: Indirect tax changes, which do not affect measured poverty, are excluded. Figures are average change for the whole household. Where more than one family lives in a household, all the families are classed as being of the type of the family that is treated in the data as heading the household.
Source: TAXBEN run on 1999–2000 Family Resources Survey data, based on analysis reported in Clark, Myck and Smith (2001).
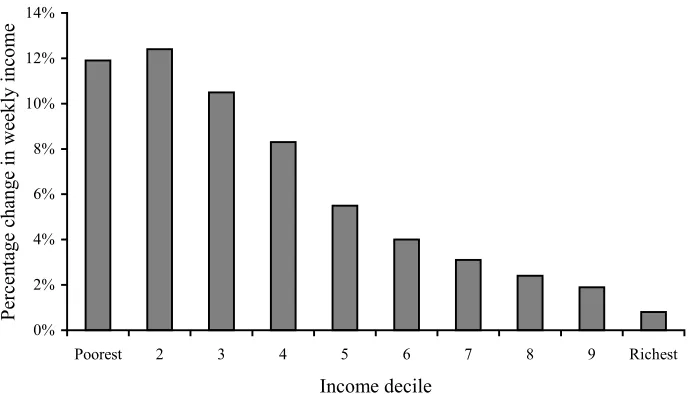
The reforms in the first new Labour Parliament affected children differentially, benefiting children in poor families more than the rich. Figure 4.1 shows how the gains were shared out over the distribution of the household incomes of children. The poorest fifth of children saw their household incomes increase by about 12%. The gains tail away rapidly with income: those in the top decile gained less than 1%. This shows that as well as achieving a substantial redistribution towards families with children, the government has been distributing this extra support between them in a progressive manner. This should have been expected to maximise the effect of the extra money on child poverty.
Figure 4.1. Average proportional gains across the distribution of household incomes amongst children
0% 2% 4% 6% 8% 10% 12% 14%
Poorest 2 3 4 5 6 7 8 9 Richest
Income decile
Percentage change
in
week
ly
in
co
m
e
Note: Indirect tax changes, which do not affect measured poverty, are excluded. Households are weighted by the number of children they contain.
Source: TAXBEN run on 1999–2000 Family Resources Survey data.
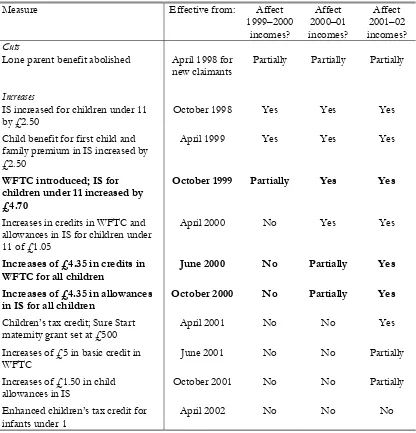
Table 4.2. Reforms to support for families with children announced 1997–2001
Measure Effective from: Affect
1999–2000 incomes?
Affect 2000–01 incomes?
Affect 2001–02 incomes?
Cuts
Lone parent benefit abolished April 1998 for
new claimants Partially Partially Partially
Increases
IS increased for children under 11
by £2.50 October 1998 Yes Yes Yes
Child benefit for first child and family premium in IS increased by £2.50
April 1999 Yes Yes Yes
WFTC introduced; IS for children under 11 increased by £4.70
October 1999 Partially Yes Yes
Increases in credits in WFTC and allowances in IS for children under 11 of £1.05
April 2000 No Yes Yes
Increases of £4.35 in credits in
WFTC for all children June 2000 No Partially Yes Increases of £4.35 in allowances
in IS for all children October 2000 No Partially Yes
Children’s tax credit; Sure Start
maternity grant set at £500 April 2001 No No Yes
Increases of £5 in basic credit in
WFTC June 2001 No No Partially
Increases of £1.50 in child
allowances in IS October 2001 No No Partially
Enhanced children’s tax credit for
infants under 1 April 2002 No No No
IS = income support; WFTC = working families’ tax credit.
Source: HM Treasury, Financial Statement and Budget Report, various years.
5.
Official numbers on child poverty over Labour’s first term
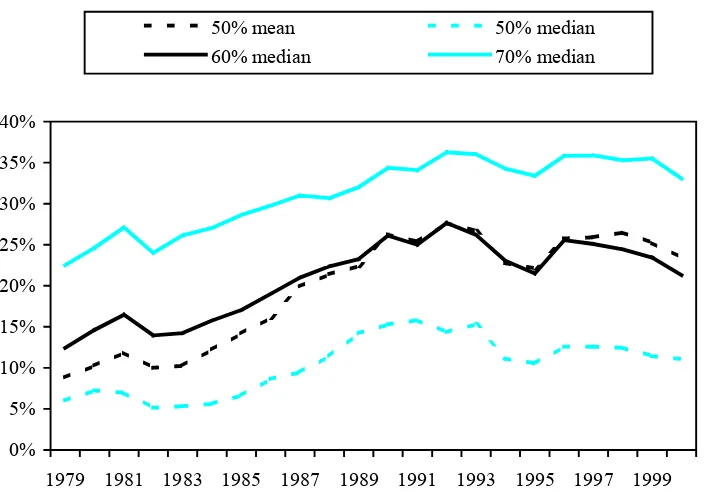
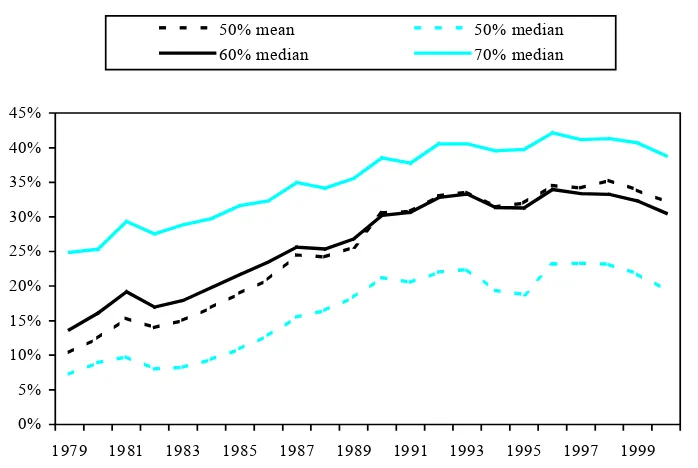
The fraction of children in relative income poverty has increased very markedly over recent decades. Figures 5.1(a) and 5.1(b) show the proportion of children living under a variety of different poverty lines between 1979 and 2000–01. The figures show that the child poverty increases since 1979 do not depend on the particular poverty line or income measure chosen. Using the poverty line which, until recently, was focused on most in the UK – 50% of mean household income – we can see that, over the whole period, the poverty rate amongst children went up from 9% to 23% when considering before-housing-costs income and more than tripled, from 10% to 32%, when considering after-housing-costs income. (After-housing-costs poverty measures are generally higher as housing consumes more of the income of poorer families.) This large increase is quite unlike what went before: between 1968 and 1979, the poverty rate fluctuated within a few percentage points on all measures (see Gregg, Harkness and Machin (1999)).
The increase has not occurred steadily over the years since 1979; rather, it was concentrated in the years between the start of economic recovery in the early 1980s (around 1983) and the recession of the early 1990s. Since then, there has been no particularly strong trend in the number of children in poverty, though all measures declined somewhat at the end of the 1990s. On the BHC measures, the child poverty rate dipped between 1992 and 1995–96, but then rose sharply in 1996–97 before declining modestly in each of the last few years. There is less fluctuation in the AHC measures, although the modest decline over the last few years is also visible.
Figure 5.1(a). Proportion of children falling below various relative income poverty lines, before-housing-costs income
0% 5% 10% 15% 20% 25% 30% 35% 40%
1979 1981 1983 1985 1987 1989 1991 1993 1995 1997 1999
50% mean 50% median
Figure 5.1(b). Proportion of children falling below various relative income poverty lines, after-housing-costs income
0% 5% 10% 15% 20% 25% 30% 35% 40% 45%
1979 1981 1983 1985 1987 1989 1991 1993 1995 1997 1999
50% mean 50% median
60% median 70% median
Notes: Poverty lines are fractions of the contemporary median and mean household income across the whole population (i.e. not just for children). Data up to and including 1992 are for calendar years while those thereafter are for financial years, so 1993 should be read as 1993–94, and so on. Changes in the income definitions make comparisons before and after 1993–94 difficult.
Source: Authors’ calculations based on Family Expenditure Survey for years until 1993 and on Family Resources Survey thereafter.
The government has recently shifted emphasis away from the 50%-mean towards the 60%-median poverty line. This change is in line with EU practice, and 60% of median income may be a better measure of poverty if it captures the gap between the standard of living enjoyed by the poorest families and the ‘typical’ family. Coincidentally, poverty in 1996–97 was very similar measured against either 50% of mean or 60% of median income. Over time, though, the measures have diverged: 60%-median poverty increased by less between 1979 and 1996–97 and has fallen by more since then.
Box 5.1. International comparisons
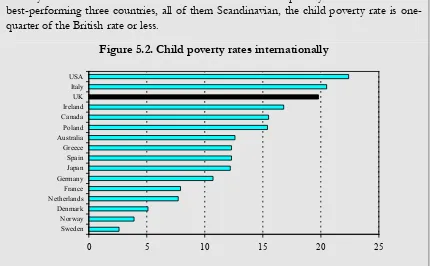
The increase in child poverty since 1979 in the UK – one of the largest in all developed countries – left the UK with one of the highest child poverty rates internationally by the mid-1990s, as is shown in Figure 5.2 (see figure 3.2 in Bradbury and Jäntti (1999)). Poverty rates are seen to be lower in all other countries except Italy and the USA. In the best-performing three countries, all of them Scandinavian, the child poverty rate is one-quarter of the British rate or less.
Figure 5.2. Child poverty rates internationally
0 5 10 15 20 25
Sweden Norway Denmark Netherlands France Germany Japan Spain Greece Australia Poland Canada Ireland UK Italy USA
Note: Graph shows percentage living below 50% of national median after-housing-costs income in selected years over the 1990s.
Source: UNICEF Innocenti Research Centre, A League Table of Child Poverty in Rich Nations, Innocenti Report
Card no. 1, June 2000, www.unicef-icdc.org/publications/pdf/repcard1e.pdf.
Table 5.1. Number of children with incomes below 60% of the median
Below 60% of contemporary median income Before housing costs After housing costs
1996–97 3.3 million 4.4 million
1997–98 3.2 million 4.3 million
1998–99 3.1 million 4.2 million
1999–2000 3.0 million 4.1 million
2000–01 2.7 million 3.9 million
Change
Since 1996–97 –0.6 million (–18%) –0.5 million (–11%)
Since 1998–99 –0.4 million (–13%) –0.3 million (–8%)
Note: Changes and percentage changes are based on unrounded numbers, not the rounded numbers shown in the table. They are also rounded themselves.
Source: Authors’ calculations based on Family Resources Survey. These numbers are almost the same as
What about progress towards the PSA target? Since 1998–99, the base year for the PSA target, the numbers in poverty have fallen by 400,000 (BHC measure) and around 300,000 (AHC measure). This suggests that on a BHC measure, the government is around halfway towards its aim of reducing the numbers in poverty by a quarter, while on an AHC measure, it is just short of being one-third of the way there.
6.
Why do the official numbers not agree with earlier estimates?
The 2001 Budget report claimed that ‘tax and benefit reforms announced in this Parliament [i.e. 1997–2001] will lift over 1.2 million children out of relative poverty’, defined as ‘60% of median income, after housing costs’.11 This sanguine view was notrestricted to the government. An authoritative academic study reached similar conclusions: ‘the results of the micro-simulation of the policy changes announced up to April 2000 suggest that the number of children in poverty will fall by about 1.23 million’ (Piachaud and Sutherland, 2001).
So, now that we have figures for the last year of the first new Labour government, why is the decline in child poverty much more modest than these estimates? The fundamental answer – which had always been admitted by the academic studies but remained hidden amongst the small print of government publications until clarified by the Treasury towards the end of 2001 (HM Treasury, 2001b) – is that both Treasury and academic analyses were not really full predictions of what would happen but were based on models that held everything constant apart from tax and benefit reforms. In practice, many other things have changed since 1996–97: the earnings distribution, employment patterns and average incomes (which bear on the poverty line).12 In addition, there are timing issues:
even data from 2000–01 do not fully reflect all of Labour’s reforms. Finally, whereas tax and benefit models typically analyse the theoretical effects of reforms to a tax and benefit system that operates exactly as intended and responds to circumstances without any delay, in practice the system operates imperfectly and not everyone claims benefits to which they are entitled. There may also be some measurement error in the tax and benefit model estimates of the number of people entitled to benefits, and therefore the number of people that the benefit reforms should have helped.
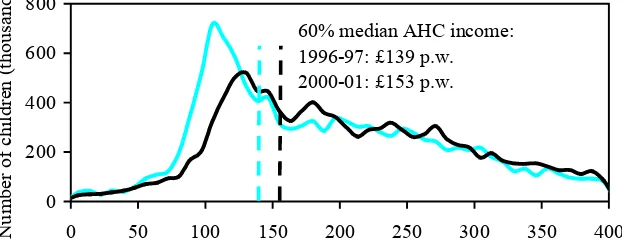
Before we analyse each of these differences in more detail, it is useful to review how the whole distribution of incomes of households with children has evolved since 1996–97, rather than just focus on the number below some poverty line. Figure 6.1 shows the distribution of family incomes (measured after housing costs) for children in 1996–97 and in 2000–01, with the line representing 60% of median income in each year also marked on the graph. (Note that both the poverty lines and the incomes displayed on the horizontal axis are adjusted for family size. Box 6.1 explains this more fully and gives the cash value of the poverty lines for different types of family.) In both years, a definite spike is visible – a particular income range in which a large number of children are concentrated. Children in this spike are mainly those whose families are not working – and since the poverty line for each year lies above the spike, they are also in poverty.
11 HM Treasury, 2001a.
12 Indeed, in a briefing to journalists in late 2001, the Chancellor admitted that he thought that child poverty would
Box 6.1. Poverty lines for families of different sizes
Official low-income and poverty statistics are calculated taking into account the impact of family size and composition on household living standards. This is because larger families clearly need a higher cash income to attain the same standard of living as smaller families. ‘Equivalence scales’ adjust incomes to take account of this. The official Households Below Average Income statistics use one particular scale, the ‘McClements’ equivalence scales. These treat the cash income of couples without children as the baseline; every other family has their income adjusted to the cash income a couple without children would require to attain the same living standard that the family enjoys. The adjusted ‘equivalent’ income is higher than cash income for a single person and lower than cash income for large families. (The McClements scale used is set out in more detail in Table 7.1 later.)
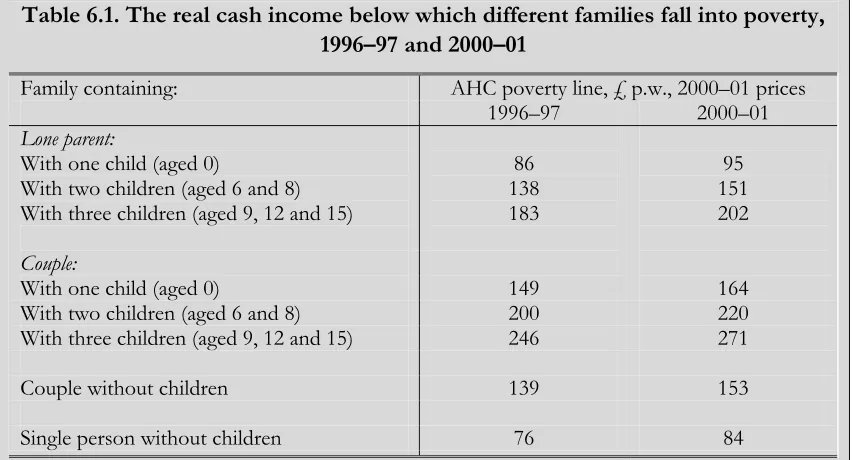
The position of the poverty line is also measured in terms of equivalent income. This means that larger families need a higher cash income to lift them out of poverty than smaller families. The position of the poverty line in cash-income terms for families of different sizes and compositions in 1996–97 and 2000–01 is shown in Table 6.1. It shows that in 2000–01, a lone parent with a baby with a weekly after-housing-costs cash income of £95 or more would no longer be considered to be in poverty, whilst for couples with three older children – the example given here is with three children aged 9, 12 and 15 – a cash income of anywhere up to £271 would still have counted them in poverty.
Table 6.1. The real cash income below which different families fall into poverty, 1996–97 and 2000–01
Family containing: AHC poverty line, £ p.w., 2000–01 prices
1996–97 2000–01
Lone parent:
With one child (aged 0) 86 95
With two children (aged 6 and 8) 138 151
With three children (aged 9, 12 and 15) 183 202
Couple:
With one child (aged 0) 149 164
With two children (aged 6 and 8) 200 220
With three children (aged 9, 12 and 15) 246 271
Couple without children 139 153
Single person without children 76 84
Figure 6.1. The distribution of children’s incomes in 1996–97 and 2000–01
0 200 400 600 800
0 50 100 150 200 250 300 350 400
Household equivalent AHC income, £ p.w., 2000-01 prices
N
umber of chi
ld
ren (t
hous
ands
)
1996-97 2000-01
60% median AHC income: 1996-97: £139 p.w. 2000-01: £153 p.w.
Notes: The income distribution has been truncated at the lower end at £0 and at the upper end at £400 p.w. in order to concentrate on the densest part of the distribution. The poverty lines on the graph are at approximately £139 and £153 p.w.
Source: Family Resources Survey.
Two differences between the two distributions are especially marked:
• The spike (and the dense part of the distribution around it) has moved, from £100 per week to £130 per week, largely reflecting benefit increases.
• The later spike is less high, reflecting the movement of many families with children into work. (There were approximately 600,000 fewer children in workless families in 2000–01 than in 1996–97.)
Both changes have contributed to the decline in the number of children in poverty, and they reflect the different ways in which child poverty can be reduced – either by direct redistribution or by moving people into work. Although government announcements have perhaps emphasised the second strategy the most, in practice policies have been directed both at raising benefits for those out of work and at reducing worklessness amongst low-income families. Offsetting these positive contributions to the latest child poverty figures, however, is the increase in the poverty line, also visible in Figure 6.1. The line representing 60% of median AHC income in 1996–97 was at approximately £139 per week (in 2000–01 prices), compared with £153 per week in 2000–01.
With these broad points in mind, we can now turn to consider in more detail the various reasons why the actual drop in child poverty is smaller than modelled estimates.
6.1 Real income growth
01 for the 60%-median-AHC measure. This is because median income has increased in real terms, since earnings, self-employment income, pension income and investment income all tend to grow in real terms as the economy grows. The reduction of child poverty measured in relative terms therefore involves hitting a moving target. Measuring poverty in relative terms means that poverty can increase at the same time as all households are getting richer.13
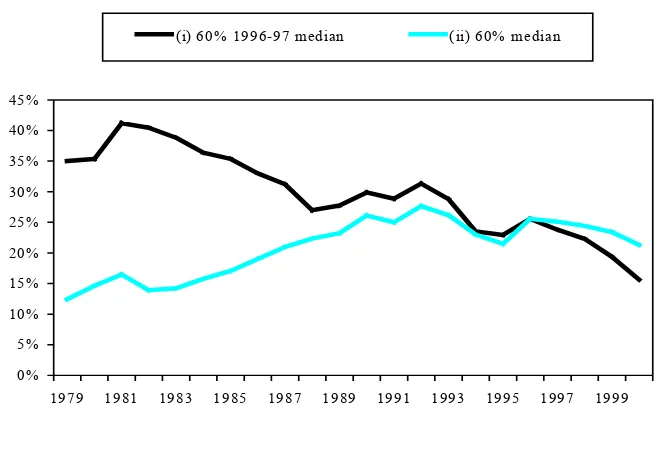
We can quantify exactly the effect of this real increase in the poverty line. Figures 6.2(a) and 6.2(b) compare the proportion of children in households with incomes below poverty lines measured in 1996–97, held constant in real terms in other years, and the proportion with incomes below poverty lines measured relative to the median in each year. The proportion of children in households below 60% of the 1996–97 median AHC income has fallen sharply since 1996–97, from 34% to 24%, a change of 1.3 million children (Figure 6.2(b)). This seems a substantial reduction, and is close to the decline of 1.2 million children that models suggested would be lifted out of poverty by government policy. Past experience confirms the intuition that reducing absolute poverty14 is far
easier over the medium and longer terms than attacking relative poverty: absolute child poverty declined markedly between 1992 and 1997 when relative child poverty was broadly unchanged, and absolute poverty figures for the whole 1979–97 period suggest that there were steady falls in absolute poverty over much of the 1980s in spite of the very large increases in relative poverty. (Though the fact that absolute poverty measured in this way also rose over the late 1980s and early 1990s is notable.)
Figure 6.2(a). Proportion of children falling below 60% of median income measured (i) in 1996–97 only and (ii) in every year, before-housing-costs income
0% 5% 10% 15% 20% 25% 30% 35% 40% 45%
1979 1981 1983 1985 1987 1989 1991 1993 1995 1997 1999
(i) 60% 1996-97 median (ii) 60% median
13 For example, the number of working-age adults without children below 60% of median BHC income has increased
by 200,000 (from 2.7 million to 2.9 million) since Labour came to power, even though unemployment has fallen and employment has risen in these years. This is because their benefits have been frozen in real terms and so those left on benefits have been falling behind average income growth.
14 We use the term absolute poverty to mean poverty measured against a line that does not change in real terms
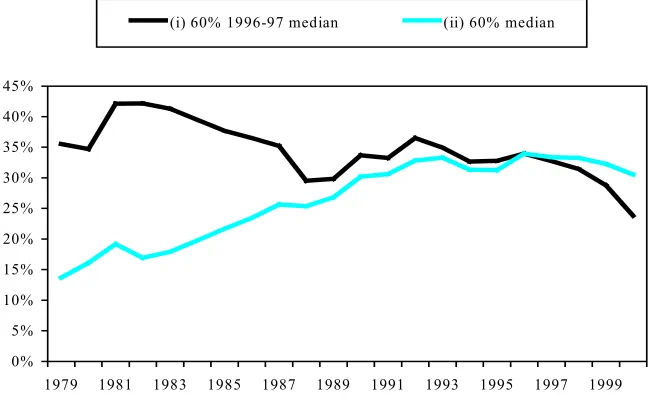
Figure 6.2(b). Proportion of children falling below 60% of median income measured (i) in 1996–97 only and (ii) in every year, after-housing-costs income
0% 5% 10% 15% 20% 25% 30% 35% 40% 45%
1979 1981 1983 1985 1987 1989 1991 1993 1995 1997 1999
(i) 60% 1996-97 median (ii) 60% median
Notes: Poverty lines are fractions of the median household income across the whole population (i.e. not just for children). The 1996–97 poverty line is held constant in real terms across other years. Data up to and including 1992 are for calendar years while those thereafter are for financial years, so 1993 should be read as 1993–94, and so on. Changes in the income definitions make comparisons before and after 1993–94 difficult.
Source: Authors’ calculations based on Family Expenditure Survey for years until 1993 and on Family Resources Survey thereafter.
If we compare the fall in the number of children in households below 60% of the 1996– 97 median AHC income with the change in relative child poverty, we can see that, in 2000–01, around 700,000 children were above the 1996–97 poverty line but remained below the 2000–01 line. In other words, if the median AHC income had remained constant, then these children would indeed have been lifted out of poverty, and the government would have been on course to exceed its PSA target.15 So, the focus on a
relative child poverty target is a major cause of the difference between the 1.2 million modelled estimate of child poverty reduction and the actual out-turn. When we turn to consider the policy implications of the government’s child poverty target, the insight that it involves hitting a moving target will be important: it means that real increases in benefits will be needed just to stand still.
6.2 Families that get no benefits but look as if they should
Modelled estimates of the effect of government policy assume that everyone who looks as if they should get benefits in the data actually does so. For families with children, the great majority of those below the poverty line look like they should get some help. For example, TAXBEN (IFS’s tax and benefit model) suggests that 91% of children below
15 Both the Treasury estimates and Piachaud and Sutherland (2001) allowed the poverty line to increase only as a result
the 60%-median-BHC poverty line are in households that should be receiving either working families’ tax credit or income support.16 A few families slip through the income
safety net – for example, because they have significant savings which disqualifies them from benefit – but the great majority are either out of work, and so entitled to IS, or in low-paid work, and so entitled to WFTC. In practice, fewer poor children actually receive help from these benefits. The 2000–01 Family Resources Survey finds that only 62% of children below the poverty line are in households in receipt of either benefit.
Figure 6.3 illustrates the actual proportion of children in households receiving the main means-tested benefits at different points in the AHC income distribution. Of children below the 60%-median-AHC poverty line, 17% are in households receiving WFTC, 45% are in households receiving IS but not WFTC, and 38% are on neither. This last group of families will not be helped by the government’s policy of increasing means-tested benefits for children.
Figure 6.3. Receipt of the main means-tested benefits across the household income distribution of children, 2000–01
0 100,000 200,000 300,000 400,000 500,000 600,000 700,000
0 50 100 150 200 250 300 350 400
Household equivalent AHC income, £ p.w., 2000-01 prices
Nu
mb
er o
f ch
ild
ren
None IS WFTC
Notes: The income distribution has been truncated at the lower end at £0 and at the upper end at £400 p.w. in order to concentrate on the densest part of the distribution. 60% median AHC income is £153 p.w.
Source: 2000–01 Family Resources Survey.
There are four main reasons why we observe people on a low income who seem to be entitled to a means-tested benefit but are not receiving one:
• They may be families with genuinely low incomes who are not claiming the means-tested benefits to which they are entitled. This is more of a problem for WFTC than for IS: official estimates suggest that over 95% of lone parents entitled to IS are receiving it, but the figure is lower for WFTC, at around 62% (although many of those not claiming their WFTC entitlement will be above the poverty line).17
16 TAXBEN imposing a tax and benefit system with all the government’s reforms announced up until Budget 2001 in
place on data from the Family Resources Survey, 1999–2000.
• They may be families whose ‘snapshot’ incomes are misleading. Some families have income temporarily far below their usual income. Self-employed people are especially likely to experience large fluctuations in their income, but other groups can be affected as well. Previous studies have found that a very high proportion of those with the very lowest reported incomes actually pay income tax, suggesting that their incomes over the year must be higher than reported because it must exceed the personal allowance.18
• They may be people in the process of claiming benefits. The 2000–01 Family Resources Survey suggests that 7.3% of children below the 60%-median-AHC poverty line are in households in the process of claiming WFTC, council tax benefit or housing benefit. (On the 60%-median-BHC measure, the figure is slightly higher, at 8.4%.)
• There may be errors in the tax and benefit program and/or in the data that it uses which could combine to overestimate the number of people entitled to benefits.
Distinguishing the first two groups is difficult but important, for they give rise to very different policy responses. The second group – those whose income at a point in time is not informative about their annual income – can be seen as an anomaly of the data and so do not necessitate any government action. But if the first group – genuinely poor non-claimants – is large, then the effect of tax and benefit reforms on child poverty will be significantly reduced relative to the estimates that models produce. In this case, the appropriate response depends upon the reason for the non-take-up. If ignorance is the cause, then an information campaign might be sufficient. If, instead, the cause is that potential claimants are deterred either by the hassle of the means test or by the feeling that it is demeaning, then the government might think it could improve things by simplifying the claims process or by refining its administration. Alternatively, it could decide that a means-tested approach cannot work, and instead concentrate on increasing child benefit, which is not means tested and which is received by almost all families.
Those in the third group – awaiting receipt of benefits after having claimed them – are also a genuine cause for concern, as their temporarily low incomes may cause genuine hardship. Addressing this hardship directly would require improved administration to ensure that claimants receive the help that they apply for more rapidly.
Regardless of the proportion of children in apparently low-income households who are not on benefits who are judged a genuine cause for concern, the group certainly has serious implications for the government’s ability to hit its child poverty target. For some 1.5 million children who are seen as being in poverty are in families that do not receive the benefits that are the government’s principal instrument for attacking child poverty. This puts almost two in every five poor children out of reach of increases in means-tested benefits, making the child poverty target very significantly harder to reach. The presence of these households also helps to explain further why the government’s measures have not reduced child poverty as much as tax and benefit models predict.
6.3 Change in employment and earnings amongst low-income families
Modelled estimates of changes in child poverty do not take into account any movements of low-income families into and out of work. The number of children in workless households has declined markedly since 1996–97, by some 600,000 (from around 3.3 million to 2.7 million). Although we are unable to track these families over time using the same data source used to calculate the poverty figures, we know that many of them will have moved out of poverty as a result. Increasing employment amongst parents, then, is a force for reducing child poverty which is additional to the government’s tax and benefit reforms.
Given that only a low proportion – 18% – of children living in families with at least one adult in work are in poverty, whereas 80% of children in workless families are in poverty, it seems likely that this number of people moving into work will have contributed significantly to the reduction in poverty. So, steady increases in employment rates for parents since 1996–97 have themselves reduced child poverty (helping to explain why child poverty measured against the 1996–97 median income line has actually fallen by more than 1.2 million).
Although we are unable to put an exact figure on the number of children lifted out of poverty through this increase in employment, we can make a rough estimate. Assuming that the extra 600,000 children in families in work are typical of working families as a whole, we can estimate that approximately 18% of them remain in poverty. This compares with approximately 80% who would have been in poverty if they had instead remained without work and been typical workless families. This would imply a reduction in the number of children in poverty of approximately 400,000 as result of employment growth amongst parents.19 In practice, this is likely to be an overestimate, as parents who
were previously workless might be expected to earn lower wages than those who have consistently worked. Looking forward, the ease with which the government can meet its child poverty targets will depend on how quickly it attains its extremely ambitious target of a 70% employment rate for lone parents (see HM Treasury (2001a)).
In theory, changes to the distribution of wages during Labour’s first term of office could also have had an impact on child poverty. In particular, if inequality had risen, and low wages had failed to keep pace with the median, then measured poverty would have been increased at the end of the Parliament relative to the start. (Note that, like other labour market changes, this development would have been missed by the type of tax–benefit modelling used to estimate the 1.2 million figure.) In practice, there seems to have been little significant change of this type.20
19 The exact calculation of this estimate is as follows: 80% of 600,000 – 18% of 600,000 = 372,000.
20 The New Earnings Survey suggests that the ratio of full-time male wages at the 50th percentile to those at the 10th
6.4 Timing issues
Official poverty figures published in Households Below Average Income capture the average poverty rate over the 12-month period in question: the survey on which HBAI is based samples households randomly throughout the financial year and investigates their income in recent weeks. If changes are made to taxes or benefits in the middle of a financial year, their effect will not show up fully in that year’s figures – only those households interviewed in the second half of the year will be affected, halving the impact. By contrast, the estimate of a reduction in poverty of 1.2 million is arrived at by comparing the effects of the tax and benefit system when Labour came to power with a hypothetical system including the full-year effects of all the changes announced since May 1997.
As the way in which families are selected is random throughout the year, it is possible to use the HBAI data to calculate poverty rates over periods of less than a year. This is interesting, given that we saw in Chapter 4 that one of the major benefit increases that Labour introduced took effect only in the second half of 2000–01. Our own calculations of child poverty in the 14 six-month periods since the beginning of 1994–95 are shown in Figure 6.4. It shows, in particular, that child poverty was substantially lower in the last six months of 2000–01 than it was in the first six months of that year, at 29.4% of all children (on the AHC measure) compared with 31.8% (and compared with the whole-year average of 30.5%). Obviously, such estimates, being based on less than 12 months of data, are less reliable than those that use the full data-set, but statistical tests reported in Appendix B suggest that the within-year decline in poverty is robust.
Figure 6.4. Proportion of children falling below 60% median relative income poverty lines evaluated in six-month periods
20% 22% 24% 26% 28% 30% 32% 34% 36%
1994-95 (I) 1994-95 (II) 1995-96 (I) 1995-96 (II) 1996-97 (I) 1996-97 (II) 1997-98 (I) 1997-98 (II) 1998-99 (I) 1998-99 (II)
1999-2000 (I) 1999-2000 (II) 2000-01 (I) 2000-01 (II)
60% median BHC 60% median AHC
Notes: Poverty lines are fractions of the median household income across the whole population (i.e. not just for children) calculated for each six-month period. ‘1994-95 (I)’, for example, means the first six months of financial year 1994–95 (April 1994 to September 1994); ‘1994-95 (II)’ means the second six months (October 1994 to March 1995).
What does this within-year drop in the poverty rate mean for the headline figures? Had data from only the second half of the year been used, then around 150,000 fewer children would be measured as being in poverty on the AHC measure. The rounded decline in the number of children in AHC income poverty since 1996–97 would have been 0.6 million instead of 0.5 million. The difference on the 60%-median-BHC poverty line is very similar, and the rounded decline since 1996–97 would have increased from 0.6 million to 0.7 million.
This suggests that the benefit increases in Autumn 2000 did lead to a big reduction in child poverty. By considering averages over 12 months when reforms were introduced mid-year, the impact of the most recent means-tested benefits increases is dulled. A similar decline in child poverty on both the BHC and AHC measures is evident between the first and second halves of financial year 1999–2000. This could well be due to the income support increases (and the introduction of the working families’ tax credit) that occurred in Autumn 1999. So looking at data in six-month intervals suggests more clearly that Labour’s major benefit increases did reduce child poverty.
But Figure 6.4 also shows that child poverty increased or remained flat in the first six months of 1998–99, 1999–2000 and 2000–01 compared with the previous six months. This highlights that the relatively small real benefit increases in April 1999 and April 2000 (see Table 4.2) did not have a discernible effect on poverty. This is not especially surprising, given that poverty is being measured relatively. For a lone parent on income support with two children, for example, the £2.10 a week real benefit increase in April 2000 would have represented a gain of just under 2%, and this is about the gain that she would need to keep up with increases in average incomes. Indeed, when benefits increased only in line with inflation in April 1998, child poverty actually went up in the first half of the financial year.
Looking forward, the government has some benefit increases in the pipeline from the last Parliament which will not be fully effective even in the second half of 2000–01. In particular, the child allowances in IS and the child credits in WFTC were increased by more than inflation in financial 2001–02. But these increases were comparatively modest, closer to those of April 2000 than to those of October 2000. Given that the data from the last couple of years seem to suggest that such benefit increases did little more than allow the child poverty rate to stand still, it seems doubtful that those policies from the last Parliament that do not show up in the last six months of 2000–01 data will produce any additional significant poverty reduction.
6.5 Conclusion: why hasn’t child poverty fallen by 1.2 million?
Parliament will have much of an effect on child poverty beyond that already visible in the data.
7.
Is the government’s child poverty target inconsistent with its
policies?
The above discussion has highlighted why the change in the HBAI figures over time differs from estimates of the effects of Labour’s tax and benefit changes. But there may be more fundamental reasons why the impact of Labour’s reforms seems disappointingly small. It could be that the government has picked a particular target which measures something that relates only loosely to its policy aims. There are two particular potential concerns. First, it could be that the official figures adjust incomes for family size in the wrong way, meaning that the families that government policy tries to help do not appear in the figures as poor. Second, it could be that the poverty line is in the wrong place, so that many of those the government is trying to help through tax and benefit policies are already above the line.
7.1 Are incomes adjusted for family size in the appropriate way?
HBAI figures assess child poverty by comparing each child’s family-size-adjusted income with the median family-size-adjusted income. The family size adjustment reduces the incomes of large families and increases the incomes of small families. This converts household incomes into something that gives a more direct indication of the standard of living individuals in a household can achieve. (See Box 6.1.)
The scale used to adjust incomes in HBAI is called the McClements scale (see McClements (1977) or the appendices to any HBAI publication). The McClements scale implies that older children cost a lot more than younger children. Table 7.1 shows the weight placed on children of different ages. An infant scales down a family’s income by only 0.09, whereas a 16-year-old child scales it down by four times as much, 0.36. There might be some good reasons to think that older children do cost more, but few other equivalence scales impose such big differentials.
Table 7.1. The McClements equivalence scales (for BHC income)
Each child aged: Equivalence scale
(for BHC income) 0–1
2–4 5–7 8–10 11–12 13–15 16–18
0.09 0.18 0.21 0.23 0.25 0.27 0.36
Source: Any edition of Households Below Average Income.
of children under 11 was significantly smaller than that received in respect of older children. This is what the McClements scale suggests is necessary in order to ensure that families on income support with children of different ages have the same standard of living. But the government’s initial changes to benefits and tax credits got rid of this differential, by boosting benefits for younger children: Table 4.2 showed that the increases in child credits in the means-tested benefits in 1998 and 1999 were restricted to children under 11. The end result is that all children under 16 attract the same increase in benefits or tax credits (those under 19 and still in education attract a fractionally higher benefit premium).21
One interpretation of this policy is that the government believes that younger children actually cost just as much as older ones. But if this is true, it seems possibly inappropriate and certainly inconsistent to measure poverty in a way that implies that a family with two teenagers will be poorer than a family with two pre-school children on the same income. Alternatively, the government may accept that older children cost more, but wishes to boost the cash family incomes of the poorest children because it believes that the long-run impact of these on life outcomes are greater. In this case, it could argue that its use of McClements-equivalised income is the appropriate gauge of poverty, but that its policy is to concentrate not on the deepest poverty but on that with the most pernicious long-term consequences.
Whatever the thinking, the implication is that the group the government has helped the most since 1997 – those with young children – will not necessarily show up as being the poorest in HBAI. In fact, it seems that the choice of equivalence scale has not made that much difference to the reduction in poverty: the levels of child poverty in both 1996–97 and 2000–01 calculated using a scale that weights children equally are very similar to those calculated using the McClements scale.22 But in the future, this inconsistency may
become more important. At some point, the government will need to choose between redefining its poverty target and increasing benefits just for families with older children, or continuing to increase benefits for children regardless of their age and accepting that this will involve spending considerably extra money on those young children who were already above the poverty line.
7.2 Does the poverty line chosen mean that many of those the government has
helped were never in poverty?
It could be that the government’s chosen poverty line for the purposes of the Public Service Agreement – 60% of median income – is not consistent with the groups whose incomes have increased through tax and benefit changes. In particular, some of the benefit increases could have given substantial amounts of money to people who are already above the poverty line.
One policy whose effect on child poverty is probably lower than expected is WFTC, because many recipients were already above the poverty line before its introduction. A lone parent working 35 hours a week on £4.10 an hour with children aged 3 and 4, for
21 See chapter 3 in Brewer, Myck and Reed (2001) or Banks and Johnson (1993) for more discussion.
example, would have seen an income rise of 22% from Labour’s changes. But even before the reforms, this family would have been comfortably above the 60% median AHC line (and even the 70% line). Indeed, even if the lone parent worked only 16 hours a week, she would still have been above the poverty line in the absence of the reforms. Working couples – who have higher living costs but an equal WFTC entitlement – are more likely to have been below the poverty line before Labour’s reforms, especially if they have older children. But, as we have seen, the benefit increases for those with older children have been smaller, reducing the likelihood of the WFTC putting such individuals above the poverty line.
Whether Labour’s reforms have been well targeted on child poverty can also be seen from Figure 4.1, which shows by how much the incomes of households with children at different parts of the income distribution rose. The poverty line effectively falls in the middle of the third income decile (because around 25% of children were in poverty on the BHC measure in 1996–97), and the figure shows that families in the top seven deciles also saw income increases from Labour’s changes.
7.3 Conclusion: is the target measuring the wrong thing?
All of the various poverty lines charted in Chapter 5 showed comparable trends, suggesting that the precise position of the poverty line is not dominating measurement of the change in child poverty. At the same time, the use of the McClements equivalence scale – which downgrades the cost of the youngest children, who the government has helped the most – turns out to have had little effect on the headline results to date.
Still, it remains true that the government has chosen to spend considerable resources on the WFTC, child benefit and the children’s tax credit, all of which have increased the incomes of a substantial number of families who were above the poverty line. The government may have had good reasons for increasing the income of most families with children – increased in-work support is a necessary accompaniment to higher out-of-work support if out-of-work incentives are not to be undermined, for example – but this helps explain why the decline in child poverty is comparatively modest, given the amount of extra money the government is spending on benefits and tax credits for children.