An approach to Model Based Test case generation for
Student Admission Process
Arpita Tewari, Arun Kumar Misra
Department of Computer Science and Engineering, Motilal Nehru National Institute of Technology, Allahabad-211004
Abstract
In this paper proposed research suggests that the combination of state-transition graph and cause-effect graph is an excellent solution of test oracles problems. The empirical setup for ‘Student admission process’ presented in this paper has been implemented to encourage test results. The suggested approach contains UML and OCL architectures, as input in which the combination of state-transition graph and cause-effect graph are converted into state table and decision tables and its fusion creates an innovation i.e. “state-decision table” has been created to serve as input for generating test cases. The proposed approach embodies UML models, Cause effect graph and OCL for test case generation and for solving the oracle problems.
Keywords: Black box testing, Model based Testing, Unified modelling language, Object constraint language
1 Introduction
i.
Problem domain
Student Admission process of a university is responsible for the subsystem which detects generates and translates student information with eligibility criteria. The subsystem consists of a tasks and actions and their relations.
There are several academic applications that use different configurations of this subsystem. The university employees are system developers in the educational domain who integrate the subsystem to manufacture a complete Student Admission Process (SAP). Rigorous necessities applied by regulatory authorities ( such as admission and examination administration) AEA, in the educational domain includes providing consistent tracking of requirements to implementation and tests. Hence, the present work is carried out in a prohibited domain, which needs a transparent, traceable and effective test and quality assurance process.
The used test environment consists of a basis structure that can simulate the parts of hardware and by the subsystem and a set of test scripts based on a well known unit test framework to perform semi-automatic tests. This environment is also used to generate clear and consistent test logging and tracing. Although the current setup of the test environment has provided a flexible solution for semi-automatic testing of various configurations and setups, there is still ample room for increasing the effectiveness and the efficiency of the tests w.r.t. the effort spent on different phases of testing, as well as various notions of coverage like code,predicate,etc.
Model based testing is considered more suitable for this purpose, because it offers a promising approach in automating test generation. Using MBT, testers can update the model and rapidly regenerate a new test-suite, avoiding tedious and error-prone editing of the suit of hand-crafted test. It is particularly effective in the current system under test and its specification changes frequently and various products may have to be tested with slightly varying models or configurations.
ii.
Problem definition
A disciplined experiment has been applied in this domain testing. All aspect involves choosing data values for different parameters of the system. As the System under test has a large number of parameters, testing all combinations of parameters soon becomes infeasible. The standard data selection technique in which parameter is not independent and selection of one value of a parameter determines the valid range of other parameters; while the built in technique is suitable for independent data parameters. Here, in addition to applying MBT to this domain, the first aim is to develop a framework that can combine the behavioural model with an appropriate data model, and secondly it’s setting, efficiency and effectiveness.
iii.
Compact Effect
The use of Unified Modelling Language and Object Constraint Language is a successful application of MBT in this domain. The association of Cause-Effect Graph for test models, test generation and execution using UML and OCL in order to efficiently select test data from data model makes the test robust. The empirical study shows that the final framework henceforth called (UML+OCL+CEG) for model based testing saves, respectively about 80% and about 20% of the total test effort compared to the semi-automatic and the plain MBT approach ; without using OCL and CEG ,while the improvements w.r.t. distinguish coverage metrics compared with the other techniques.
2 Related Works
The use of behavioural models in Model base testing usually calls for abstract models mostly in terms of finite state machines or labelled transition systems which focuses only on the input output behaviour of the system under test but hide the details about its state variables and appropriate valuations [5, 12]. Reference [5, 6, 9, 11] has developed the theoretical extension of behavioural models and used it in context of MBT. Reference [2] is an earlier experiment of combinatorial explosion of the
combination of data parameters with a tool. They have applied other techniques than what has been explored in this paper for restricting the test data selection. Hence, it is forced to design own framework for combining data models with MBT and no any similar framework has been found in the literature.
In section 1, significant information about the problem domain and problem definition has been provided. In section 2 previous work and existing work close to this field has been explained briefly. Section 3 contains the detailed description of the proposed approach applied for MBT having a clear relationship with cause-effect graph
and OCL. Empirical evaluation with a case study on student admission process has been depicted in section 4. Concluding remarks as well as some avenues for further research is contained in section 5.
3 The Proposed Approach
An efficient model based combined technique of State-transition and Cause-effect has been developed to provide readability effectiveness and cost in better way. The framework of the suggested methodology is as follows:
Figure1: Architecture of the Proposed Methodology
The steps consists the architecture of proposed approach are written as follows;
Step 1 Building a State-Transition Graph
1.1 Creating a State Table corresponding to State-Transition graph
Step 2 Creatinga Cause-Effect Graph
2.1 Building a Decision table that affects the Cause-Effect Graph
Step 3 Introducing an innovative State-Decision Table by fusing State Table and Decision Table
Step 4 Deriving test cases extracting from State-Decision Table
The detailed description of the steps, presented in the proposed approach is as follows.
Utilizing MBT with aid of state-Transition graph
Thesignificant activities that have been carried out in order to apply MBT to System under test,The activity through fusion of state table and Decision table led to the innovation that the occurring framework is efficient for the purpose which is motivational for the methodology.
i. Constructing State Model
State-Transition Graph or State model are alone independent for implementation so its creation is with the objective of making it independent and shows the
STATE TRANSITION GRAPH
STATE TABLE
CAUSE EFFECT GRAPH
DECISION TABLE
STATE-DECISION TABLE
TEST CASE GENERATION
dynamic activation and deactivation of program under test. Since object oriented systems in which transitions are triggered by method calls.
ii. Organizing a State-Table
State table is a method to simplify the large systems into comprehensive manner. This tabular form is made for convenience that specifies states, inputs, transitions, and output.The organizing state table contains six output tasks like T1,T2 etc. Those are obtained from states depicted in figure
iii. Constructing Cause-Effect Model
One of the greater difficulty in MBT is expressing models that are compensator and correct with respect to the requirement specification. This is a serious task as the requirement specification is informal and naturally ambiguous. Creation of model is province and modulating approach as depicted in figure[]. Initially a basic set of requirements in the specification has been designed to capture those requirements, generate a test suite from the mode and evaluate the results after executing test suite. In addition to interaction with cause-effect graph an efficient table has been designed.
Cause Effect Graph is one of the major technique of Black box testing comes in the category of dynamic testing. Like boundary value analysis and equivalence class portioning methods it represents test cases in form of conditions but BVA and ECP methods do not consider combinations of input conditions. Like decision-tables, cause-effect graphing is another technique for combinations of input conditions. This technique takes the help decision table to design a test case and depicts the situation of combinations of input conditions. It is one of the good examples of robust testing method that works in systematic way.
iv. Organizing a Decision-Table
Decision table is another useful method that represents the information in a tabular form. It considers complex combinations of input conditions and resulting actions. It obtains its power from logical expressions.
Implementing an adaptor
State-Decision Table
The MBT model creates the corresponding tables, shown in table[1] and [2].the fusion of state table and decision table results in state decision table[3] behaves as a test adaptor, that best fits between the MBT and plain BBT, having all the characteristics of both. Eventually, test cases generated have different sequence of states, transitions, conditions and actions.
v. Integrating with Cause-Effect Graph
The effort of this work is to apply MBT to an application domain of “Student Admission Process” to unveil necessary dependencies between the behavioural model and its data parameters. A well known data modelling
technique ‘Cause-Effect Graph’ with corresponding ‘Decision Table’ has been used to specify data model. In order to interface with decision table with applied BBT ‘State table’ creation of concrete data values is necessitated.
Benefits of the proposed approach
Coverage in order to measure the effectiveness of the proposed approach coverage of the test suits based on both implementation and model coverage metrics. The following metrics has been used and measured.
Code Coverage or Statement Coverage is the metric represents the percentage of statements exerted to test suits.
Decision Coverage is the metric represents branches that are exerted to test suit.
Predicate Coverage is the model coverage metric, measures the percentage of Boolean expression evaluated both to true or false.
Clause Coverage is also model coverage metric, measures the percentage of atomic Boolean expression evaluated both to true or false.
Transition Coverage is the metric represents the changeover of an event that results in a transformation exerted to test suit.
Testing Technique used Derived Tests combine the parameters on the basis of state-transition graph (STG) and cause-effect graph (CEG). However interdependent states and actions are not tested and testing is applied only for valid and external independent values as it has to be done manually.
Robust Testing used The total number of test cases should be 6n+1;the number of variables that has been used to test are T1, T2, T3, T4, T5 and T6. 6n+1 ; 6*6+1=37 test cases. While derived test cases are only 15 so this is an excellent example of Robust testing.
Test Execution Time is measured by the difference between the starting time of a test and the time at which its execution completes. Both start time , processing time and end time of a test are retrieved from the logging information.
Effectiveness of the derived tests with (MBT+BBT) considered high as it generates only valid and less number of test cases with very low effort. MBT generates a lot of test cases, however most of them are invalid but this effort provides values for the parameters manually from the requirement specification.
Additional bugs found Using BBT and MBT or only by MBT, more bugs can be detected that were overlooked by using only BBT.
4 Experimental Studies for “Student
Admission Process”
performed in StartUML 5.0 version. The environment of this version is preferred to keep the implementation generic and also to be able use the Java and OCL compatibility in order to interface with various modelling and implementation framework.
The three main steps of the suggested approach are test-case generation, test-test-case execution and test analysis. In the order of the proposed methodological approach State-Transition Graph of a Student Admission Process has been designed.
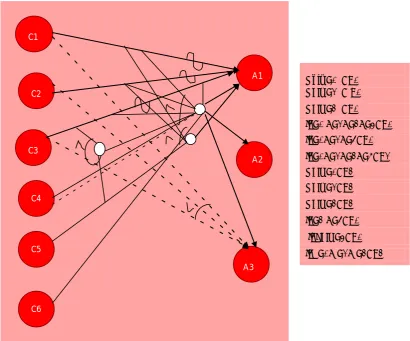
Figure 2: State-Transition Graph of Student Admission Process
Each arrow link provides two types of information: Transition events like admission, checking/Verification etc.
The resulting output from a state like T1, T2, T3 etc. T0= Student is in new state and waiting for admission to ready queue.
T1=A new student admitted to ready queue.
T2= A ready student has running task for checking documents
T3=Checking /Verification task has been waiting I/O or event.
T4=Task has completed execution and admission in normal course.
T5= Task has completed execution and admission in scholarship course.
T6= Task has completed execution and not eligible to take admission.
New_Student
Ready to take admission Checking Eligibility
Waiting
Admitted in normal Course
not Eligible Eligible for Scholarship
c1:marks in java>=70 c2:marks in c++>=60 c3:marks in SE>=60
total in all 3 subjects<220
total in all 3 subjects>=220 total in Java and C++ >=150 total in all 3 subjects>=240
exit,A2
exit,A3
exit,A1
State Table obtained from state-transition graph State/Input
Event Admission Verification I/O or Event Wait I/O or Event Wait Over/Executed Exit New RReReeaaadddyyy///TTT111 New/T0 New/T0 New/T0 New/T0 Ready Ready/T1 VVVeeerrriififfyyyiininnggg///TTT222 Ready/T1 Ready/T1 Ready/T1 Verifying Ready/T2 Verifying/T2 WWaWaaiitititiinnnggg///TTT333 Verifying/T2 EExExxiiitt/t//TTT666 Waiting Waiting/T3 Waiting/T3 Waiting/T3 RRReeeaaadddyy/y//TTT444,,,TTT555,,T,TT666 Waiting/T3
Admitted Admitted
T4,T5,T6 Admitted T4,T5 Admitted T4,T5 Admitted T4,T5 Admitted/T4,T5 Table1: State table for Student admission process
The highlighted cells of the table are valid inputs causing a change of state. Other cells are invalid inputs which do not causes any transition in the state of a task.
In the order of the proposed methodological approach Cause-Effect Graph of a Student Admission Process has been designed in which a university is admitting students in a professional course subject to the following
Marks in java >= 70 Marks in C++ >= 60
Marks in Software Engineering >= 60
Total in all three subjects >=220 OR Total in Java and C++ >=150
If the aggregate mark of an eligible candidate is more than 240, he / she will be eligible for scholarship course, otherwise he will be eligible for normal course. The program reads the marks in the three subjects and generates the following outputs: Not Eligible, Eligible for scholarship course, Eligible for normal course
Figure 3: Cause –Effect Graph of Student Admission Process
Classification and Relationship with OCL elements Condition Transformations C1
C2
C3
C4
C5
C6
A1
A2
A3
Only C1 !=A1 Only C2 != A1 Only C3 !=A1
If C1 ^C2^C3^C4=A1 If C1^C2^C5=A1 If C1^C2^C3^C6=A2 Only C1=A3
Only C2=A3 Only C3=A3 If C3 ^C5=A1 If only C4=A1 If !C1^!C2^!C3=A3
Guard Marks in Java >=70 Marks in c++>=60 Marks in SE>=60
Post Total in 3 subjects=marks in Java@pre+
=marks in c++@pre+ =marks in SE@pre+
New Satisfaction of Guard conditions is now influenced by input parameters.
Decision Table obtained from Cause-effect graph
ENTRY
R1 R2 R3 R4 R5 R6 R7 R8 R9 R10
C1:MARKS IN
JAVA>=70 T T T T F I I I T T
C2:MARKS IN
C++>=60 T T T T I F I I T T
C3:MARKS IN
SE>=60 T T T T I I F I T T
C4:TOTAL IN THREE
SUBJECTS>=220
T F T T I I I F T T
C5:TOTAL IN JAVA AND C++>=150
F T F T I I I F T T
C6:AGGREGATE
MARKS>240 F F T T I I I I F T
A1:ELIGIBLE FOR NORMAL COURSE
X X X
A2:ELIGIBLE FOR
SCHOLARSHIP X X X
A3:NOT
ELIGIBLE X X X X
Table2: Decision table for Student admission process
“State-Decision Table” obtained by fusion of State Table and Decision Table
State Conditions Output R
1 R2 R3 R4 R5 R6 R7 R8 R9 R10
Admission
C1:MARKS IN JAVA>=70
Ready/T1
T T T T F I I I T T
C2:MARKS IN
C++>=60 T T T T I F I I T T
C3:MARKS IN
SE>=60 T T T T I I F I T T
Verification
C4:TOTAL IN THREE
SUBJECTS>=220
Verifying/T2
T F T T I I I F T T
C5:TOTAL IN JAVA AND C++>=150
F T F T I I I F T T
C6:AGGREGATE
MARKS>240 F F T T I I I I F T
I/O or
Event Wait C1,C2,C3,C4,C5,C6 Waiting/T3
I/O or Event Wait
Over/Execute d
A1:ELIGIBLE FOR NORMAL
COURSE Ready/T4,T5,T6
X X
X
A2:ELIGIBLE FOR
SCHOLARSHIP X X X
Exit A3:NOT ELIGIBLE EXIT/T6 X X X X
Table3: State –Decision table for Student admission process
Test Case derivation from State-Decision Table Test
case
Id State Event Java C++ SE
Aggregate-marks Expected output
TC1 New Admit .... 60 60 120 T0 New state
TC2 New Checking 72 65 65 202 T1 Eligible for normal course
TC3 New I/o wait 55 00 02 57 T6 Not eligible
TC4 New I/o wait
over 76 63 64 203 T2 Eligible for normal course
TC5 Ready Admit 83 85 89 257 T4,T5 Eligible for normal course/
scholarship
TC6 Ready Checking 83 45 89 217 T4,t6 Eligible/not eligible
TC7 Ready I/o wait 83 75 89 247 T4,t5,t6 Eligible for normal
/scholarship/ not eligible
TC8 Ready Exit 22 81 32 135 T6 Not eligible
TC9 Verification Admit 71 60 61 192 T1 Eligible to take admission
TC10 Verification I/o wait 70/null 85 72/null ... T2 Ready for running task for
checking documents
TC11 Verification I/o wait
over 99 98 53 250 T4,t5,t6 Eligible for normal course/scholarship/not
eligible
TC12 Verification Exit 59 75 75 209 T6 Not eligible
TC13 Waiting Admit 75 75 70 220 T4 Eligible for normal course
TC14 Waiting I/o wait
over 76 77 89 242 T5 Eligible for scholarship
TC15 Waiting Exit 68 78 80 226 T6 Not Eligible
Table 4: Test cased generation for Student admission process
5 Conclusions
Model based testing has several advantages over simple testing techniques with respect to the spent effort and the coverage achieved. This paper reported an innovative testing theory for Student Admission Process. To this end, the expression of sound and robust test cases has been developed. The notion to generate off-line test cases from a hybrid system table has been used. In order to manage complexity of the implementation several simplifying assumptions on the structure of the invariants and guards has been made.
Defining the coverage along the lines of [] and adapting test case generation in order to maximize specification coverage is an avenue for future research.
References
[1] Insang Chung, “Investigating Effectiveness of Software Testing with Cause-Effect Graphs”, International Journal of Software Engineering and Its Applications,Vol.8, No.7 (2014), pp.41-54
[2] Gary E. Mogyorodi, Requirements-Based Testing - Cause-Effect Graphing”, Software Testing Services, Mississauga, Ontario, Canada L5M4X3
[3] Dhanamma Jagli,Mamatha T,Swetha Mahalingam, Namrata Ojha, “The application of cause effect graph for the College placement process”, International Journal of Software Engineering & Applications (IJSEA),Vol.3, No.6, November 2012,pp77-85
[4] Shafiq Ur Rehman and Aamer Nadeem, "An Approach to Model Based Testing of Multiagent Systems",Hindawi Publishing Corporation,The Scientific World Journal, Volume 2015, Article ID 925206, 12 pages
[5] A. Aerts, M.A. Reniers, and M.R. Mousavi, “ A Tool Prototype for Model-Based Testing of Cyber-Physical Systems”,Proceedings of the 12th International Colloquium on Theoretical Aspects of Computing (ICTAC 2015), Lecture Notes in Computer Science, Springer, 2015.
[6] Stephan Weißleder, Dehla Sokenou, Cause-Effect Graphs for Test Models Based on UML and OCL, GEBIT SOLUTIONS,2015
[7] Vivek Vishal,Mehmet Kovacioglu, Rachid Kherazi, “Integrating Model-Based and Constraint-Based Testing Using SpecExplorer”,
[8] P. Ammann, and J. Offutt. Introduction to Software Testing.Cambridge University Press, 2008.
[9] T. Bauer, R. Eschbach, M. Großl, T. Hussain, D. Streitferdt,and F. Kantz. Combining Combinatorial and Model-based Test Approaches for Highly Configurable Safety-critical Systems.CTIT Workshop Series WP09-08, CTIT, 2009, pages 9–22
[10] W. Grieskamp, N. Kicillof, K. Stobie, V. A. Braberman, “Model-based quality assurance of protocol documentation:tools and methodology”,Software Testing, Verifiability and Reliability 21(1),2011,pp55-71,
[11] S. Mohacsi and J. Wallner, “ A Hybrid Approach for Model-Based Random Testing”, In VALID’2010, 2nd International Conference of Advances in System Testing and Validation Lifecycle, IEEE, 2010, pages 10-15 [12] J. Tretmans, “Model Based Testing with Labelled Transition Systems, In Formal Methods and Testing”, Springer,volume 49,49 of LNCS,2008, pp 1–38
[13] Broy, M., Jonsson, B., Katoen, J.P., Leucker, M., Pretschner, “Model-Based Testing of Reactive Systems”, Advanced Lectures,Springer,LNCS 3472,2105
[14]Dang, T., Nahhal, “Coverage-guided test generation for continuous and hybrid systems”, Formal Methods in System Design,vol34(2),2009,pp183-213
[15]A.Juliu, A. Fainekos, G.E., Anand, M., Lee, I., Pappas, “ Robust test generation and coverage for hybrid systems” In HSCC, 2007ol