Detection of Adolescent Depression from Speech
Using Optimised Spectral Roll-Off Parameters
Melissa N Stolar, Margaret Lech*, Shannon J Stolar and Nicholas B Allen
RMIT University, AustraliaReceived: May 24, 2018; Published: June 01, 2018
*Corresponding author: Margaret Lech, RMIT University, Australia
Research Article
Open Access
Introduction
LINICAL depression is a debilitating affective disorder depict-ed by emotional disturbances, rdepict-educdepict-ed emotional expression and prolonged phases of excessive sadness [1] and impairs a person’s ability to function [2]. Depression is the third highest cause of glob-al disease burden and will be the highest by 2030 [3,4]. In Austrglob-alia depression is the third leading cause of disease burden, the leading cause of non-fatal disability [5] and has a large economic impact costing $14.9 billion annually [6]. The World Health Organization (WHO) has documented an increase in worldwide depression with estimated 121 million sufferers in 2001 [4] to 350 million in 2012 [58]. Depression is the most prevalent mental disorder with the highest lifetime risk [7].
Depression is the leading cause of suicide and accounts for two-thirds of suicides [8] with higher risk in men, indigenous Australi-ans, those in remote areas and children [9]. Since the 1970s there has been a considerable increase in adolescent depression preva-lence. In Australia mental illness is most prevalent in 16-24 year old age group [10,11]. Frequently symptoms of depression initial-ly appear in adolescence [12]. Half of lifetime cases are onset by the age of 14 [12] and one in five by the age of 18 [13]. The rise in adolescent depression is correlated to an increase in youth suicide [13,14] and is the leading cause of youth death [15]. The lifetime
risk of suicide with depression is 20% [16] and can be reduced with treatment [17].
Diagnosis is important but many suffering from a depressive illness do not seek or receive treatment. Approximately 65% of people with mental illness in Australia do not have treatment ac-cess [5]. The main difficulty in diagnosis is a lack of health care re -sources and providers [18]. Depression diagnosis is especially dif-ficult in adolescents as symptoms are unrecognized during initial appearance [19]. Psychological depression diagnosis techniques almost completely rely on professional observations and evalua-tions. The diagnostic method is subjective and contingent on clini-cal judgment that depends on the training, skill set, experience and judgment of the practitioner [20].
Increased depression prevalence [3,4], negative impact on so-ciety [3-6] and sufferers [1,2] especially youth [9,11,13,15] are se-rious problems. Detection and treatment are important to reduce likelihood of relapse [17] and most effective when diagnosed during youth [14]. Adolescents with untreated depression are more likely to have life-long reoccurrences [12,14]. An issue with diagnosis is sufferers not willing or able to seek treatment [18,5]. Moreover, di-agnosis relies on subjective indicators and is especially problematic to detect in adolescence [14,19]. The motivation of this research is ISSN: 2574-1241
Abstract
The purpose of this paper is to examine adolescent depression detection from a clinical database of 63 adolescents (29 depressed and 34 non-depressed) interacting with a parent. A range of spectral roll-off parameters was investigated to observe an association of the frequency-energy relationship in relation to depression. The spectral roll-off range improved depression classification rates compared to the best individual roll-off parameter. Further improvement was accomplished using a 2-stage mRMR/SVM feature selection approach to optimize a roll-off parameters subset. The proposed optimized feature set reached an average depression detection accuracy of 82.2% for males and 70.5% for females. More acoustic spectral features were investigated including flux, centroid, entropy, formants and power spectral density to classify depression. The optimized spectral roll-off set was the most effective of the acoustic spectral features. All spectral features, including the best individual spectral roll-off, was grouped into a baseline feature category (S*) with an average classification accuracy of 71.4% (male) and 70.6% (female). A new spectral category (S), with the inclusion of the proposed optimized spectral roll-off sub-set, performed best with an average accuracy of 97.5% (males) and 92.3% (females).
to create an accessible, non-invasive, efficient and objective adoles -cent depression detection system to improve on current diagnosis procedures. Automatic mass screening could increase depression detection rates and improve access, ability and willingness to seek help. The remainder of this paper is organized as follows: Section II gives a literature review of depression detection and outlines how this study extends on existing work. Section III describes the clini-cal conversational speech database. Section IV outlines the method of pre-processing, feature extraction and modeling. Section V sup-plies results with discussions and Section VII provides conclusions and comparisons to equivalent past work.
Previous Work
The seriousness of depression has led to interest in depression analysis and detection. Clinical depression is associated with dull, monotonous and lifeless speech with a lack of expression [21]. Re-flected changes in speech quality can indicate affective disorders including depression [22,23]. Depressed subjects experience phys-iological fluctuations that alter vocal fold and vocal tract airflow modifying speech properties [24,25]. Depressed speakers exhibit quantifiable changes in spectral, prosodic, articulatory and pho -netic properties [26-29]. Studies have subjectively and objectively evaluated speech parameters as indicators of depression, severity and treatment efficacy [27]. Acoustic depression detection studies have concentrated on feature categories and found spectral fea-tures outperform prosodic [30-36].
Moore et al., compared prosodic and spectral features and de-termined prosodic features performed worse than spectral features [29]. A follow-up study found an optimal subset of prosodic, spec-tral and glottal features reached 91% (males) and 96% (females) in depression classification [36]. France et al. [35] also studied acous -tic properties in correlation to depression severity and found spec-tral features (formants and PSD) attained a top of 94% depression level detection [35]. Low et al., investigated acoustic adolescent de-pression detection with a large clinical database (Oregon research Institute database (ORI)) of 139 parent-adolescent interactions (68 depressed and 71 controls) [36,37]. The studies found MFCC achieved 58%/60% (males/females), TEO attained 54%/61% and the best result of 65%/65% with MFCC+LogE. Low et al., also inves-tigated adolescent depression, using ORI-DB, and found a combina-tion of TEO, F0, LogE, shimmer, spectral flux and spectral roll-off gave the best result for males of 78% [31,32].
Speech has a tendency to be lower at high frequencies and high-er in the lowhigh-er frequencies [38]. The enhigh-ergy-frequency relationship is an important factor in speech of depressed persons [39,40] and can be represented by spectral roll-off. Most speech, emotion and depression detection tasks using the spectral roll-off are restricted to a single parameter where the majority of energy resides (i.e. 75% [41], 80% [31,32], 85% [42,43], 90% or 95% [44]). Some studies have used a limited range of roll-off coefficients (i.e. 25%, 50%, 75%, and 90%) and combined with other features [33,45-47]. This study investigates the effectiveness of spectral features (flux, cen -troid, entropy, PSD, formants, roll-off) for adolescent depression detection. Spectral roll-off is expanded to a range of k values from
5% to 95% with 5% intervals and it is proposed to optimize a sub-set of the new roll-off range.
Database
Family relationships are correlated to adolescent depression so the nature of the database using family interactions is an impor-tant concept [48,49]. The Oregon Research Institute (ORI), USA, has gathered a database (ORI-DB) of adolescent-parent(s) conversa-tional interactions and has been validated by psychology [49-52] and engineering [31,32,36,37] studies. Detailed descriptions of participant recruitment, questionnaires, interviews and depres-sion assessments are available in [53]. The ORI-DB contains 152 conversations between an adolescent (14-18 years old) and their parent(s). The adolescent was considered depressed if they met the Diagnostic and Statistical Manual of Mental Disorders (DSM-IV) cri-teria for major depressive disorder (MDD) [53] and non-depressed if they had no history of mental illness and diagnostic criteria was not met. The participants were from West Oregon, USA with an at-tempt to match depressed and control groups in demographic var-iables (e.g. age, gender, ethnicity and socioeconomic status) [49]. Depressed subjects generally had a lower socioeconomic status and mothers with higher depression levels, which reflects associations in depression [54].
Each participant, seated a few feet apart, had a wireless lapel microphone and recorded on a separate channel with 44kHz sam-pling frequency in a quiet laboratory room. The interactions were divided into three 20-minute discussions including event planning (EPI), family consensus (FCI) and problem solving (PSI) interac-tions [55]. The unscripted setup was designed to preserve natu-ral expressed emotions [55]. Furthermore, spontaneous speech has attained higher depression detection rates than read speech [23,56,57]. The following experiments used a subset of the ORI-DB using only dyadic conversations giving the final corpus a total of 63 subjects (29 depressed and 34 control adolescents). The gender pairings, given by Table 1, shows a biased gender ratio that reflects the trend of higher depression rates in females [58] and is a prob-lem with studies [31,32,35-37].
Table 1: Gender distribution of depressed and non-depressed participants from the ori database for dyadic conversations.
Depressed Non-depressed
Daughter Son Daughter Son
Mother 21 5 24 8
Father 3 0 0 2
29 34
Methods
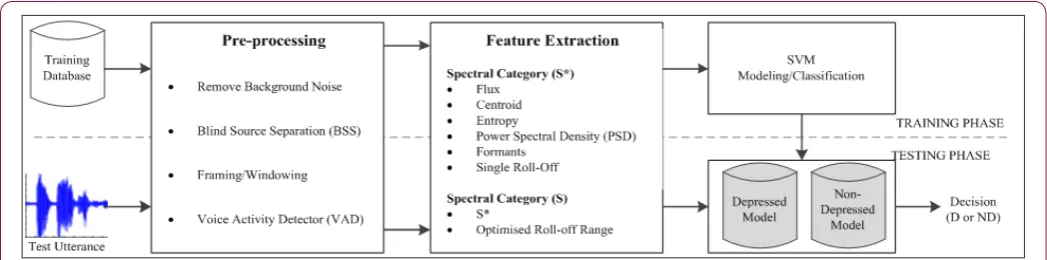
Figure 1: Flow chart framework for acoustic depression recognition procedure including an outline of the three main stages: pre-processing, feature extraction and SVM modeling/classification. The procedure is illustrated with a separation for both the training and testing phases.
Pre-Processing
The adolescent speech signals were pre-processed and cleaned to remove background noise and cross-talk from the parents’ mi-crophone. The clean signal was then segmented into overlapped windowed voiced segments. More detailed descriptions of the speech signal preprocessing is as follows:
Decimate Sampling Frequency: It is acceptable to remove the higher frequency components, as these are redundant for the ma-jority of phonemes. A decrease in sampling frequency minimizes the amount of data and hence reduces processing time and memory requirements. The audio signal was recorded with a 44kHz sam-pling frequency which has been reduced to 11kHz. Down samsam-pling alone causes aliasing that misinterprets high-frequency compo-nents. An anti-aliasing filter (5.5kHz cut-off low-pass filter) was used to enforce the Nyquist frequency and mitigate the undesira-ble effect. Then down-sampling was conducted by a integer factor, M=4, to decimate the sampling frequency.
Cross-Talk Removal using Fast ICA for BSS: During
record-ing the close proximity of speakers led to a problem of interfer-ence between microphones. Instances of simultaneous speech (cross-talk) meant each microphone recorded a weighted mixture of both speaker sources. Simultaneous speech segments should be retained considering the importance in parent-adolescent conver-sations [59]. Blind Source Separation (BSS) was required to recover the original speech sources from simultaneous speech segments. BSS was solved using the Fast ICA algorithm implemented with fast fixed-point independent component analysis algorithm [60].
Background Noise Removal using SS: The speech of
the adolescents was processed to reduce background noise and improve audio quality. In this study Spectral Subtraction (SS), im-plemented with Adobe Audition, was utilized to estimate the noise spectrum that was then removed from recorded speech spectrum [61].
Windowing: The cleaned signal was normalized to within an
amplitude range of -1 to 1 based on the absolute maximum ampli-tude. The normalized signal was segmented into 25ms frames with a 50% overlap. The length was chosen to cover an entire periodic cycle of speech and capture the fundamental frequency. The final
frame was appended with random noise 30dB below the maximum frame amplitude if it was too short. The frames were windowed with an overlapping Hamming function, preferable as it minimiz-es the magnitude of the nearminimiz-est side-lobe in the frequency domain, to increase time resolution and avoid discontinuities between seg-ments.
Voiced Speech Segment Extraction using VAD:
Depend-ing on the production process speech is categorized as voiced or unvoiced. If airflow vibrates vocal cords and excites the vocal tract speech was considered voiced. If air is forced through a constricted vocal tract the vocal cords do not vibrate, hence has no fundamental frequency and is defined as unvoiced. In many emotion and speech analysis applications only voiced segments are analyzed with un-voiced segments considered noise [62]. The un-voiced speech seg-ments were extracted using a voice activity detector (VAD), based on linear prediction [62], from the MATLAB speech processing and synthesis toolbox [63]. The 13th order linear prediction co-efficients, energy of the prediction error, E, and the first refection coefficient, r1, were generated. The optimal thresholds of r1 and E for VAD denotes a segment as voiced if r1>0.2 and E>1.85*107 and retained [64]. If the criteria are not met the segment was consid-ered unvoiced speech or silence and discarded [64].
Feature Extraction: Speech analysis studies generally follow procedures that group acoustic features into categories that relate to the human speech production model [30,32,35] with physiolog-ical and perceptual components. The spectral category is speech related to linear speech production model through the glottis, vocal tract and filtering Table 2. The spectral category acoustic speech features are summarized in Table 2 with the corresponding number of coefficients. The features included flux, centroid, entropy, roll-off coefficients, formants with bandwidths and the power spectral density (PSD) with sub-bands and power ratios. Detailed explana-tions and methodologies of each subcategory feature are explained in the following sections.
Formants and Bandwidths
vocal tract was modeled with a 13th order linear prediction (LP) fil -ter. The first five formants, Fi, and bandwidths, BWi, were estimated as the peaks in the vocal tract spectral envelope represented by the poles of the transfer function, pi, as follows:
(tan1Im( )
2s Re( )
i F pi
F
pi
π
−
= (1)
1( ) ( )s
i F
Bw = π in pi
(2)
Power Spectral Density (PSD)
Power spectral density (PSD) has been effective in distinguish-ing between speech of depressed and non-depressed subjects [34,39,40]. In this study the single-sided power spectral density (PSD) was estimated using the Welch spectral estimator [65]. The PSDdB, given by (3), was generated with a 4096-point FFT with 50% overlapped Hamming windows for the entire bandwidth.
PSD
dB=
10log (
10PSD
)
(3) The total power for the entire bandwidth, P total, was calcu-lated as the area under PSDdB using trapezoidal numerical inte-gration. The power calculation was repeated for multiple spectral sub-bands (Psub-band) in 0-500Hz, 500-1000Hz, 1000-1500Hz, and 1500-2000Hz bands. The ratios of each sub-band powers to the total power are given by (4).
sub band
total
P ratio= P−
(4)
Spectral Entropy
Spectral entropy measures the amount of signal information (Shannon’s information theory) and the spectral distribution spik-iness. For each frame the spectral entropy, H, was computed using (5) where PS is the power spectrum, n defines the frequency com -ponent index and N the FFT length.
/2 2 /2 /2 1 1 1
( )log ( )5
N n n
N N n n n n n PS PS H PS PS = = = = −
∑
∑
∑
(5)Spectral Centroid
The spectral centroid, CS, denotes the center of a signal’s spec-tral power distribution as defined by (6). Where the power specspec-tral magnitudes, 〖PS〗_n, weight the corresponding frequency, fn, for N frequency bins. 11 N n n n s N n n PS f C PS = = =
∑
∑
(6)Spectral Flux
Spectral flux measures the cycle-to-cycle fluctuation in the power spectrum (PS). The spectral flux, 〖Fx〗_S was measured as the Euclidian distance between the PS of consecutive frames de-fined by (7) where i denotes the frame index.
Fx
s=
PS i
( )
−
PS i
( 1)
−
(7)Spectral Roll-Off
Energy in speech signals has a tendency to be lower at high fre-quencies. This quality can be observed with spectral roll-off that
characterizes an energy and frequency relationship [38]. arg min {1,,...., } 1 1
fR N
R n n n n
f ∈ N
∑
=PS ≥K∑
=PS (8)Equation (8) defines the spectral roll-off where n is the frequen -cy bin index, PSn, is the corresponding spectral magnitude, fR is the spectral roll-off frequency and N is the total number of frequency bins. The spectral roll-off is defined as the frequency, fR, that a spec -ified proportion, k, of the total spectral energy is accumulated. Past studies have considered the spectral roll-off where the majority of energy resides [31,32,42,44,66] or as a limited range of spectral roll-off values [33,46-47]. In the following experiments the spec-tral roll-off is generated for a large range of k values from 5% to 95% with 5% intervals (i.e. k=0.05:0.05:0.95) giving a total of 19 parameters.
Modeling and Classification
The SVM is considered an effective binary classifier [67] with good generalization capabilities [68,69]. In this application, the LIBSVM toolbox was used for depression classification [70], with se -quential minimization optimization (SMO) and a radial basis func-tion (RBF) as the kernel. The SVM hyper-parameters (C, ϒ) were op -timized, from 10% of the entire dataset, using a 3-stage grid-search to fine-tune parameters with big, medium and small scales. The ob -jective was to determine the hyper-parameters that maximized the 3-fold cross-validated depression classification accuracy. At each stage the precision was increased and the search space reduced around the current optimal parameters. The remainder of the data-set (90%) was segmented into 80% (training) and 20% (testing) to learn the SVM weights and bias (w and b) parameters. The overall training and testing process was implemented with 3-fold CV and used the previously determined optimal hyper-parameters
Typically, speech analysis applications are more effective with gender dependent models due to acoustic differences in males and female speech [71,72]. Furthermore, depression symptoms [73,74] and speech [59,75,76] are suggested to differ between genders. Consequently, depression detection accuracy is improved using gender dependence [32,36,37]. Therefore in this study the SVM was trained and tested using either the female adolescent (GDM-F) or the male adolescent (GDM-M) speech features for gender depend-ent modeling (GDM).
Evaluation Methods
The SVM depression classification performance was assessed on the sensitivity, specificity and accuracy, given by (9), (10), and (11) [64].
TP
Sensitivity= x 100% TP + FN
TN
Specificity = x 100% TN + FP
TP + TN
Accuracy = x 100%
TP + TN + FP + FN
(9,10,11)
Where the true positive (TP), false positive (FP), false negative (FN) and true negative (TN) parameters are defined as follows:
TN: number of samples correctly classified asnon-de pressed
FN: number samples misclassified as non-depressed
Results
Spectral Roll-off Range
Figure 2: Illustration of the relative difference of the average spectral roll-offs between the non-depressed (ND) and depressed (D) subject over a range of cut-off points, k.
The spectral roll-off is defined as the frequency, fR, that a spec -ified proportion, k, of the spectrum is contained below. In past studies the spectral-roll has been designated as the frequency in that the majority of the energy exists (i.e. 75%, 80%, 85%, and 95% [32,33,41-44] and have a limited range of cut-off points [33,45-47]. In this study the spectral roll-off range has been extended with an increased resolution of 5% increments and larger range from 5% to 95%. The spectral roll-off range was analyzed for correlations to depression by comparing the roll-off, for each point (k). Figure 2 illustrates the relative difference of the average spectral roll-off between the depressed (D) and non-depressed (ND) adolescents. The roll-off frequencies for k<55% are higher for ND than D and in contrast for k>55% the values are higher for D than ND. The in-teroperation is that D compared to ND have less (more) than 55% of energy concentrated below a lower (higher) frequency. This implies D subjects have a higher energy concentration in higher frequencies than ND and that ND has relatively more energy con-centrated in the lower frequencies than the D. In general speech energy has a tendency to be lower at high frequencies [38] and this is shown to be more evident in the ND case compared to the D case. The largest difference of the average spectral roll-off frequencies between D and ND is at k=30% and k=80%. On average there is minimal difference of the average spectral roll-off with k intervals between 5%-10% and 50%-80%.
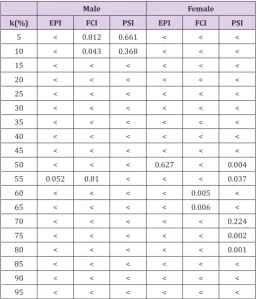
The roll-off parameters were examined to determine signifi -cance in a pairwise comparison of depressed and control groups. ANOVA was performed on separate coefficients, assessed using Wilk’s lambda statistical procedure and considered significant if p<0.05. The p-values, given by Tables 2 & 3, denote significance of t-tests of the spectral roll-off. The roll-off points with significance or no significance coincide with the observations made from Figure 2.
Table 2: Summary of acoustic spectral feature category with feature subcategories and the respective total number of coefficients.
Main Category Sub-Category Number of feature coef-ficients
Spectral
Spectral Flux 1
Spectral Centroid 1
Spectral Entropy 1
PSD 9
Formants & BW 10 Entire Spectral Roll-off
Range 19
Table 3: Anova Analysis On Depressed and Control Spectral Roll-Off Features for Male and Female Adolescents Where “<” Denotes P<0.001 and the Shaded Cells Indicate Significance (P<0.05).
Male Female
k(%) EPI FCI PSI EPI FCI PSI
5 < 0.812 0.661 < < <
10 < 0.043 0.368 < < <
15 < < < < < <
20 < < < < < <
25 < < < < < <
30 < < < < < <
35 < < < < < <
40 < < < < < <
45 < < < < < <
50 < < < 0.627 < 0.004
55 0.052 0.81 < < < 0.037
60 < < < < 0.005 <
65 < < < < 0.006 <
70 < < < < < 0.224
75 < < < < < 0.002
80 < < < < < 0.001
85 < < < < < <
90 < < < < < <
95 < < < < < <
Depression Classification with Optimized Spectral
Roll-off Range Features
Min-imum redundancy and maxMin-imum relevancy (mRMR) as a filter based feature selection method [40]. mRMR was implemented with mutual information quotient (MIQ) to rank feature parameters that best characterize properties to discriminate between depressed and non-depressed subjects to the constraint that features are mu-tually dissimilar [41,40]. MIQ is defined by (12) where C is the class (D or ND), i is the current index of the selected feature and j is a feature that already belongs to the optimal subset given by S. The mutual information between feature i and class C is given by I(i,C) and the mutual information between features i and j is I(i,j).
( )
( )
(
)
(
)
(
(
)
)
,
( , )
1 ( , )
,
, , ,
) ( j S
i j
i j i j
i j i j
I i C MIQ i
I i j S
p x y I i j I x y p x y log
p x p y
∈
=
= =
∑
∑
(12,13)
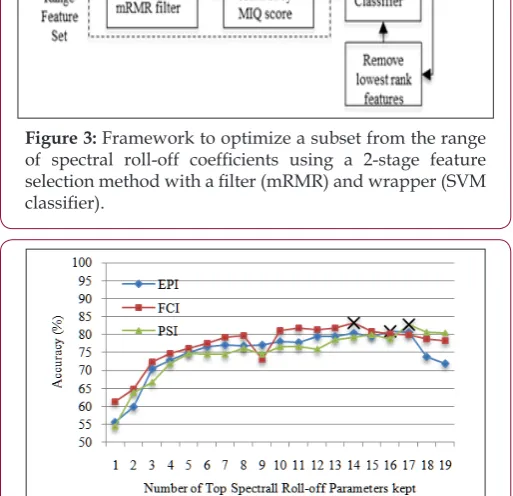
Figure 3: Framework to optimize a subset from the range of spectral roll-off coefficients using a 2-stage feature selection method with a filter (mRMR) and wrapper (SVM classifier).
Figure 4: Accuracy of SVM GDM-M depression classification with 1 to 19 roll-off feature coefficients kept based on MIQ ranking from the mRMR filter.
The mutual information between two features is given by (13), where p(x) or p(y) is the probability density function of variable x or y and p(x,y) is the joint probability density function between x and y Figure 3. The mRMR filter is followed by a second-stage wrap -per to further optimize a feature sub-set that improves depression classification accuracy [40,41]. The wrapper stage was carried out by iteratively removing the lowest ranked coefficient, from the first stage, to find the best 3-fold CV SVM classification accuracy. The en -tire feature optimisation process is summarised by Figure 3 with both stages. Figure 4 (GDM-M) and Figure 5 (GDM-F) shows the depression classification accuracy for iteratively reduced subsets of roll-off coefficients via a mRMR/SVM feature selection. Crosses
signify the highest classification accuracy with the optimal feature subset. The best accuracy for EPI, FCI and PSI occurred with 14, 16, and 17 (GDM-M) and 11, 10, and 17 (GDM-F) of the top ranked coefficients retained in the sub-set.
Figure 5: Accuracy of SVM GDM-F depression classification with 1 to 19 roll-off feature coefficients kept based on MIQ
ranking from the mRMR filter.
A summary of the spectral roll-off depression classification performance is given in Table 3 comparing the optimized spectral roll-off range, the entire roll-off set and the best individual roll-off. Depression classification rates are lower using the best individu -al roll-off compared to the entire roll-off feature set by an average of 19.8% (GDM-M) and 11.2% (GDM-F). The entire feature set was improved further using the optimized roll-off feature set with an average increase in depression classification accuracy of 5% (GDM-M) and 5% (GDM-F). The optimized feature selection was on average 25.2% (GDM-M) and 16% (GDM-F) more accurate com-pared to best individual roll-off coefficient. The optimized roll-off parameters subset has an average accuracy of 82.2% (GDM-M) and 70.5% (GDM-F) with an overall best in the PSI/GDM-F case attain-ing 88.1% accuracy with a sensitivity 86.8% of and specificity of 89.9%.
Spectral Sub-Category Features Depression Classifica
-tion
Table 4: Depression Classification Accuracy, Sensitivity And Specificity Comparing The Entire Spectral Roll-Off Feature Set, The Best Individual Roll-Off Parameter And The Optimized Roll-Off Feature Set Using 2-Stage Mrmr/Svm Selection.
Features Feature Selection Entire Feature Set Best Single Roll-Off
Sens Spec Acc Sens Sens Acc Sens Sens Acc
GDM-M
EPI 83.6 78.1 80.8 75.5 68.3 71.9 60.3 50.7 55.5
FCI 85.3 81.3 83.3 79.7 77 78.4 70.2 52.2 61.2
PSI 86.3 79.2 82.8 81.3 79.7 80.5 76.9 31.9 54.6
GDM-F
EPI 64.2 61.9 63.1 65.7 55.2 60.5 54.3 53.7 54
FCI 68.3 52.3 60.3 50.9 56.1 53.5 60.9 46.9 53.9
PSI 86.3 89.9 88.1 80.5 85.4 83 63.3 48 55.6
Depression Classification with Combined Spectral Cate
-gory Features (S and S*)
Each spectral feature, including the best individual roll-off pa-rameter, was combined into a spectral (S*) category to replicate procedures in past studies [32,33,44,24]. This was compared to a new spectral category (S) with the addition of the proposed opti-mized roll-offs from Section B. SVM depression classification per -formance of each implementation (S* and S) was compared in Ta-bles 5 & 6. The new spectral category (S) with optimized roll-off parameters was the best spectral category by an average of 26% (GDM-M) and 22% (GDM-F) compared to the original spectral
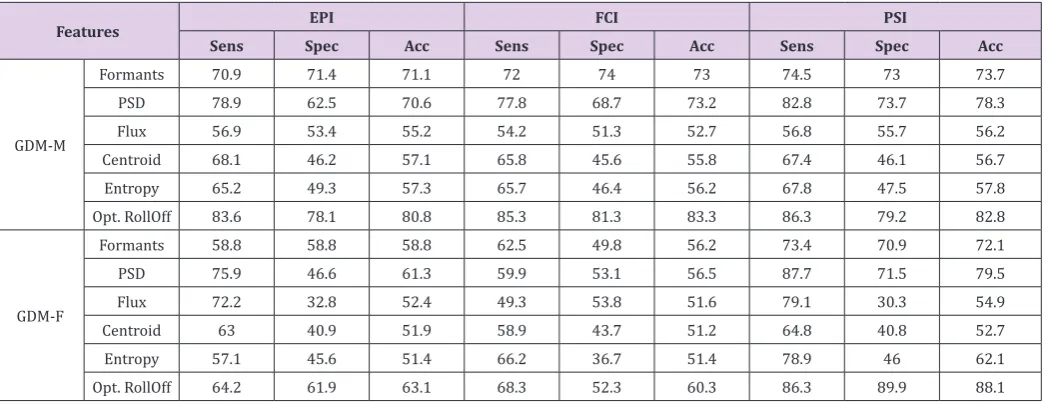
cat-egory (S*). The average accuracy, across the three interactions, was 71.4 % (GDM-M) and 70.6% (GDM-F) for S* and 97.5% (GDM-M) and 92.3% (GDM-F).for S. Overall the best result obtained using the S category was in the PSI/GDM-M case reaching 97.9% accu-racy with 99.5% sensitivity and 96.5% specificity. The individual spectral features classification rates range from as 51% (spectral centroid and entropy) to 88% (optimized roll-off range) depend-ing on the feature/topic/gender combination. Individual spectral features are improved by an average accuracy of 5% (GDM-M) and 11% (GDM-F) combined into the S* category and by 31% (GDM-M) and 33% (GDM-F) using the S category.
Table 5: Accuracy, Sensitivity and Specificity Of Svm Depression Classification (Gdm-M) Using Spectral Sub-Category Features.
Features EPI FCI PSI
Sens Spec Acc Sens Spec Acc Sens Spec Acc
GDM-M
Formants 70.9 71.4 71.1 72 74 73 74.5 73 73.7
PSD 78.9 62.5 70.6 77.8 68.7 73.2 82.8 73.7 78.3
Flux 56.9 53.4 55.2 54.2 51.3 52.7 56.8 55.7 56.2
Centroid 68.1 46.2 57.1 65.8 45.6 55.8 67.4 46.1 56.7
Entropy 65.2 49.3 57.3 65.7 46.4 56.2 67.8 47.5 57.8
Opt. RollOff 83.6 78.1 80.8 85.3 81.3 83.3 86.3 79.2 82.8
GDM-F
Formants 58.8 58.8 58.8 62.5 49.8 56.2 73.4 70.9 72.1
PSD 75.9 46.6 61.3 59.9 53.1 56.5 87.7 71.5 79.5
Flux 72.2 32.8 52.4 49.3 53.8 51.6 79.1 30.3 54.9
Centroid 63 40.9 51.9 58.9 43.7 51.2 64.8 40.8 52.7
Entropy 57.1 45.6 51.4 66.2 36.7 51.4 78.9 46 62.1
Opt. RollOff 64.2 61.9 63.1 68.3 52.3 60.3 86.3 89.9 88.1
Table 6: Depression Classification Accuracy, Sensitivity and Specificity Comparing the Spectral Categories with the roll-off Sub-category as the Best Roll-Off (S*) and Optimized Roll-Off (S).
Feature Set
EPI FCI PSI
Sens Spec Acc Sens Spec Acc Sens Spec Acc
GDM-M S 99.3 95.4 97.3 98.7 95.6 97.3 99.5 96.5 97.9
S* 80.5 61.2 70.9 80.6 62.7 71.7 83.6 59.9 71.7
GDM-F S 98.3 91.7 95.1 96.7 86.5 91.7 95.7 84.6 90.1
S* 78.5 67.3 72.9 66.4 72 69.2 68.6 71.1 69.8
Conclusion
This study has provided an investigation of adolescent depres-sion detection using a variety of commonly used spectral features, including an examination of spectral roll-off features,
than females (GDM-F). The only exception of features performing better in GDM-F was in the conflict invoking PSI. For the majori -ty of sub-category and category feature sets the best interaction was the PSI especially in the GDM-F case. This is consistent with past examinations of interactional topic in relation to depression detection accuracy [33,39]. The three interaction tasks were spe-cifically designed to access unique behavioral characteristics that elicit differential levels of each affect [57,46]. The PSI was setup to evoke conflicting behavior that is strongly correlated to depression in family interactions and could explain the increased depression detection rates [79].
The entire range of 19 roll-off parameters improved depres-sion detection performance compared to the best individual spec-tral roll-off parameter. Accuracy was improved further using the new optimized subset of spectral roll-off parameters using 2-stage mRMR/SVM feature selection reaching an average accuracy of 82.2% (GDM-M) and 70.5% (GDM-F). The optimized spectral roll-off set was the most effective compared to all of the spectral fea-tures. The spectral features were combined into spectral categories with a baseline category (S*) and a new spectral category (S) with the inclusion of the optimized spectral roll-off set. Fusing spec-tral features into categories determined the S category, using the optimized roll-off, had an average of 97.5% (GDM-M) and 92.3% (GDM-F) outperforming the S* category. Overall the best result was in the GDM-M/PSI case with 97.9% accuracy and 99.5%/96.5% sensitivity/specificity. The best results in this paper, of 95.1% and 97.9% for GDM-F and GDM-M, outperform the previous best ORI-DB study by Low et al., reaching 79% (GDM-F) and 87% (GDM-M) using TEO [33]. The study also outperforms the best current de-pression detection study by Moore et al. [80] at 95.6% (GDM-F) and 91.3% (GDM-M) using optimized feature selection from glottal and prosodic feature sets [80].
Acknowledgement
This study was supported by the Defence Science Institute Col-laborative Research Scheme 2015, Round 1.
References
1. J Cavenar (1983) Signs and Symptoms in Psychiatry. Philadelphia: Lippincott Williams & Wilkins, USA.
2. (2016) National Institute of Mental Health 2016, Depression.
3. (2012) World Health Organization (2012) Depression: A Global Crisis World Mental Health Day.
4. (2001) NMH Communications 2001, Mental and neurological disorders. Fact Sheet: The World Health Report 2001, World Health Organization, Geneva, Switzerland.
5. (2007) Australian Institute of Health and Welfare (2007) The Burden of Disease and Injury in Australia. AIHW: Canberra.
6. Beyond Blue (2012) The facts: Depressiom
7. M Fava, K Kendler (2000) Major depressive disorder. Neuron 28: 335-341.
8. US Department of Health and Human Services (2000) Healthy People 2010: Understanding and improving health, vol. 2, US Government Printing Office, Washington, DC, USA.
9. (2010) Commonwealth of Australia 2010, Commonwealth response to The Hidden Toll: Suicide in Australia Report of the Senate Community Affairs Reference Committee, Canberra.
10. P Lewinsohn, Rohde P, Seely JR (1998) Major depressive disorder in older adolescents: Prevalence, risk factors, and clinical implications. Clin Psychol Rev 18: 765-794.
11. (2009) Australian Bureau of Statistics 2009)National Survey of Mental Health and Wellbeing: Summary of Results, ABS: Canberra.
12. R Kessler, Demler O, Jin R, Merikangas KR, Walters EE (2005) Lifetime prevalence and age of onset distributions of DSM-IV Disorders in the National Comorbidity Survey replication. Archives of General Psychiatry pp: 593-602.
13. NHMRC (1997) Depression in young people: a guide for mental health professionals. National Health and Medical Research Council, Canberra Australia.
14. BJ Tonge (1998) Depression in young people. Australian Prescriber 21: 20-22.
15. (2012) Australian Bureau of Statistics 2012, Causes of Death, Australia, ABS: Canberra.
16. I Gotlib, C Hammen (2002) Handbook of depression. Guilford Press, New York, USA.
17. G Isacsson (2001) Suicide prevention a medical breakthrough? Acta Psychiatrica Scandinavica 102: 113-117.
18. (2016) World Health Organisation 2016, Mental Disorders: Facts Sheet. 19. R Muñoz, A, Barrera L, Torres (2009) Overview of depression prevention. Springer Publishing in International Encyclopedia of Depression pp: 447-452.
20. Australian Beruea of Statistics (2008) National Survey of Mental Health and Wellbeing: Summary of Results 2007 ABS: Canbera.
21. P Moses (1954) The voice of neurosis. Grune & Stratton, New York, USA. 22. J Darby (1984) Speech and voice parameters in depression: a pilot study
. J of Comm Disorders 17: 87-94.
23. K Scherer (1987) Vocal assessment of affective disorders, in Depression and expressive behavior. Maser J Ed Lawrence Erlbaum Associates pp: 57-83.
24. M Dietrich, Verdolini Abbott K, Gartner-Schmidt J, Rosen CA (2008) The frequency of perceived stress, anxiety, and depression in patients with common pathologies affecting voice. J Voice 22: 472-488.
25. Husein OF, Husein TN, Gardner R, Chiang T, Larson DG, et al. (2008) Formal psychological testing in patients with paradoxical vocal folds dysfunction. J Laryngoscope 118: 740-747.
26. T Quatieri, N Malyska (2012) Vocal-Source Biomarkers for Depression: A Link to Psychomotor Activity in Proc. Interspeech Portland Oregon pp. 1059-1062.
27. N Cummins, J Epps, E Ambikairajah (2013) Spectro Temporal Analysis of Speech Affected by Depression and Psychomotor Retardation. IEEE Int Conf on Acoustics Speech and Signal Processing.
28. C Mundt (2007) Voice acoustic measures of depression severity and treatment response collected via interactive voice response technology. Journal of Neurolinguistics 20: 50-64.
29. A Flint, Black SE, Campbell-Taylor I, Gailey GF, Levinton C (1993) Abnormal speech articulation, psychomotor retardation, and subcortical dysfunction in major depression. Journal of Psychiatric Research 27: 309-319.
31. LSA Low, Namunu C Maddage, Margaret Lech, Lisa B Sheeber, Nicholas B Allen (2010) Influence of acoustic low-level descriptors in the detection of clinical depression in adolescents. IEEE International Conference on Acoustics Speech and Signal Processing (ICASSP) pp. 5154-5157. 32. LSA Low, Namunu C Maddage, Lisa B Sheeber, Margaret Lech, Nicholas
B Allen (2011) Detection of Clinical Depression in Adolescents’ Speech During Family Interactions IEEE Trans. Biomed Eng 58(3): 574-586. 33. P Lopez-Otero, Laura Docio-Fernandez, Carmen Garcia-Mateo (2014)
A study of acoustic features for depression detection. International Workshop on Biometrics and Forensics (IWBF) Valletta pp: 1-6. 34. D France, Shiavi RG (2000) Acoustical properties of speech as indicators
of depression and suicidal risk, IEEE Trans. Biomed Eng 47(7): 829-837. 35. E Moore, Clements MA, Peifer JW, Weisser L (2008) Critical analysis of
the impact of glottal features in the classification of clinical depression in speech. IEEE Trans on Biomed Eng 55: 96-107.
36. Low A, Maddage N, Lech M, Allen N (2009) Mel Frequency Cepstral feature and Gaussian mixtures for modeling clinical depression in adolescents. IEEE conf Cognitive Informatics pp: 346-350.
37. LSA Low, Namunu C Maddage, Margaret Lech, Lisa Sheeber, Nicholas Allen (2009) Content based clinical depression detection in adolescents. in Proc European Signal Processing Conf pp: 2362-2365.
38. D Fry (1996) The Physics of Speech. Cambridge Textbooks in Linguistics, Cambridge University Press, USA.
39. F Tolkmitt, Helfrich H, Standke R, Scherer KR. (1982) Vocal indicators of psychiatric treatment effects depressives and schizophrenics. J Communication Disorders 15: 209-222.
40. W Hargreaves, J Starkweather, K Blacker (1965) Voice quality in depression. J Abn Psych 70: 218-220.
41. K Ooi (2014) Early prediction of clinical depression in adoleseents using single-channel and multichannel classification approach. Ph D Theis RMIT University.
42. K Ooi, Lech M, Allen NB (2008) Multichannel Weighted Speech Classification system for prediction of major depression in adolescents. IEEE transactions on biomedical engineering p. 60.
43. K Amol, R Guddeti (2014) Multiclass SVM-based language-independent emotion recognition using selective speech features. Int Conf on Adv Computing Comm and Inform pp: 1069-1073.
44. E Scheirer, M Slaney (1997) Construction and evaluation of a robust multi-feature speech/music discriminator, Proceedings of the IEEE International Conference on Acoustics, Speech, and Signal Processing, Munich, Germany 2: 1331-1334.
45. M Valstar (2014) AVEC 2014- 3D Dimensional Affect and Depression Recognition Challenge. Proc. ACM Int. Workshop on Audio/Visual Emotion Challenge Florida pp: 3-10.
46. B Schuller, Michel Valstar, Florian Eyben, Gary McKeown, Roddy Cowie, et al. (2011) AVEC 2011- The first international audio/visual emotion challenge, in Proc. on Affective Computing and Intelligent Interaction (ACII) pp: 415-424.
47. F Weninger, F Eyben, B Schuller (2014) on-line continuous-time music mood regression with deep recurrent neural networks . IEEE Int Conf on Acoustic Speech and Signal Processing pp: 5412-5416.
48. L Sheeber (2007) Adolescent’s relationships with their mothers and fathers: Association with depressive disorder and subdiagnostic symptomology. Journal of Abnormal Psychology 116: 144-154.
49. L Sheeber, Betsy Davis, Joann Wu Shortt, Lynn Fainsilber Katz (2009) Dynamics of affective experience and behavior in depressed adolescents. Journal of Child Psychology and Psychiatry 50: 1419-1427.
50. P Kuppens, Lisa B Sheeber (2012) Emotional Inertia Prospectively Predicts the Onset of Depressive Disorder in Adolescents. Emotions 12: 283-289.
51. L Sheerber (2001) Family processes in adolescent depression. Clinical Child and Family Psychology Review 4: 19-35.
52. P Kuppens, Allen NB, Sheeber LB (2010)Emotional Inertia and Psychological Maladjustment. Psychological Sci 21: 984-991.
53. (2000) American Psychiatric Association 2000, Diagnostic and Statistical. Manual of Mental Disorders, 4th ed., Text Revision, American Psychiatric Association, Washington, USA.
54. D Klein, Seeley, John R Rohde, Paul (2001) A family study of major depressive disorder in a community sample of adolescents. Archives of General Psychiatry 58: 13-20.
55. H Hops (2003) Living in family environments (LIFE) coding system: Reference manual for coders. Oregon Research Institute Eugene OR. 56. S Alghowinem, Roland Goecke, Michael Wagner, Julien Epps, Michael
Breakspear, et al. (2013)Detecting depression: A comparison between spontaneous and read speech . IEEE Int. Conf. on Acoustics, Speech and Signal Processing Vancouver BC pp: 7547-7551.
57. V Mitra, E Shriberg (2015) Effects of feature type, learning algorithm and speaking style for depression detection from speech. IEEE Int Conf on Acoustics Speech and Signal Process pp: 4774-4778.
58. J Cyranowski, Frank E, Young E, Shear MK (2000) Adolescent onset of the gender difference in lifetime rates of major depression. Archive of General Psychiatry 57: 21-27.
59. B Schuller, Anton Batliner Stefan Steidl Dino Seppi (2011) Recognising realistic emotions and affect in speech: State of the art and lessons learnt from the first challenge. Speech Commun 53: 1062-1087.
60. A Hyvärinen, E Oja (1997) A Fast Fixed-Point Algorithm for Independent Component Analysis. Neural Computation 9: 1483-1492.
61. S Boll (1979) A spectral subtraction algorithm for suppression of acoustic noise in speech, in Proc. IEEE Int. Conf. on Acoustics, Speech, and Signal Processing (ICASSP) 4: 200-203.
62. L Rabiner, M Sambur (1977) Voiced-unvoiced-silence detection using the Itakura LPC distance measure, in IEEE Int. Conf. on Acoustics, Speech, and Signal Processing ICASSP 2: 323-326.
63. D Childers (2000) Speech Processing and Synthesis Toolboxes, Chichester Wiley, New York, USA.
64. HT Hu (1993) An improved source model for a linear prediction speech synthesizer, Ph.D. Thesis, University of Florida, Gainesville.
65. D Altman, J Bland (1994) Statistics Notes: Diagnostic tests 1: sensitivity and specificity. BMJ 308: 1552.
66. PD Welch (1967) The Use of Fast Fourier Transform for the Estimation of Power Spectra: A Method Based on Time Averaging Over Short, Modified Periodograms. IEEE Trans. on Audio Electroacoustics 15: 70-73. 67. K Amol, R Guddeti (2014) Multiclass SVM-based language-independent
emotion recognition using selective speech features. Int Conf on Adv Computing Comm and Inform pp: 1069-1073.
68. B Schuller, Anton Batliner Stefan Steidl Dino Seppi (2011) Recognising realistic emotions and affect in speech: State of the art and lessons learnt from the first challenge. Speech Commun 53: 1062-1087.
69. V Vapnik (2000) The Nature of Statistical Learning Theory, 2nd ed. Berlin, Springer, Germany.
70. C Chang, C Lin (2011) LIBSVM: A library for support vector machines. ACM Transactions on Intelligent Systems and Technology.
71. D Ververidis, C Kotropoulos (2006) Emotional speech recognition: resources, features, and methods. Speech communications 48: 1162-1181.
72. T Vogt, E Andre (2006) Improving Automatic Emotion Recognition from Speech via Gender Differentiation. in LREC.
74. S Solen-Hoeksema (1987) Sex differences in unipolar depression: Evidence and theory. Psychol 101: 259-282.
75. H Ellgring, K Scherer (1996) Vocal indicators of mood change in depression. J of Nonverbal Behavior 20: 83-110.
76. S Nolenhoeksema, JS Girgus (1994) The emergence of gender differences in depression during adolescence. Psychological Bulletin 115: 424-443. 77. C Ding, H Peng (2005) Minimum redundancy feature selection from
microarray gene expression data. Journal of Bioinformatics and Computational Biology 3: 185-205.
78. H Peng, Fuhui Long, C Ding (2005) Feature selection based on mutual information criteria of max-dependency, max-relevancy, and min-redundancy. IEEE pattern analysis and machine intelligence 27: 1226-1238.
79. K Ooi (2014) Early prediction of clinical depression in adoleseents using single-channel and multichannel classification approach. PhD Theis RMIT University.
80. L Sheerber (2001) Family processes in adolescent depression. Clinical Child and Family Psychology Review 4: 19-35.
Submission Link: https://biomedres.us/submit-manuscript.php
Assets of Publishing with us
• Global archiving of articles
• Immediate, unrestricted online access • Rigorous Peer Review Process • Authors Retain Copyrights • Unique DOI for all articles
https://biomedres.us/