Cancer Management and Research
Dove
press
O R I G I N A L R E S E A R C H
open access to scientific and medical research
Open Access Full Text Article
Age distribution and age-related outcomes of
olfactory neuroblastoma: a population-based
analysis
Zhenzhen Yin Youyou Wang Yuemei Wu Ximei Zhang Fengming Wang Peiguo Wang Zhen Tao Zhiyong Yuan
Department of Radiation Oncology, Tianjin Medical University Cancer Institute and Hospital, Key Laboratory of Cancer Prevention and Therapy, National Clinical Research Center for Cancer, Tianjin, People’s Republic of China
Objective: The objective of the study was to describe the age distribution and to evaluate the role of prognostic value of age on survival in patients diagnosed with olfactory neuroblastoma (ONB). A population-based retrospective analysis was conducted.
Materials and methods: The population-based study of patients in the Surveillance, Epide-miology, and End Results (SEER) tumor registry, who were diagnosed with ONB from 1973 to 2014, were retrospectively analyzed.
Results: The cohort included 876 patients with a median age of 54 years. There was a unimodal distribution of age and ONBs most frequently occurred in the fifth to sixth decades of life. Kaplan–Meier analysis demonstrated overall survival (OS) and cancer-specific survival (CSS) rates of 69% and 78% at 5 years. Multivariable Cox regression analysis showed that age, SEER stage, and surgery were independent prognostic factors for CSS. The risk of overall death and cancer-specific death increased 3.1% and 1.6% per year, respectively. Patients aged >60 years presented significantly poor OS and CSS compared with patients aged ≤60 years, even in patients with loco-regional disease or in those treated with surgery.
Conclusion: This study highlights the growing evidence that there is a unimodal age distribu-tion of ONB and that age is an important adverse prognostic factor.
Keywords: olfactory neuroblastoma, esthesioneuroblastoma, age distribution, prognosis
Introduction
Olfactory neuroblastoma (ONB) is a rare cancer arising from the upper nasal cavity and ethmoid sinus.1 It constitutes 3% of all nasal cavity and sinus disease.1 To our knowledge, there have been no prospective, randomized clinical trials conducted on ONBs due to its rarity. Many aspects of the disease remain ill defined, such as the cell of origin, clinical behavior, staging, standard treatment, and outcomes.2–5 There is no consensus on the influ-ence of age distribution and the prognostic value of age on the survival of ONB patients. Regarding age distribution, two opposing standpoint views exist. In 1978, Elkon et al6 reported a literature review with 97 patients showing a bimodal age distribution, with peaks in the secondand sixth decades of life. Tumors were infrequent in the <10 and >70 years age groups.6 In contrast, Platek et al7 reported 511 patients from Surveil-lance, Epidemiology, and End Results (SEER) data and observed that only 8% of all ONBs are diagnosed prior to 25 years of age. Most patients (62%) were in the fourth to sixth decades of life, which demonstrated that ONBs were in a unimodal distribution.7
Age has also been suggested as one of the most important independent factors associ-ated with outcomes. However, different opinions have been promoted: several previous
Correspondence: Zhiyong Yuan; Zhen Tao
Department of Radiation Oncology, Tianjin Medical University Cancer Institute and Hospital, Key Laboratory of Cancer Prevention and Therapy, National Clinical Research Center for Cancer, Tianjin’s Clinical Research Center for Cancer, Tianjin 300060, People’s Republic of China
Tel +86 22 2334 5609 Fax +86 22 2334 5607
Email zhiyong0524@163.com; Ztao@ tmu.edu.cn
Journal name: Cancer Management and Research Article Designation: ORIGINAL RESEARCH Year: 2018
Volume: 10
Running head verso: Yin et al
Running head recto: Age distribution and age-related outcomes of ONB DOI: http://dx.doi.org/10.2147/CMAR.S151945
Cancer Management and Research downloaded from https://www.dovepress.com/ by 118.70.13.36 on 20-Aug-2020
For personal use only.
Dovepress
Yin et al
studies showed that ONBs have been observed to behave differently and tend to be more aggressive in the younger population.8–12 Meanwhile, others suggest that there were no significant differences between children and adults.13,14
Due to its rarity, the age distribution and prognostic factors were concluded from single institution and were inconsistent.3,8,9 In order to describe the age distribution and to assess the prognostic predictive value of age in ONBs, an observational study from SEER data was conducted.
Materials and methods
A retrospective study was performed using the SEER
tumor registry database. The database from theSEER 18
(1973–2014) registry was used to extract appropriate cases.
Identification of cases
The SEER database for the years 1973–2014 was used to examine management strategies for ONBs. The histological diagnosis code of 9522/3 (ONB) was queried, and all records were found in the following sites: C30.0 (nasal cavity), C31.0 (maxillary sinus), C31.1 (ethmoid sinus), C31.2 (frontal sinus), C31.3 (sphenoid sinus), C31.8 (overlapping lesion of acces-sory sinus), and C31.9 (accesacces-sory sinus, not otherwise speci-fied [NOS]). Information regarding race, age, gender, year at diagnosis, primary site, SEER stage, and treatment (including surgery, surgery type, radiotherapy, and chemotherapy) were included in this study. No specific staging information such as Dulguerov and modified Kadish classifications was available for these cases; thus, related disease information, including SEER historic stage, was collected from SEER data. The data accessed from SEER database is freely available, and this study did not require a research ethics board/institution review board approval.
Statistical analysis
Primary outcomes included overall survival (OS) and cancer-specific survival (CSS). The Kaplan–Meier method and log-rank test were used to estimate and compare OS and CSS. Covariates were assessed for predictive performance with univariate and multivariate analyses with regard to OS and CSS. Factors identified as significant on univariate analysis were included in multivariate analysis. Comparisons between groups were deemed statistically significant at P<0.05. Data analyses were performed using SPSS 20.0.
Results
Patient data
A total of 876 cases of ONB reported from 1976 to 2013 were included in this analysis. Patients’ characteristics are shown in
Table 1. Except 157 patients, 719 patients were histologically diagnosed ONB, with specimen from surgery. Most patients (79%) were white, and more male (57%) than female. Pri-mary site was mostly located in nasal cavity (78%) rather than in the nasal sinus. The majority of cases (82%) were treated with surgery. Among 719 patients receiving surgery, 43% were partial resection, 27% were gross total resection (GTR), and others were with unknown surgery type. A total of 68% of patients were treated with radiotherapy, and only 28% of patients were treated with chemotherapy.
Age distribution
The median age was 54 years (range 1–91 years). There was a unimodal distribution of age, with most ONBs occurring in the fifth to sixth decades of life. The age distribution is shown in Figure 1. Tumor incidence was infrequent in the age groups of <10 and >80 years. There were differences in the
Table 1 Patients’ characteristics and treatment data
Variables Case
Age (years) 54 (1–91)
≤60 314 (36%)
>60 562 (67%)
Racial
White 692 (79%)
Black 77 (9%)
Others 107 (12%)
Gender
Male 500 (57%)
Female 376 (43%)
Primary site
Nasal cavity 668 (76%)
Nasal sinus 208 (24%)
SEER stage
Localized 190 (22%)
Regional 350 (40%)
Distant 257 (29%)
Unknown 79 (9%)
Diagnosis year
≥2000 623 (71%)
<2000 253 (29%)
Surgery
Yes 719 (82%)
No 157 (18%)
Surgery type
Gross total resection 215 (30%)
Partial resection 311 (43%)
Surgery NOS 193 (27%)
Radiotherapy
Yes 595 (68%)
No/unknown 281 (32%)
Chemotherapy
Yes 247 (28%)
No/unknown 629 (72%)
Abbreviations: NOS, not otherwise specified; SEER, Surveillance, Epidemiology, and End Results.
Cancer Management and Research downloaded from https://www.dovepress.com/ by 118.70.13.36 on 20-Aug-2020
Dovepress Age distribution and age-related outcomes of ONB
mean age of patients with or without surgery. Patients treated with surgery had a mean age of 51 years compared to a mean age of 59 years for patients treated without surgery (P=0.03).
Age-related risk for OS and CSS
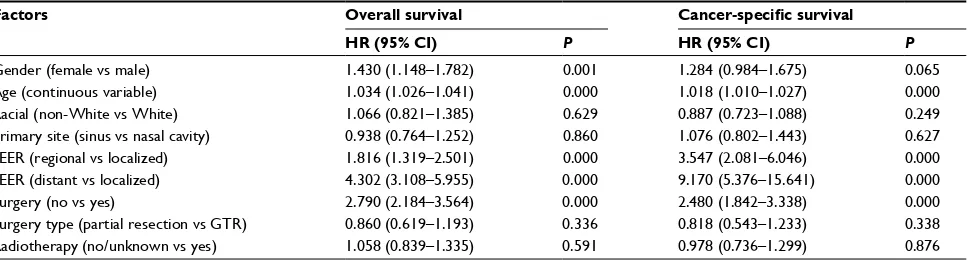
The results of univariate analysis are displayed in Table 2. Patients with localized disease treated with surgery showed significantly superior OS and CSS than patients with regional/ distant disease or those without surgery. Age, as a continuous variable, was demonstrated as having an adverse effect on OS and CSS. Males showed superior survival than females, with a significant difference observed in OS (P=0.001) and a marginal difference in CSS (P=0.065). Regretfully, no sta-tistically significant difference was observed in OS and CSS between patients treated with partial resection and GTR and no statistically significant differences were demonstrated in OS and CSS in patients treated with or without radiotherapy.
To adjust for interaction between covariates, Cox multi-variate analysis was conducted. Factors with P-value <0.05 were included in Cox multivariate analysis. The analysis
confirmed that patients with early-stage disease treated with surgery performed better than advanced disease and without surgery, as shown in Table 3. The Cox multivariate analysis confirmed that the risk of cancer-specific death increased correspondingly with age by 3.1% per year for overall death (hazard ratio [HR] =1.031 [95% CI: 1.024–1.039], P=0.000)
and 1.6% per year (HR =1.016 [95% CI: 1.008–1.025],
P=0.000) for cancer-specific death.
Furthermore, receiver operating curves (ROC) were plotted to identify a proper cutoff value. The area under curve of 0.662 (95% CI: 0.623–0.700), P=0.000 for overall death, and 0.550
(95% CI: 0.505–0.595), P=0.026 for cancer-specific death,
with a cutoff value of 60 years was obtained from our data.
Patients were subsequently categorized as aged >60
and ≤60 years. Patients aged ≤60 years presented with a
significantly superior survival than those aged >60 years
(5-year OS was 78 vs 53%, P=0.000; 5-year CSS was 82 vs
69%, P=0.000). Parallel survival trends were also observed in patients with loco-regional disease (5-year OS was 85 vs
61%, P=0.000; 5-year CSS was 85 vs 77%, P=0.000) and
patients treated with surgery (5-year OS was 81 vs 64%,
P=0.000; 5-year CSS was 85 vs 75%, P=0.000), as shown
in Figure 2 (OS) and Figure 3 (CSS).
Children and adolescents (aged ≤20 years) showed no
significant differences in OS (5-year OS was 71 vs 69%,
P=0.065) and CSS (5-year CSS was 72 vs 78%, P=0.640)
compared with adult patients (aged >20 years).
Discussion
In order to describe the age distribution of ONB patients and to assess the prognostic value of age, a retrospective, population-based data analysis was conducted. To the best of our knowledge, this study of the SEER database repre-sents the largest collection of ONB cases. According to our results, ONBs presented with a unimodal distribution, with Figure 1 Age distribution of all the patients.
Age distribution 25
%
20
15
10
5
0
≤10 10–20 30–40 40–50 50–60 60–70 >70 years
Table 2 Results of univariate analysis
Factors Overall survival Cancer-specific survival
HR (95% CI) P HR (95% CI) P
Gender (female vs male) 1.430 (1.148–1.782) 0.001 1.284 (0.984–1.675) 0.065
Age (continuous variable) 1.034 (1.026–1.041) 0.000 1.018 (1.010–1.027) 0.000
Racial (non-White vs White) 1.066 (0.821–1.385) 0.629 0.887 (0.723–1.088) 0.249
Primary site (sinus vs nasal cavity) 0.938 (0.764–1.252) 0.860 1.076 (0.802–1.443) 0.627
SEER (regional vs localized) 1.816 (1.319–2.501) 0.000 3.547 (2.081–6.046) 0.000
SEER (distant vs localized) 4.302 (3.108–5.955) 0.000 9.170 (5.376–15.641) 0.000
Surgery (no vs yes) 2.790 (2.184–3.564) 0.000 2.480 (1.842–3.338) 0.000
Surgery type (partial resection vs GTR) 0.860 (0.619–1.193) 0.336 0.818 (0.543–1.233) 0.338
Radiotherapy (no/unknown vs yes) 1.058 (0.839–1.335) 0.591 0.978 (0.736–1.299) 0.876
Abbreviations: GTR, gross total resection; HR, hazard ratio; SEER, Surveillance, Epidemiology, and End Results.
Cancer Management and Research downloaded from https://www.dovepress.com/ by 118.70.13.36 on 20-Aug-2020
Dovepress
Yin et al
the disease most frequently occurring in the fifth and sixth decades of life. Age is an independent factor associated with both OS and CSS. The risk of death and cancer-specific death was increased accordingly with age by 3.1% (death) and 1.6% (cancer-specific death) per year. Significant differ-ences in survival existed in patients aged >60 and ≤60 years (P=0.000), and similar survival trends were observed in loco-regional disease or patients treated with surgery.
Over past three decades, ONBs reported in SEER data suggested that there is a significant increase in numbers registered. A total of 62 cases were diagnosed from 1980 to 1989, 166 cases were diagnosed from 1990 to 1999, and 400 cases were diagnosed from 2000 to 2009. The sharp increase in cases reported in SEER data may reflect a greater clini-cal awareness of this tumor in addition to an increase in the incidence of ONB. Nevertheless, ONBs remain a rare and Table 3 Results of multivariate analysis
Factors Overall survival Cancer-specific survival
HR (95% CI) P HR (95% CI) P
Gender (female vs male) 1.363 (1.092–1.700) 0.006 1.293 (0.973–1.719) 0.077
Age (continuous variable) 1.031 (1.024–1.039) 0.000 1.016 (1.008–1.025) 0.000
SEER stage (regional vs localized) 1.691 (1.227–2.331) 0.000 3.276 (1.919–5.592) 0.000
SEER stage (distant vs localized) 3.983 (2.866–5.533) 0.000 8.111 (4.727–13.918) 0.000
Surgery (no vs yes) 2.059 (1.601–2.647) 0.000 2.202 (1.596–3.038) 0.002
Abbreviations: HR, hazard ratio; SEER, Surveillance, Epidemiology, and End Results.
Figure 2 OS curves of patients aged >60 and ≤60 years.
Notes: (A) Overall patients. (B) Patients treated with surgery. (C) Patients with loco-regional disease. (D) Patients with distant disease.
Abbreviation: OS, overall survival.
0 25 50 75
OS rate (%
)
100
A B
C D
60
0 120 180
Follow-up time (months)
240 300 360 420 480
0 25 50 75
OS rate (%
)
100
0 25 50 75
OS rate (%
)
100 5-year OS 85 vs 62%
P=0.000
60
0 120 180
Follow-up time (months)
240 300 360 420 0 60 120 180
Follow-up time (months)
240 300 360 0
25 50 75
OS rate (%
)
100
60
0 120 180
Follow-up time (months)
240 300 360 420 480
≤60 years ≤60 years
>60 years 5-year OS 56 vs 36% P=0.000
≤60 years >60 years 5-year OS 78 vs 53%
P=0.000
5-year OS 81 vs 64%
P=0.000 Entire patients Patients treated with surgery
Distant disease Localized and regional disease
>60 years
≤60 years >60 years
Cancer Management and Research downloaded from https://www.dovepress.com/ by 118.70.13.36 on 20-Aug-2020
Dovepress Age distribution and age-related outcomes of ONB
uncommon disease, accounting for just 3% of nasal cavity and nasal sinus malignant disease.1
Since the first description of ONB in 1924 by Berger et al,18 the age distribution of ONB has been controversial. Two opposite standpoints exist. Several studies supported the opinion that ONB showed a bimodal age distribution, while others reported a unimodal distribution. Skolnik et al15 showed a bimodal distribution of ONBs, with a first peak in the second decade and second peak in the fourth decade. In 1979, Elkon
et al6 reviewed ONBs reported from 1966 to 1979, totaling
97 cases. These data also showed a bimodal distribution with a peak in the age group 11–20 years (17%), with a second, higher peak in the age group 51–60 years (23%). However, Ow
et al16 retrospectively analyzed 70 ONBs from MD Anderson
Cancer Center and showed a unimodal distribution with ONB most frequently occurring in the fourth to sixth decades. As Figure 3 CSS curves of patients aged >60 and ≤60 years.
Notes: (A) Overall patients. (B) Patients treated with surgery. (C) Patients with locoregional disease. (D) Patients with distant disease.
Abbreviation: CSS, cancer-specific survival.
25
0 50 75
CSS (%
)
100
25
0 50 75
CSS (%
)
100
25
0 50 75
CSS (%
)
100
60
0 120 180
Follow-up time (months) 240 300 360 420
60
0 120 180
Follow-up time (months)
240 300 360 420
480 0 60 120 180
Follow-up time (months)
240 300 360 420 480 ≤60 years
5-year CSS 82 vs 69%
P=0.000
P=0.000
P=0.000 Patients treated with surgery Entire patients
A B
C D
>60 years
≤60 years 5-year CSS 88 vs 77%
Localized and regional disease Distant disease
>60 years
P=0.000 ≤60 years 5-year CSS 64 vs 48%
>60 years ≤60 years 5-year CSS 85 vs 75%
>60 years
0 25 50 75
CSS (%
)
100
60
0 120 180
Follow-up time (months)
240 300 360
ONB is an uncommon disease, it is difficult to draw a con-clusion as to the age distribution from small numbers of cases from a single center. A nationwide population-based data analysis is warranted, so in this study, ONBs diagnosed from 1973 to 2014 recorded in SEER data were identified. According to our results, the incidence of ONBs is steadily rising with a peak in the fifth to sixth decades, demonstrating a unimodal age distribution. Child and adolescent ONBs are an extreme rarity, <20% for patients aged <20 years.
There is also no consensus regarding the prognostic value of age in ONBs.17 Elkon et al showed a difference in mean ages of patients with early disease and those with more advanced disease. Stage C patients had a mean age of 30.4 years com-pared to that of 43.1 years for Stage A and 49.8 years for Stage B.6 Other studies from Kadish et al9 and Bisogno et al19 also demonstrated that ONBs behave differently and tend to be
Cancer Management and Research downloaded from https://www.dovepress.com/ by 118.70.13.36 on 20-Aug-2020
Dovepress
Cancer Management and Research
Publish your work in this journal
Submit your manuscript here: https://www.dovepress.com/cancer-management-and-research-journal Cancer Management and Research is an international, peer-reviewed open access journal focusing on cancer research and the optimal use of preventative and integrated treatment interventions to achieve improved outcomes, enhanced survival and quality of life for the cancer patient. The manuscript management system is completely online and includes
a very quick and fair peer-review system, which is all easy to use. Visit http://www.dovepress.com/testimonials.php to read real quotes from published authors.
Dove
press
Yin et al
more aggressive in the younger population. In contrast, Eich
et al13 reviewed 17 ONBs in children and adolescents aged
≤20 years with 5-year OS of 73%, which is consistent with
adult patients. Whether age is an important prognostic factor associated with survival is not clear.17 In order to identify the influence of age on survival, univariate and multivariate Cox regression analyses were conducted. The results suggest that the risk of overall death and cancer-specific death increases accordingly with age. The risk of death increased with age by 3.1% per year, and the risk of cancer-specific death was 1.6% per year according to our study. And according to our results, patients aged ≤20 years presented survival equivalent with patients aged >20 years. There is no significant differ-ence in OS and CSS between children/adolescents and adult patients. Moreover, age 60 years was selected as the cutoff value through ROC of OS and CSS. Patients aged >60 years present significantly poorer OS and CSS than patients aged
≤60 years, which is independent of disease stage and surgery status. Even in patients with loco-regional disease or in those treated with surgery, similar survival trends were observed in patients aged ≤60 or >60 years.
The major limitation of this analysis is that this is a retrospective analysis, so there was unavoidable selection bias in this analysis. Other limitations are some intrinsic limitations from SEER data: for example, the Hyams histo-logical grading system is the only grading system for ONB and was not available for all the patients, so this was not analyzed in this study. Another limitation is that the most widely used stage system, the Kadish staging system, is also not available. The SEER stage was therefore used instead, which categorized the disease into localized, regional, and distant disease.
Conclusion
This analysis of the largest series of ONBs from the SEER database suggests that ONB presents with a unimodal age distribution and most frequently occurs in the fifth and sixth decades of life. Age is one of the most important prognostic factors in predicting OS and CSS. The risk of death increased with age by 3.1% per year, and the risk of cancer-specific death was 1.6% per year according to our study.
Disclosure
The authors report no conflicts of interest in this work.
References
1. Broich G, Pagliari A, Ottaviani F. Esthesioneuroblastoma: a general review of the cases published since the discovery of the tumour in 1924.
Anticancer Res. 1997;17(4A):2683–2706.
2. Dulguerov P, Allal AS, Calcaterra TC. Esthesioneuroblastoma: a
meta-analysis and review. Lancet Oncol. 2001;2(11):683–690.
3. Eden BV, Debo RF, Larner JM, et al. Esthesioneuroblastoma. Long-term outcome and patterns of failure – the University of Virginia experience.
Cancer. 1994;73(10):2556–2562.
4. Devaiah AK, Andreoli MT. Treatment of esthesioneuroblastoma: a 16-year
meta-analysis of 361 patients. Laryngoscope. 2009;119(7):1412–1416.
5. Van Gompel JJ, Giannini C, Olsen KD, et al. Long-term outcome of
esthesioneuroblastoma: hyams grade predicts patient survival. J Neurol
Surg B Skull Base. 2012;73(5):331–336.
6. Elkon D, Hightower SI, Lim ML, Cantrell RW, Constable WC.
Esthe-sioneuroblastoma. Cancer. 1979;44(3):1087–1094.
7. Platek ME, Merzianu M, Mashtare TL, et al. Improved survival follow-ing surgery and radiation therapy for olfactory neuroblastoma: analysis
of the SEER database. Radiat Oncol. 2011;6:41.
8. Bobele GB, Sexauer C, Barnes PA, Krous HF, Bodensteiner JB.
Esthe-sioneuroblastoma presenting as an orbital mass in a young child. Med
Pediatr Oncol. 1994;22(4):269–273.
9. Kadish S, Goodman M, Wang CC. Olfactory neuroblastoma. A clinical
analysis of 17 cases. Cancer. 1976;37(3):1571–1576.
10. Lochrin C. Esthesioneuroblastoma. Med Pediatr Oncol. 1989;17(5):
433–438.
11. Kumar M, Fallon RJ, Hill JS, Davis MM. Esthesioneuroblastoma in
children. J Pediatr Hematol Oncol. 2002;24(6):482–487.
12. Yin ZZ, Gao L, Luo JW, et al. Long-term outcomes of patients with
esthesioneuroblastomas: a cohort from a single institution. Oral Oncol.
2016;53:48–53.
13. Eich HT, Muller RP, Micke O, Kocher M, Berthold F, Hero B. Esthe-sioneuroblastoma in childhood and adolescence. Better prognosis with
multimodal treatment? Strahlenther Onkol. 2005;181(6):378–384.
14. Eich HT, Staar S, Micke O, Eich PD, Stutzer H, Muller R.
Radio-therapy of esthesioneuroblastoma. Int J Radiat Oncol Biol Phys.
2001;49(1):155–160.
15. Skolnik EM, Massari FS, Tenta LT. Olfactory neuroepithelioma. Review
of the world literature and presentation of two cases. Arch Otolaryngol.
1966;84(6):644–653.
16. Ow TJ, Hanna EY, Roberts DB, et al. Optimization of long-term
outcomes for patients with esthesioneuroblastoma. Head Neck.
2014;36(4):524–530.
17. Kane AJ, Sughrue ME, Rutkowski MJ, et al. Posttreatment prognosis of
patients with esthesioneuroblastoma. J Neurosurg. 2010;113(2):340–351.
18. Berger L, Luc G, Richard D et al. L’esthesioneuroepitheliome olfactif
[The Olfactory Neuroblastoma]. Bull Assoc Franc Etude Cancer.
1924;13:410–424. French.
19. Bisogno G, Soloni P, Conte M et al. Esthesioneuroblastoma in pediatric and adolescent age. A report from the TREP project in cooperation with
the Italian Neuroblastoma and Soft Tissue Sarcoma Committees. BMC
Cancer. 2012 25(12):117.
Cancer Management and Research downloaded from https://www.dovepress.com/ by 118.70.13.36 on 20-Aug-2020