Type of the Paper (Data Descriptor)
1
Interactive 3d models and animations for
2
understanding earth’s coordinate systems
3
Sanjeev Kumar Srivastava
4
1 School of Science and Engineering,
5
Faculty of Science Health Education and Engineering,
6
University of the Sunshine Coast, Queensland Australia
7
8
Abstract: This work presents datasets that can be used for getting a good understanding of an
9
essential geoscience content knowledge that describe earth’s coordinate systems. This include
10
coordinate system used for spherical/spheroidal earth with latitudes and longitudes and their
11
subsequent transformations to 2d maps on a variety of media (paper as well as digital) using the
12
process of map projections. The datasets include PDF documents that are embedded with 3d
13
models, animations and mathematical equations. The dataset has separate PDF documents for
14
geographic (for spherical earth) and projected (2d) coordinate systems. Additionally, the data set
15
include individual 3d models that can be used in various digital systems (including apps) and the
16
animations in mp4 format that can be watched on most of the modern digital devices.
17
Dataset: http://dx.doi.org/10.4227/39/5a77c1220483a
18
Dataset License: Data with this article is public repository under a Creative Commons Attribution
19
4.0 International License. Data is available from USC Research Bank through the following link:
20
http://dx.doi.org/10.4227/39/5a77c1220483a
21
Keywords: Map projections; coordinate systems; earth's 3d models; earth's 2d representation
22
23
1. Summary
24
The use and collection of geographic data as well as application of geospatial technologies across
25
diverse disciplinary areas has increased manifold (Srivastava & Tait, 2012). A pre-requisite for
26
using modern geospatial technologies as well as geodatabases is to have a good understanding of
27
the models that represent that represent information from the curved surface of
28
spherical/spheroidal earth on a 2d media. Use of geospatial information without a good
29
understanding has been noticed in many recent studies [1-4]. These digital resources will provide
30
opportunity for educators as well as users of geospatial data to get deeper understanding about the
31
appropriateness of the spatial data for various uses and representations.
32
The process of representing information from curved 3d surface of the earth to 2d media using
33
several types of map projection began more than two thousand years ago [5-7]. Since then, various
34
map projection methods have been proposed, and there are plenty of literature describing the
35
process [8-11]. The datasets presented in this publication has utilized knowledge from literature
36
and used modern software tools together with available digital data for creating 3d models and
37
subsequent animations to demonstrate diverse ways to represent earth surface information on 2d
38
media. Detailed methods for creating these data sets is described in a separate publication [12].
39
2. Data Description
40
This section provides details of datasets which shared through this article.
41
42
2.1. Type of data
43
Interactive 3d models and animations embedded in PDF documents, individual animations and
44
3d models.
45
How data was acquired
46
Datasets were created from freely available world maps in digital format. These maps were
47
subsequently used for created 3d models of the earth. The 3d earth models were eventually
48
transformed into 2d maps, and animations were created for this process. Global maps were created
49
from geographic datasets and modified using a combination of software packages that included
50
ArcGIS, Autodesk Maya, GIMP, Meshlab and Adobe Acrobat, Microsoft Word, VirtualDub, and
51
VidCoder.
52
Data format
53
PDF documents, mp4 movies, and 3d models as u3d.
54
Experimental factors
55
An understanding of relevant geoscience content area.
56
Experimental features
57
3d models and animations are created using theoretical knowledge about earth’s representation
58
on 2d media using modern software tools.
59
Data source location
60
Research repository website of University of the Sunshine Coast, Queensland, Australia
61
Data accessibility
62
Data with this article is public repository under a Creative Commons Attribution 4.0
63
International License.
64
Data is available from USC Research Bank through the following link:
65
http://dx.doi.org/10.4227/39/5a77c1220483a
66
3. Methods
67
Methods used for creating 3d models and animations was published in the following
68
publication:
69
Srivastava, S., Techniques for developing resources to understand geographic and
70
projected coordinate systems. Journal of Spatial Science, 2014. 59(1): p. 167-176.
71
The datasets include the following:
72
1. PDF documents on selected topics (Figure A). This include:
73
a. 3d models for spherical earth’s coordinate system. This coordinate system is referred as
74
geographic coordinate system and uses latitude and longitude values.
75
b. 3d models, animations, and mathematical equations for coordinate systems of 2d earth
76
(Table 1). This coordinate system is referred as projected coordinate system and uses distance units
77
(metre, feet, etc.) on X and Y axes.
78
2. Raw animation files in mp4 format.
79
3. Raw 3d models in u3d format which is also available in individual PDF documents
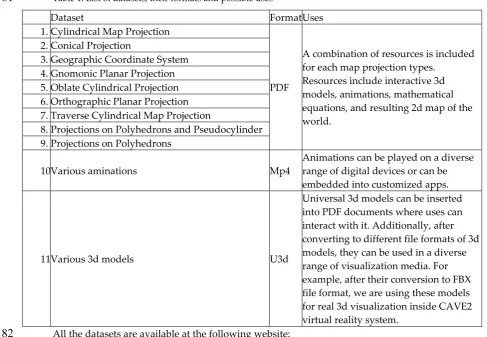
Table 1: List of datasets, their formats and possible uses
81
Dataset Format Uses
1.Cylindrical Map Projection
A combination of resources is included for each map projection types.
Resources include interactive 3d models, animations, mathematical equations, and resulting 2d map of the world.
2.Conical Projection
3.Geographic Coordinate System 4.Gnomonic Planar Projection 5.Oblate Cylindrical Projection 6.Orthographic Planar Projection 7.Traverse Cylindrical Map Projection
8.Projections on Polyhedrons and Pseudocylinder 9.Projections on Polyhedrons
10Various aminations Mp4
Animations can be played on a diverse range of digital devices or can be embedded into customized apps.
11Various 3d models U3d
Universal 3d models can be inserted into PDF documents where uses can interact with it. Additionally, after converting to different file formats of 3d models, they can be used in a diverse range of visualization media. For example, after their conversion to FBX file format, we are using these models for real 3d visualization inside CAVE2 virtual reality system.
All the datasets are available at the following website:
82
84
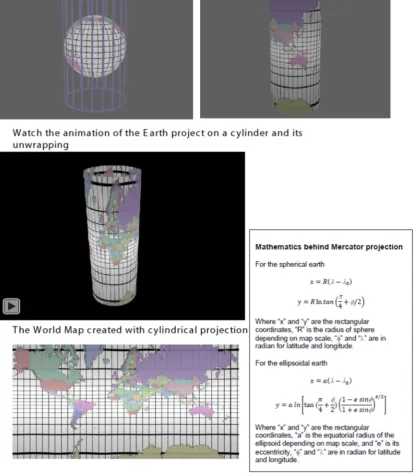
Figure A: An example of PDF resource about a map projection type with interactive 3d model,
85
animation and mathematical equation
87
Figure-B: Examples of 3d models representing projection of spherical/spheroidal earth on different
88
surfaces before creating 2d maps
89
Acknowledgments: The support for this study was provided by the University of the Sunshine Coast. The
90
author gratefully acknowledges the support provided by Mr Luke Wenke in aiding for designing the 3D models
91
and animations for the study. The author is also thankful to Dr Uwe Terton for his suggestions about 3D models
92
and animations.
93
Conflicts of Interest: The author declares no conflict of interest.
94
References
95
1. Srivastava, S.K., Threshold concepts in geographical information systems: A step towards conceptual understanding.
96
Journal of Geography in Higher Education, 2013. 37(3): p. 367-384.
97
2. Chrisman, N.R., Calculating on a round planet. International Journal of Geographical Information Science,
98
2017. 31(4): p. 637-657.
99
3. Srivastava, S.K. and C. Tait, An activity-based learning approach for key geographical information systems (GIS)
100
concepts. Journal of Geography in Higher Education, 2012. 36(4): p. 527-545.
101
4. Tobler, W., A new companion for Mercator. Cartography and Geographic Information Science, 2017: p. 1-2.
102
5. Lapaine, M., Short History on Map Projections, in Choosing a Map Projection, M. Lapaine and E.L. Usery,
103
Editors. 2017, Springer International Publishing: Cham. p. 247-257.
104
6. Snyder, J.P. Map projections -- A working manual. 1987 U.S. Geological Survey Professional Paper 1395];
105
Available from: http://pubs.er.usgs.gov/djvu/PP/PP_1395.pdf.
106
7. Snyder, J.P., Flattening the earth: two thousand years of map projections. 1997: University of Chicago Press.
107
8. Iliffe, J., Datums and Map Projections: For remote sensing, GIS, and surveying. 2000, London: Whittles
108
Publishing.
109
9. Nyerges, T.L. and P. Jankowski, A knowledge base for map projection selection. Cartography and Geographic
110
Information Science, 1989. 16(1): p. 29-38.
111
10. Olson, J.M., Map projections and the visual detective: How to tell if a map is equal-area, conformal, or neither.
112
Journal of Geography, 2006. 105(1): p. 13-32.
11. Snyder, J.P. and H. Steward, eds. Bibliography of map projections. 2nd ed. 1997, USGS: Washington. 188.
114
12. Srivastava, S., Techniques for developing resources to understand geographic and projected coordinate systems.
115
Journal of Spatial Science, 2014. 59(1): p. 167-176.