Privacy Model for Anonymizing Sensitive Data in
Social Network
1.
N.Sowndhariya, 2. T.C.R.Jeyarathika, 3. P.Suganya, 4.P.Saranya
1
Information Technology, Saranathan College of Engineering ,Venkateswara Nagar, Panjappur,Trichy,Tamil Nadu
2,3,4
Computer Science,Shivani Engineering College, Poolangulathupatti, Tamil Nadu
Abstract- With the rapid growth of social networks, more researchers found that it is a great opportunity to obtain useful information from the social network data, such as the user behavior, community growth, disease spreading, etc. However, it is paramount that the published social network data should not reveal the private information of individuals. Recently, researchers have developed privacy models to prevent node reidentification through structure information. Even when these privacy models are enforced, an attacker may still be able to infer one’s private information if a group of nodes largely share the same sensitive labels (i.e., attributes), because the label-node relationship is not well protected by pure structure anonymization methods. Existing approaches, which rely on edge editing or node clustering, may significantly alter key graph properties. In our project, k-degree-l-diversity anonymity model is defined, that considers the protection of structural information as well as sensitive labels of individuals. Along with this, a novel anonymization methodology is proposed based on adding noise nodes into the original graph with the consideration of introducing the least distortion to graph properties. And, a rigorous analysis on the theoretical bounds on the number of noise nodes added and the effectiveness of the proposed technique is conducted.
Keywords:APL- Average Shortest path Length, ACSPL- Average Change of Sensitive Label Path length, CC- Clustering Coefficient, G- Original Graph, G’ - Published graph, KDLD- K- Degree L-Diversity, N- Number of nodes, P- Sensitive Degree sequence of G, RRTI- Remaining Ratio of Top Influential Users
I.INTRODUCTION
Data mining technology has emerged as a mean for identifying patterns and trends from large quantities of data. Data mining is a step in Knowledge Discovery in Database, which has been defined as “The nontrivial extraction of implicit, previously unseen, and potentially useful information from data”. Data mining is seen as an increasingly important tool by modern business to transform data into business intelligence giving an informational advantage. It is currently used in a wide range of profiling practices, such as marketing, surveillance, fraud detection, and scientific discovery.
1.1Process Of Data Mining
While large-scale information technology has been evolving separate transaction and analytical systems, data mining provides the link between the two. Data mining software analyzes relationships and patterns in stored transaction data based on open-ended user queries. Several types of analytical software are available: statistical, machine learning, and neural networks. Generally, any of four types of relationships are sought:
Classes: Stored data is used to locate data in predetermined groups. For example, a restaurant chain could mine customer purchase data to determine when customers visit and what they typically order. This information could be used to increase traffic by having daily specials.
Clusters: Data items are grouped according to logical relationships or consumer preferences. For example, data can be mined to identify market segments or consumer affinities.
Associations: Data can be mined to identify associations. The beer-diaper example is an example of associative mining.
Sequential patterns: Data is mined to anticipate behavior patterns and trends. For example, an outdoor equipment retailer could predict the likelihood of a backpack being purchased based on a consumer's purchase of sleeping bags and hiking shoes.
1.2Levels Of Analysis
Artificial neural networks: Non-linear predictive models that learn through training and resemble biological neural networks in structure.
Genetic algorithms: Optimization techniques that use processes such as genetic combination, mutation, and natural selection in a design based on the concepts of natural evolution.
Decision trees: Tree-shaped structures that represent sets of decisions. These decisions generate rules for the classification of a dataset. Specific decision tree methods include Classification and Regression Trees (CART) and Chi Square Automatic Interaction Detection (CHAID) . CART and CHAID are decision tree techniques used for classification of a dataset. They provide a set of rules that you can apply to a new (unclassified) dataset to predict which records will have a given outcome. CART segments a dataset by creating 2-way splits while CHAID segments using chi square tests to create multi-way splits. CART typically requires less data preparation than CHAID.
Nearest neighbour method: A technique that classifies each record in a dataset based on a combination of the classes of the k record(s) most similar to it in a historical dataset (where k 1). Sometimes called the k-nearest neighbor technique. Rule induction: The extraction of useful if-then rules
information is already stored in a database. Remember that
II.SYSTEM DESIGN 2.1 System Architecture
Fig.1 System Architecture
User Profile
Database
sharing data
User graph
Sensitive attributes
Adding Noise nodes
Increase or decrease node's
degree to achieve its target
Published graph
hide noise nodes preserve
APL
Convert the Original graph into K-degree l-diversity
Compute target
degree
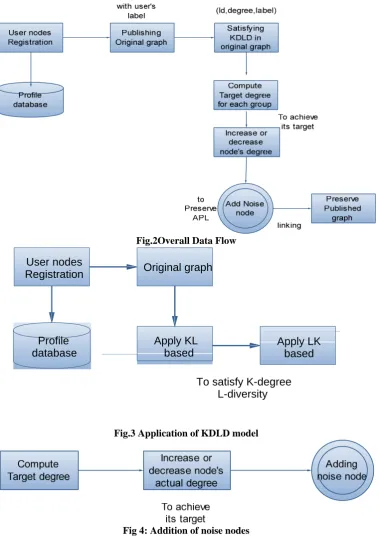
Fig.2Overall Data Flow
Fig.3 Application of KDLD model
Fig 4: Addition of noise nodes
2.2 Data Flow Diagram
A DFD is a structured analysis and design tool that can be used for flow charting process–oriented system. It is a network that describes the flow of data and changes through the system. The flow of the entire work is depicted in fig.2
Level 0:
As show in Fig.3, the users are registered with the network.A graph is published with users and their sensitive labels.KDLD model is applied on the original graph to
Level 1:
As depicted in Fig 4, while forming groups in KDLD model, a target degree is calculated for each group.Inorder to make all the nodes in the group to achieve the target degree, increase and decrease in degree occurs. There comes the addition of noise nodes.
Level 2:
The noise nodes are assigned with the labels and are connected to original nodes of the graph as shown in Fig5. Hence we preserve the APL in the published graph.
User nodes
Registration Original graph
Apply KL
based
Apply LK
based
To satisfy K-degree L-diversity Profile
L-K).
Change degrees to achieve its target degree.
Add Noise nodes to preserve APL and provide privacy.
3.1.1 User Registration And Sharing Information:
In Facebook and Linkedin, more and more researchers found that it is a great opportunity to obtain useful information from the social network data, such as the user behavior, community growth, disease spreading, etc.Users must be registered their own details as shown in fig. 6 to use the network and share information to others. So every user give their name, id, gender, mobile number,profession,salary etc as sensitive labels .After that users may want to share some data for several purpose. For eg:- to create awareness, entertainment, etc. By the users
Users find their friends and create the link between them with a distance in the network .As depicted in fig.7,a graph is constructed with the registered users using java universal network graph.The graph contains the individual’s id,label and degree information. From that graph ,adversary can infer peoples and try to get the sensitive labels and informations of the individuals in the graph. When publishing social network data, graph structures are also published with corresponding social relationships. As a result, it may be exploited as a new means to compromise privacy. A structure attack refers to an attack that uses the structure information, such as the degree and the subgraph of a node, to identify the node.
Fig.6 User registration
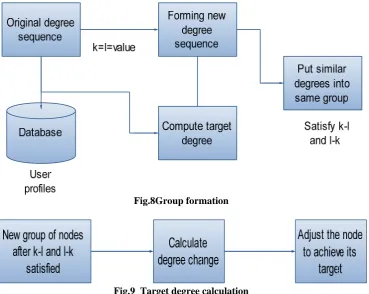
Fig.8Group formation
Fig.9 Target degree calculation
3.1.3 Group Formation And Compute Target Degree:
In the graph published, users are considered as nodes and their data are considered as degree. A two-step algorithm is designed to generate the KDLD graph which tries to preserve the above two key properties. In the first step, target degree is computed for each node as shown in Fig.8 so that it makes the original graph satisfy KDLD constraint with the minimum sum of degree change. Clearly, smaller degree change needs fewer noise edges to implement the change. In the second step,each node’s degree is changed to its target degree by adding noise edges/nodes. To prevent from node re-identification the original graph is changed into k-degree l-diversity. The algorithms(K-L and L-K) tend to put the nodes with similar degrees into the same group to reduce the degree changes. The nodes can be
merged into the current group until the l-diversity is satisfied.
3.1.4 Change Degrees To Achieve Its Target Degree:
Nodes with similar degrees and distinct labels are in same group. A node’s degree could be either increased or decreased. Target degree for each node is then calculated so that it makes the original graph satisfy KDLD constraint with the minimum sum of degree change. By comparing the old degree sequence with the new degree sequence, the degree change is calculated as explained in fig.9 To satisfy the k-degree l-diversity the node’s actual degree is adjusted to its target degree. The purpose is to obtain a new KDLD sequence from original graph so that the degree change of all the nodes in graph is as small as possible.
Fig .10 Publishing preserved graph
Degreechange
need noise node
Noise node
Label and
degree for
noise node
Connecting the
noise edges to
normal nodes
Protecting sensitive labels increase or
IV.CONCLUSION
As the original graph structure was prone to structure attacks, the k-degree- l-diversity model was proposed for publishing privacy preserving graph.In order to protect the graph property, a noise node adding algorithm was implemented to construct a new graph from the original graph with the constraint of introducing fewer distortions to
Graph-Based Data,” Proc. IEEE Seventh Int’l Conf. Data Mining Workshops (ICDM ’07), pp. 393-398, 2007.