Article
1
Salt stress induces non-CG methylation in coding regions
2of barley seedlings (Hordeum vulgare)
3Moumouni Konate1, Michael J. Wilkinson2, Benjamin T. Mayne3, Stephen M. Pederson4, Eileen S. 4
Scott5, Bettina Berger6, Carlos M. Rodriguez Lopez5,7* 5
1 Institut de l’Environnement et de Recherche Agricole (INERA), Station de Farako-Ba, 01 BP 910 Bobo-Dioulasso 01, 6
Burkina Faso; email: mouni.konate@gmail.com. 7
2 Pwllpeiran Upland Research Centre, Institute of Biological, Environmental and Rural Sciences, Penglais Campus, 8
Aberystwyth, Ceredigion, SY23 3FG, UK; email: mjw19@aber.ac.uk. 9
3 Robinson Research Institute, School of Medicine, The University of Adelaide, SA 5005 Australia; email: 10
benjamin.mayne@adelaide.edu.au. 11
4 Bioinformatics Hub, School of Agriculture, Food and Wine, Waite Research Institute, The University of Adelaide, 12
The University of Adelaide, SA 5005 Australia; email: stephen.pederson@adelaide.edu.au. 13
5 School of Agriculture, Food and Wine, Waite Research Institute, The University of Adelaide, Waite Campus, PMB 14
1, Glen Osmond, SA 5064, Australia; email: eileen.scott@adelaide.edu.au. 15
6 The Plant Accelerator, Australian Plant Phenomics Facility, School of Agriculture, Food and Wine, Waite Research 16
Institute, The University of Adelaide, Waite Campus, PMB 1, Glen Osmond, SA 5064, Australia; email: 17
bettina.berger@adelaide.edu.au. 18
7 Environmental Epigenetics and Genetics Group; Department of Horticulture, College of Agriculture, Food and 19
Environment, University of Kentucky, Lexington, KY 40546: carlos.rodriguezlopez@adelaide.edu.au. 20
21
* Correspondence: carlos.rodriguezlopez@adelaide.edu.au, Phone: +61 8 8313 0774; mjw19@aber.ac.uk, Phone: +44 22
(0) 1970 823204 23
24 25
26
Received: date; Accepted: date; Published: date 27
28
Abstract: Salinity can negatively impact crop growth and yield. Changes in DNA methylation are 29
known to occur when plants are challenged by stress and have been associated to the regulation of 30
stress-response genes. However, the role of DNA-methylation in moderating gene expression in 31
response to salt stress has been relatively poorly studied among crops such as barley. Here we assess 32
the extent of salt-induced alterations of DNA methylation in barley, and their putative role in 33
perturbed gene expression. Using Next Generation Sequencing, we screened the leaf and root 34
methylomes of five divergent barley varieties grown under control and three salt concentrations, to 35
seek genotype independent salt-induced changes in DNA methylation. Salt stress caused increased 36
methylation in leaves but diminished methylation in roots with a higher number of changes in leaves 37
than in roots, indicating that salt induced changes to global methylation are tissue specific. DMMs 38
were mostly located in close proximity to repeat elements but also 1094 genes, of which many 39
possessed GO terms associated with plant responses to stress. Identified markers identified have 40
potential value as sentinels of salt stress and provide a start point to understand the functional role of 41
DNA methylation in facilitating barley’s response to this stressor. 42
43
Keywords: Epigenetics, Differentially Methylated Markers (DMMs), leaves, roots, DNA methylation, 44
salinity stress, barley. 45
46
1. Introduction 47
Barley is an important crop for food, feed and brewing [1,2], and is used as a research model for 48
temperate cereals [3,4]. Although considered relatively tolerant to salinity [5], barley grown under saline 49
conditions often suffers substantial yield losses [6]. In recognition of a global increase in saline soils 50
worldwide [5], there are continuing efforts to improve the salt-tolerance of barley varieties to maintain current 51
levels of production. As with other plant species, barley responds to salt stress through the coordination of 52
processes that alleviate both osmotic stress and ion toxicity [7]. Acclimation to saline conditions requires the 53
stimulation of multiple molecular networks, including stress sensing, signal transduction, and the expression 54
of stress-specific genes and metabolites [3,7-9]. Modern genetic improvement strategies aimed at improving 55
salt tolerance require characterisation of genes activated in response to saline stress [10], and ideally, better 56
understanding of their interactions and of any plasticity in their expression afforded by epigenetic regulation 57
[11]. 58
Epigenetic mechanisms that control gene regulation act independently of any change to DNA sequence 59
[12-14], although one, DNA methylation, does alter its chemistry. The term DNA methylation describes the 60
addition of a methyl group onto a specific cytosine base in the DNA and this change often plays a critical role 61
in moderating gene expression [13,15,16]. Indeed, DNA methylation has been implicated in several critical 62
aspects of plant development and in regulating a plant’s adaptation to stress [13,17-20]. Change in DNA 63
methylation status can occur via de novo DNA methylation, which is generally associated with gene 64
repression, or by demethylation, which usually enhances gene expression [16], although numerous exceptions 65
to this rule are known [16,21,22]. There are several reasons for characterising changes to the global 66
methylation status of the genome that occur in response to a stress such as excessively saline soil. At the 67
simplest level, identifying salt-induced methylation changes to specific sites has potential to diagnose the 68
presence and level of salt stress experienced by roots, based solely on the methylation status of key 69
epimarkers. Salt concentration in saline soils varies on both spatial and temporal scales [23,24] and so 70
measuring the timing and extent of exposure of an individual plant can be difficult in field conditions. The 71
possibility of being able to characterise fine scale salt exposure of individual (sentinel) plants based on 72
changes to the methylome is therefore an attractive prospect, and one that may also facilitate ready 73
identification of genotypes exhibiting differential responses (e.g. avoidance, ion exclusion or tolerance). At 74
to salt stress provides a useful starting point from which to identify candidate genes that may be implicated 76
in plastic salt stress responses and to build broader understanding of the molecular mechanisms in play that 77
confer plant resilience to saline stress; something that has the potential to open up new avenues for crop 78
breeding [11]. 79
Several studies have demonstrated that exposure to salt stress can significantly perturb plant 80
methylation profiles [25-28]. Others have correlated stress-induced modifications to DNA methylation to 81
changes in gene regulation across a range of species [14,18,29,30], although some controversy remains over 82
the consistency of the DNA methylation sites described [28,31]. In general, most salt-induced changes to DNA 83
methylation seem to occur within or in proximity to known stress response genes [7,25,32,33]. In maize, 84
salinity induced de novo methylation to zmPP2C in roots but demethylation to zmGST in leaves, with both 85
changes seemingly linked to altered expression levels [34]. De novo methylation significantly repressed the 86
expression of zmPP2C in roots, whereas demethylation of zmGST enhanced its expression in leaves, implying 87
that DNA methylation changes in response to salt stress might contribute to stress acclimation [34]. In barley, 88
acute salt stress has been similarly shown to evoke methylation-modulated changes to the expression of 89
several genes involved in metabolic and physiological processes implicated in the plant's ability to cope with 90
the stress [3,9,35]. However, to date there has been a marked lack of reports linking salt-induced gene 91
expression to global changes in DNA methylation or of methylation-associated changes that apply across a 92
representative sample of any crop species [36]. 93
For food crops with large genomes, the use of wide Bisulfite sequencing to characterise genome-94
wide flux in methylation from a representative range of genotypes is effectively precluded by cost and the 95
complexity of bioinformatics [37]. For this reason, most works on stress-induced methylome change have 96
elected to either target particular loci [29,38] or else to survey only a subset of the genome. Of the many 97
methods available, Methylation Sensitive Amplification Polymorphism (MSAP) analysis has proved 98
particularly popular to study stress-induced changes to genome-wide methylation patterns [25,27,32], in part 99
because of the reproducible reputation of the technique [39-41]. However, the MSAP method only generates 100
relatively small numbers of anonymous markers [42,43] and so has limited utility for studies aiming to 101
establish links between changes in methylation and altered gene expression. While some works have sought 102
to overcome this limitation by targeted sequencing of MSAP amplicons [7,25,32,33], others have argued that 103
this amendment of the method is still cumbersome, costly and time-consuming [44]. The ability of Next 104
Generation Sequencing to analyse large numbers of loci in multiple methylomes in parallel provides the 105
opportunity to overcome these limitations. The use of methylation-sensitive GBS (ms-GBS) provides workers 106
with the possibility of identifying differentially methylated markers (DMMs) with a better depth and 107
coverage of the genome [44,45]. By using methylation-sensitive restriction enzymes to reduce genome 108
complexity during library preparation, differentially methylated fragments are produced and appropriate for 109
high throughput sequencing [44,45]. This approach presents the advantage of detecting methylated sites that 110
are dispersed across the genome, and is particularly appealing for species with a large genome such as barley 111
[44]. 112
In this study, we used ms-GBS to assess the level of salt-induced changes to methylation site distribution 113
patterns in roots and leaves of five diverse barley genotypes and match against the reference barley genome 114
to characterize the genomic locations of changed loci. We then combined these results with publicly available 115
data about the gene expression of barley roots under salt to postulate on the possible functional implications 116
of DNA methylation flux on gene regulation in barley under salt stress. 117
2. Results 118
2.1. Methylation-sensitive Genotyping-By-Sequencing (ms-GBS) 119
Overall, we generated in excess of 1 billion raw reads (1,015,703,602) from ms-GBS libraries, sequenced 120
on a HiSeq 2500. A high proportion of the raw reads passed the filter for the presence of the barcoded adapter, 121
the MspI restriction product site and the EcoRI adapter (1,004,318,258; 98.87%). However, when these reads 122
fell substantially to 496,960,365 reads (i.e. 49.48% of raw reads). This yielded an average of 2,484,801 high 124
quality reads per library and represented 892,859 unique sequence tags. Tags represented in this set amounted 125
to 31.56% of the MspI recognition sites (5`-CCGG-3`) estimated for the barley reference genome (2,828,642; 126
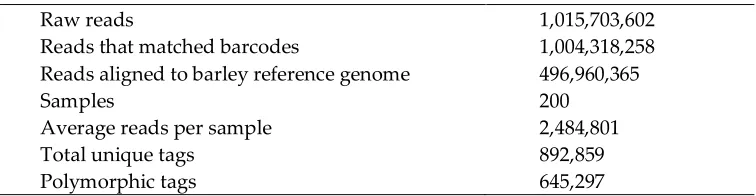
Table 1). 127
Table 1: Data yields of the ms-GBS, generated using the Illumina HiSeq 2500 platform. 128
Raw reads 1,015,703,602
Reads that matched barcodes 1,004,318,258
Reads aligned to barley reference genome 496,960,365
Samples 200
Average reads per sample 2,484,801
Total unique tags 892,859
Polymorphic tags 645,297
2.2. Salt-induced DNA methylation changes is tissue and concentration specific 129
In total, 24,395 and 3,777 unique sequence tags were deemed ‘significantly Differentially Methylated 130
Markers (DMMs)’ (FDR < 0.01) in leaf and root samples respectively across all five varieties and salt 131
treatments (Figure 1 and Figure 2a). Curiously, the overall number of leaf DMMs increased progressively 132
with salt concentration (75, 150 and 200 mM NaCl), whereas there was no such pattern seen in the roots 133
(Figure 1). Soil salt was found to induce more hypomethylated DMMs than hypermethylated DMMs in both 134
leaves and roots, regardless of concentration (Figure 1). Although the number of salt-induced DMMs was 135
higher in leaves (24,395 DMMs) than roots (3,777), the scale of the change evoked by salt stress was far higher 136
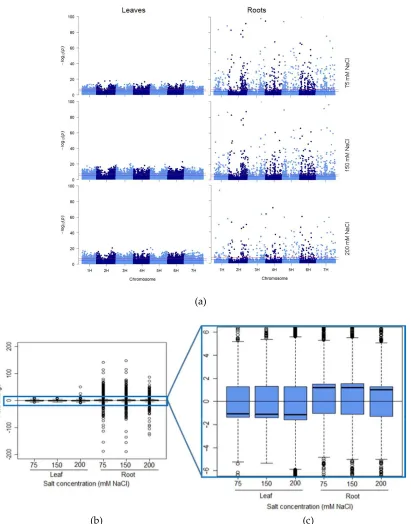
in roots for when measured by P-values (Figure 2a) and the fold-change in read counts (Figure 2b-c). 137
Comparison of the median fold-change of methylation across all markers in the two organs revealed that salt 138
induces net hypomethylation in roots and hypermethylation in leaves (Figure 2a-c), even though the number 139
of salt induced hypomethylated sites exceeds those of hypermethylated sites in both organs (Figure 1). 140
Figure 1: Number of salt-induced differentially methylated markers (DMMs) in barley leaves and roots.
141
Samples from barley plants exposed to 75, 150 and 200 mM NaCl were compared with salt-free control plant 142
samples. The red and blue sections in the bar chart represent the proportion of salt-induced hypermethylated 143
(red) and hypomethylated (blue) DMMs. DMMs were identified by comparing 25 samples per treatment, each 144
146
(a)
(b) (c)
Figure 2: Tissue-specific response intensity and directionality of salt-induced DNA methylation changes. (a)
147
Distribution of salt-induced epigenetic markers in the barley genome. Each point represents the genomic 148
location (horizontal axis) of a marker and its associated negative log10 P-value (vertical axis), for the three salt 149
treatments (75, 150 and 200 mM NaCl) in leaf and root samples compared with the control in the respective 150
tissue. The red line represents the genome-wide threshold (p = 5e-8); the blue line indicates the suggestive 151
threshold (p = 1e-5). (b, c) Directionality of the methylation in salt-induced DNA methylation markers. Boxplots 152
show the distribution of the intensity of changes in DNA methylation level, represented here as the fold-change 153
(2 power log2FC) in read counts between samples exposed to 75, 150 and 200 mM NaCl compared with those 154
grown in control condition, in leaves and roots. (c) Enlarged area shows the direction of the methylation flux 155
at a whole genome level in each tissue/salt treatment combination (i.e. positive medians indicate a global 156
decrease in DNA methylation (hypomethylation) while negative medians indicate a global increase in DNA 157
from 25 samples per salt treatment were compared with 25 control samples, and each treatment was composed 159
of five replicates of five barley varieties (Barque 73, Flagship, Hindmarsh, Schooner and Yarra). 160
2.3. Stability of salt-induced DMMs across treatments 161
We next surveyed the appearance of DMMs across treatments and organs. Only a small proportion 162
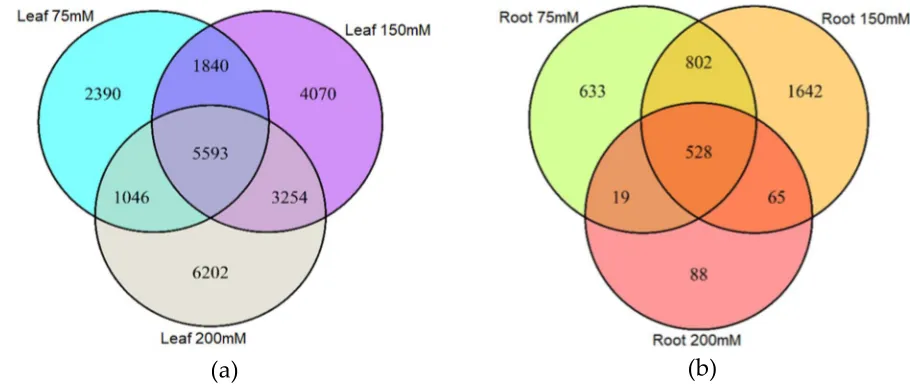
of DMMs appeared across all salt concentrations (Figure 3a-b). Moreover, of the 24,395 salt-induced 163
DMMs detected in leaf samples, 52% were specific to 75 mM, 150 mM or 200 mM NaCl (2,390, 164
4,070 and 6,202 respectively) (Figure 3a), implying a positive association between salt concentration 165
and the number of loci affected by methylation changes. In roots, there was no obvious relationship 166
with salt concentration, with 633, 1,642 and 88 salt-concentration-specific DMMs for 75 mM, 150 167
mM and 200 mM NaCl, respectively (Figure 3b) (62% of the total). 168
There were nevertheless many stable DMMs that appeared in all salt concentrations. These dose-169
insensitive DMMs accounted for 22.9% (5,593 of 24,395) of all salt-induced DMMs recovered from 170
leaves and 14% (528 of 3,777) of those recovered from roots (Figure 3a-b, Supplemental Data Set 171
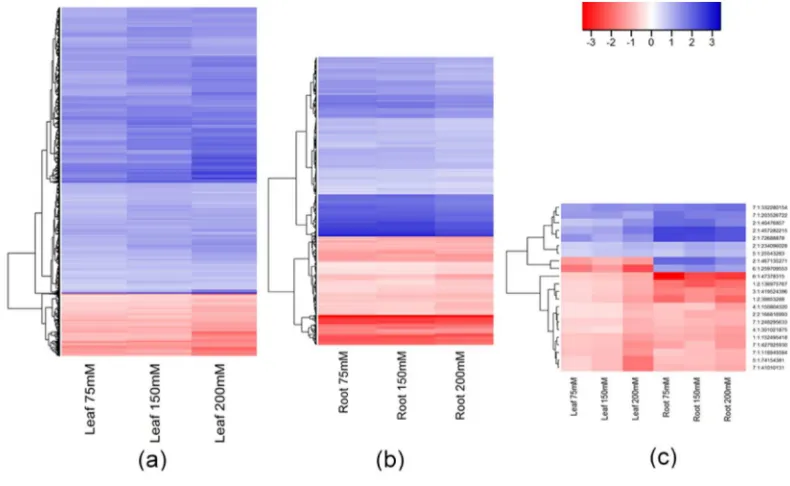
S1). These dose-insensitive DMMs invariably presented the same directionality of methylation 172
change across all concentrations (i.e. always hyper- or hypomethylated) (Figures 4a-b). The dose-173
insensitive DDMs followed the global trend (see above) and so mostly became hypomethylated 174
following salt exposure in both leaves (4744, 84.82%) and roots (329, 62.31%). Of these, just 22 175
were shared between leaf and root samples, most of which again became hypomethylated following 176
salt exposure (Figure 4c). Of these, 20 markers shared the same directionality of methylation change 177
following salt exposure between organs but two markers (“2:1:467135271” and “6:1:259709553”) 178
became hypermethylated in leaves but hypomethylated in roots following exposure to salt (Figure 179
4c). 180
181
(a) (b)
Figure 3: Venn diagram showing the number of differentially methylated markers (DMMs) induced 182
by different salt concentrations in barley leaves and roots. DMMs in leaves (a) and roots (b) were 183
obtained from barley plants exposed to 75mM, 150 mM and 200 mM NaCl, compared with a non-184
saline control. DMMs (FDR < 0.01) were identified by comparing 25 samples per treatment, each 185
composed of five replicates of five barley varieties. FDR, false discovery rate. 186
189
Figure 4: Hierarchical clustering of the fold changes in read counts of DMMs stable across all salt concentrations
190
(75, 150 and 200 mM NaCl) when compared to control plants. Hypermethylated (red) and hypomethylated 191
(blue) DMMs (a) in leaves (5593 DMMs); (b) in roots (528 DMMs); (c) shared by both leaf and root tissues (22 192
DMMs). Colour legend represent the fold-change (2 power log2FC) in read counts between samples exposed 193
to 75, 150 and 200 mM NaCl compared with those grown in control condition. DMMs (FDR < 0.01) were 194
identified by comparing 25 samples per treatment, each composed of five replicates of five barley varieties 195
(Barque 73, Flagship, Hindmarsh, Schooner, and Yarra). 196
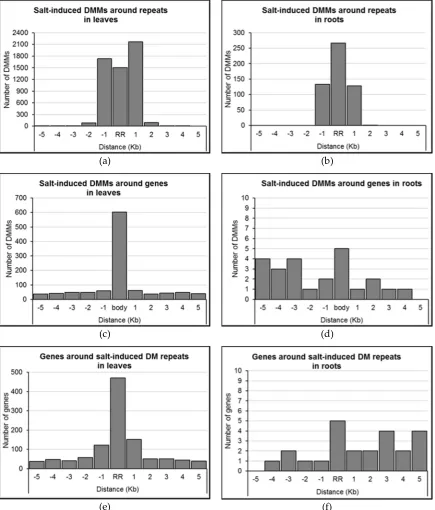
2.4 Distribution of salt-induced DMMs around annotated genomic features 197
We assessed the distribution of DMMs induced by 150 mM NaCl relative to annotated features of 198
the barley genome (e.g. protein coding genes, repeats, tRNAs etc). Proximity to a repeat sequence 199
appeared to be a strong predictor of the location of DMMs induced by salt. Indeed, 96.5 % of DMMs 200
induced by salt in leaves and 99.8% in roots occurred either within the repeats themselves or within 201
1 Kb of them (Figures 5a-b). 202
We next sought to identify genes positioned within the proximity of the dose-insensitive salt-induced 203
DMMs. The expression of these genes was considered most likely to be consistently influenced by 204
salt-induced methylation flux. In leaves, 19.1% (1070/5,593) of dose-insensitive DMMs were 205
located within 5 Kb of genes (Figure 5c; Supplemental Data Set S2), with the majority located within 206
the gene-body itself (56.4%, 603 DMMs; Figure 5c). In roots, just 24 (i.e. 4.5%) of the dose-207
insensitive DMMs lay within 5Kb of a gene, five of which were located within the gene-body, 14 208
were upstream and five were downstream (Figure 5d; Supplemental Data Set S2). Additionally, it is 209
worth mentioning that of the 22 dose-insensitive DMMs shared in leaves and roots (Figure 4c), only 210
one was positioned within 5 Kb of a gene (3994 bp upstream MLOC_63677 on chromosome 2H). 211
Given that the effect of DNA methylation on gene expression may depend on the position of the 212
change relative to the transcribed sequences [16,46], we further investigated DMM distance to 213
5`UTRs, 3`UTRs, and exons of differentially methylated genes in leaves and in roots. In leaves, it 214
appeared that salt-induced DMMs near 5`UTRs were most abundant within 1 Kb (277 DMMs) of 215
the 5`UTR in the downstream direction, with those falling between 1 and 2kb being the second most 216
common (120 DMMs; Figure 6a). Outside these windows, DMMs occurred in the range 40-65 217
DMMs per Kb (Figure 6a). DMMs were more common in the upstream direction of 3`UTRs, with 218
decreasing gradually to reach background levels (50-70 DMMs per KB) after 4 Kb (Figure 6b). In 220
comparison, there were insufficient gene-associated DMMs from root samples to provide strong 221
evidence of clustering around either the 5`UTRs or 3`UTRs. 222
The majority of DMMs within gene-bodies from leaf samples lay within exons (81.4%, 498 of 612; 223
Figure 6e). The remaining DMMs were generally within 1 Kb of an exon (Figure 6e). Three out of 224
the five gene-body DMMs from roots were similarly exonic or within 1Kb of the nearest exonic 225
region (Figure 6f). Considered collectively, gene-body DMMs were most commonly associated 226
with the first exons (57.5%; 355/617), and included 296 overlaps, 45 downstream and 14 upstream 227
(Figure 6ef). Additionally, there were 41 DMMs from leaves and two DMMs from roots DMMs 228
that clustered around tRNA genes (Figure 6gh). While only one DMM overlapped with a tRNA in 229
leaves, 14 out of the 41 DMMs were within 1 Kb upstream (nine DMMs) and downstream (five 230
DMMs) of a tRNA gene (Figure 6g). The two DMMs nearest tRNA genes in roots were located 231
within 1 and 4 Kb downstream of the gene respectively (Figure 6h). 232
(a) (b)
(c) (d)
(e) (f)
Figure 5: Distribution of salt-induced differentially methylated markers (DMMs) around repeat regions and
234
genes. (a, b) distribution of DMMs distance from the closest repeat in leaves and roots, respectively; (c, d) 235
distribution of DMMs distance from the closest gene in leaves and roots, respectively; (e, f) distribution of 236
genes’ distance from the closest differentially methylated (DM) repeats in leaves and roots, respectively. The 237
distance of each DMM was calculated to the genomic feature, and DMMs were counted within repeats and 238
genes, and five consecutive 1 Kb wide bins upstream and downstream. DMMs induced by 150 mM NaCl were 239
used to show DMM distribution pattern around genomic features. body, gene-body. RR, repeat region. 240
(a) (b)
(c) (d)
(e) (f)
Figure 6: Distribution of salt-induced differentially methylated markers (DMMs) around UTRs, exons and
242
tRNA genes. (a, b) 5`UTRs and 3`UTRs in leaves; (c, d) 5`UTRs and 3`UTRs in roots; (e) exons in leaves; (f) 243
exons in roots; (g) tRNA genes in leaves; (h) tRNA genes in roots; The distance of each DMM was calculated to 244
the genomic feature (respectively, 5`UTR 3`UTR, exons and tRNA genes), and the number of DMMs was 245
counted within these genomic features, and in five consecutive 1 Kb wide bins upstream and downstream. Kb, 246
kilo base pair. DMMs induced by 150 mM NaCl were used to show DMM distribution pattern around genomic 247
features. 248
249
2.5. Gene ontology analysis of salt-induced DMMs 250
Gene Ontology (GO) analysis was performed for all differentially methylated genes (i.e. within 5kb 251
of a salt-induced DMM) from both leaves and roots. The 1,070 DM genes identified from leaves 252
included 1,017 that were hypomethylated and 53 hypermethylated following salt exposure. These 253
genes yielded 433 and 99 high level GO terms, for the hypomethylated and hypermethylated 254
groups respectively (Table 1). The top five function groups retrieved from the hypomethylated 255
genes in leaves were the “protein modification process”, “cellular amide metabolism”, “cell cycle” 256
and “negative regulation of signal transduction” (Figure 7a, Supplemental Data Set S3). 257
Hypermethylated genes were enriched with GO terms that associated with “organophosphate 258
biosynthesis”, “peptide metabolism”, “peptide metabolism transport chain”, “generation of 259
precursor metabolites and energy”, and “photosynthesis” (Figure 7b, Supplemental Data Set S3). 260
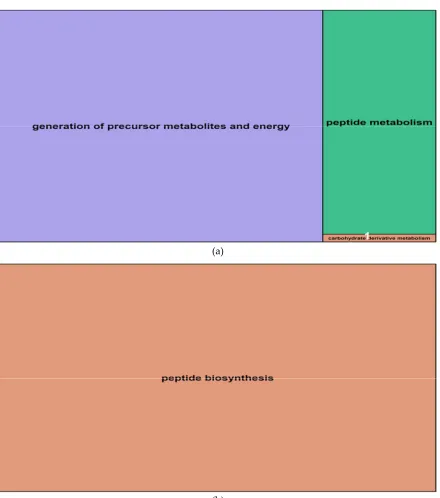
In roots, salt-induced hypomethylated markers were associated with 15 genes whereas 261
hypermethylated DMMs were in or proximal to nine genes. These genes were significantly 262
enriched for 29 (hypomethylated) and 24 (hypermethylated) GO terms (Table 2). The GO terms 263
derived from hypomethylated genes in roots fell into three main function groups: “generation of 264
precursor metabolites and energy”, “peptide metabolism” and “carbohydrate derivative 265
metabolism” in this order (Figure 8a, Supplemental Data Set S3). Hypermethylated genes enriched 266
GO terms that were related to one main biological function: “peptide biosynthesis”. The details 267
concerning all GO terms enriched by differentially methylated genes in roots are listed in 268
Supplemental Data Set S3. 269
These GO terms, enriched from differentially methylated genes, give an indication of the biological 270
pathways which activity might be modified in response to salinity. Some GO terms, although not 271
dominant, related to functions essential for plant responses to salt stress, such as “ion 272
transmembrane transport”, “potassium ion transport”, “cation transmembrane transporter activity”, 273
“response to osmotic stress, “response to chemical stimulus”, “oxidation-reduction process”, 274
“regulation of innate immune response”, “cellular response to stress”, “defence response”, among 275
others (Supplemental Data Set S3). 276
277
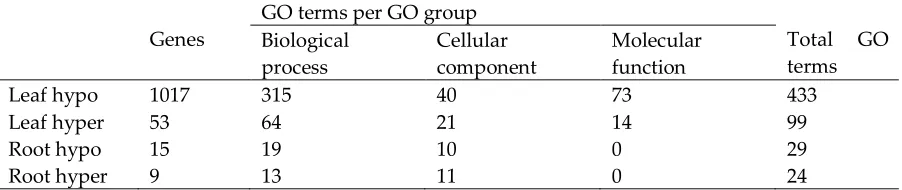
Table 2: Number of genes differentially methylated and associated GO terms in barley leaves and roots. GO,
278
gene ontology; hypo, hypomethylated genes; hyper, hypermethylated genes. GO groups were determined 279
using REVIGO (http://revigo.irb.hr/). 280
Genes
GO terms per GO group
Total GO terms Biological
process
Cellular component
Molecular function
Leaf hypo 1017 315 40 73 433
Leaf hyper 53 64 21 14 99
Root hypo 15 19 10 0 29
Root hyper 9 13 11 0 24
(a)
(b)
Figure 7: Summary treemaps of GO (gene ontology) term representatives for the category “biological process”
282
obtained from salt-induced differentially methylated genes in barley leaves. (a) Representatives of GO terms 283
enriched by hypomethylated genes in leaves; Numbers represent GO term representatives with very small font 284
size: 1 = organelle organization; 2 = vegetative to reproductive phase transition of meristem; 3 = generation of 285
precursor metabolites and energy; 4 = coenzyme metabolism; 5 = photosynthesis; and 6 = microtubule-based 286
process, sulfur compound metabolism, mitotic cell cycle process, plant-type cell wall organization or 287
biogenesis, organic hydroxy compound metabolism, in order. (b) Representatives of GO terms enriched by 288
hypermethylated genes in leaves; 7 = monovalent inorganic cation transport; 8 = macromolecular complex 289
The detailed list of terms in the background of GO representatives is provided in the Supplemental Data Set 291
S3. 292
(a)
(b)
Figure 8: Summary treemaps of GO (gene ontology) term representatives for the category “biological process”
293
obtained from salt-induced differentially methylated genes in barley roots: (a) Representatives of GO terms 294
enriched by hypomethylated genes in roots; 1 = carbohydrate derivative metabolism; (b) Representative of GO 295
terms enriched by hypermethylated genes in roots. Treemaps were constructed using R scripts produced by 296
the REVIGO server (http://revigo.irb.hr/). The detailed list of terms in the background of GO representatives is 297
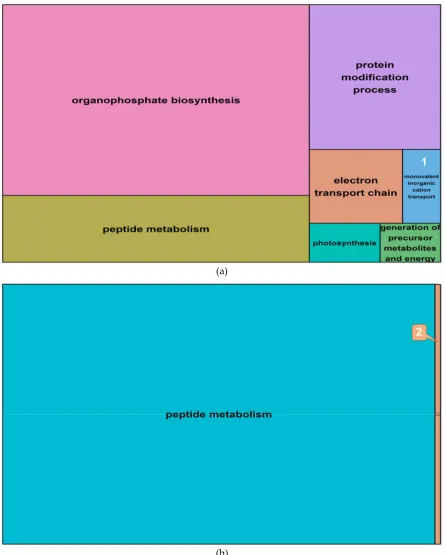
2.6. Differentially expressed genes in barley roots 299
To investigate whether observed changes in DNA methylation could be associated to changes in gene 300
expression, salt-induced DMMs were compared to publicly available gene expression responses to 301
salt exposure. These datasets related to two genotypes (Sahara and Clipper) and included four 302
biological replicates of each variety (see material and methods). Differential gene expression 303
between salt treatments revealed 124 upregulated and 34 downregulated transcripts (Supplemental 304
Data Set S4), among which 76 and 18 transcripts, respectively, matched barley reference genes in 305
the public database “Ensembl” (http://plants.ensembl.org/biomart/martview). Ontology of these 306
annotated genes revealed many pathways that were regulated by salinity in barley roots. The top five 307
gene representatives of significantly enriched GO terms in upregulated genes were “organophosphate 308
biosynthesis”, “peptide metabolism”, “protein modification process”, “electron transport chain”, 309
“monovalent inorganic cation transport” and “photosynthesis” (Figure 9, Supplemental Data Set S4). 310
Downregulated genes enriched GO terms which clustered around the functional pathway “peptide 311
metabolism” and to a small extent, around “generation of precursor metabolites and energy”. 312
We then cross-referenced the differentially expressed genes against DMMs identified in the current 313
study. This was achieved by searching for DE genes within 5 Kb of DMMs. There were no 314
differentially methylated genes amongst DE genes with a false discovery rate (FDR) below 5%, and 315
so we extended the gene list by reducing the stringency of the FDR cut-off to 10%. With this setting, 316
seven DE genes were found to be differentially methylated, one of which contained two DMMs 317
(MSTRG.43260, one hypo- and one hypermethylated) (Table 4). However, there was no correlation 318
between gene methylation status and the direction of gene expression. Some hypomethylated genes 319
were downregulated whereas others were upregulated; and vice versa for hypermethylated genes 320
(Table 4). Only four of these differentially methylated transcripts matched with annotated barley 321
genes in public databases. Gene ontology of these genes revealed that hypomethylated and 322
hypermethylated genes enriched functionally close GO terms, which were all related to cellular 323
components: plastid, cytoplasmic part and intracellular membrane-bounded (Supplemental Data Set 324
S4). 325
326
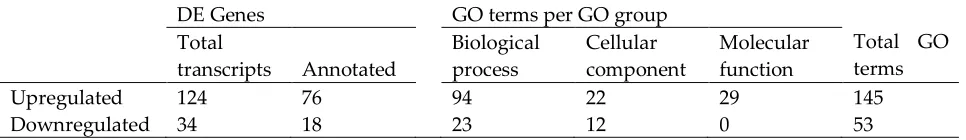
Table 3: Number of genes differentially expressed (DE genes) and associated GO terms in barley 327
roots. GO, gene ontology; GO groups were determined using REVIGO (http://revigo.irb.hr/). 328
DE Genes GO terms per GO group
Total GO terms Total
transcripts Annotated
Biological process
Cellular component
Molecular function
Upregulated 124 76 94 22 29 145
Downregulated 34 18 23 12 0 53
(a)
(b)
Figure 9: Summary treemaps of GO (gene ontology) term representatives for the category “biological process”
331
obtained from salt-induced differentially expressed genes in barley roots. (a) Representatives of GO terms 332
enriched by upregulated genes in roots; 1 = monovalent inorganic cation transport; (b) Representatives of GO 333
terms enriched by downregulated genes in roots; 2 = generation of precursor metabolites and energy. Treemaps 334
were constructed using R scripts produced by the REVIGO server (http://revigo.irb.hr/). The detailed list of 335
Table 4: List of differentially methylated DE genes in barley roots. DE, differentially expressed gene; DMM, differentially methylated markers, Chrom, chromosome; FDR, false discovery rate; dist2Gene, DMM position relative to gene.
DE Genes DMMs Statistics
Annotation
GeneID Range Chrom Position Methylation logFC P.Value FDR dist2Gene
MSTRG.4246 1:435681474-435731845 1H 435689351 hyper -1.76 0.000 0.053 0 -
MSTRG.31525 5:507135444-507397451 5H 507332872 hypo -1.47 0.002 0.083 0 MLOC.2917
MSTRG.43260 7:427906474-427974581 7H 427925930 hyper -1.05 0.006 0.093 0 MLOC.73155
MSTRG.43261 7:427906474-427974581 7H 427948871 hypo -1.05 0.006 0.093 0 MLOC.73155
MSTRG.10572 2:543673444-543674117 2H 543678039 hypo -1.05 0.006 0.095 3922 -
MSTRG.6485 2:17425326-17624569 2H 17517122 hypo 1.39 0.007 0.095 0 -
MSTRG.6418 2:15418194-15419914 2H 15414469 hypo 1.53 0.004 0.089 3725 MLOC.24124
17 of 30
3. Discussion 1
A growing number of studies highlight the role of DNA methylation in coordinating the 2
adaptive response of plants to stress [14,30,31]. The primary challenge, particularly for crops 3
with large genomes, resides in assembling a genome-wide picture of the role of methylation 4
in orchestrating the molecular response to the stressor. As with the study of other stresses, 5
works on methylation-based responses to salt stress have therefore largely relied on low 6
throughput targeted approaches, low genome coverage or anonymous markers applied to a 7
low number of genotypes [7,25-27,33,47]. However, our use here of methylation sensitive 8
Genotyping-By-Sequencing (ms-GBS) to study salt-induced changes to in DNA methylation 9
in mCCGG contexts has allowed us to survey methylome flux across a reasonably 10
representative portion of the genome (Figure 2). Application of this approach allowed us to 11
characterize genotype independent salinity-induced methylation flux in both leaf and root 12
samples, and then to relate the pattern of Differentially Methylated Markers to specific 13
genomic features. 14
Consistency of salt-induced DMMs
15
Of the salt-induced DMMs identified in all barley genotypes, 23% and 14% were dose-16
insensitive (and so conserved) across all salt treatments in leaves and roots respectively, with 17
the remaining markers being either concentration-specific or shared between two salt 18
treatments (Figure 3a-b). The prevalence of concentration-specific DMMs in barley leaves 19
(52%) and roots (62%) (Figures 3a-b) could imply that these DMMs occur stochastically, 20
consistent with observations in previous studies [25,28]. However, all DMMs described here 21
were conserved across all five diverse barley genotypes and five biological replicates (per 22
variety), with the direction of salt-induced methylation flux being conserved in all cases. This 23
element of the experimental pipeline was introduced to minimize the effect of stochastic 24
noise and was intended to strongly enrich for conserved responses to salt stress. There are 25
several aspects of the resulting data to suggest that this action did uncover at least some 26
consistent epimarks of salt exposure. At a simplistic level, the progressive increase in the 27
number of leaf DMMs as the salt concentration increased could be taken as suggestive of an 28
incremental response as the salt concentration rises. This pattern would appear to accord with 29
the established theory that a large number of DMMs only become activated above a threshold 30
concentration of salt, as hypothesized by Soen and co-workers [48]. Following this reasoning, 31
as the salt concentration increases, so more thresholds are exceeded and so more DMMs 32
become recruited into the global methylation flux. In this way DMM abundance increases 33
proportionally to the salt concentration. However, it is important to note that the use of only 34
three concentration points in the titration series provides somewhat limited scope for 35
confidence and that this pattern was not repeated among the root materials. Greater 36
confidence can be taken from examining the 22% (6,121/28,172) of DMMs that were 37
conserved across all salt concentrations. The fact that these dose-insensitive DMMs 38
invariably exhibited the same directionality of methylation change across all concentrations 39
(i.e. always hyper- or hypomethylated) despite differing between DMMs is compelling 40
evidence that most are truly salt-induced DMMs that appear across diverse genotypes and 41
18 of 30
Salt induces different changes to the DNA methylation of leaves and roots
43
The vast majority of salt-induced, dose-insensitive DMMs were also organ-specific (Figure 44
3). One plausible explanation for the relative paucity of DMMs shared between roots and 45
leaves can be taken from the ability of the crop to effectively compartmentalize excess Na+ 46
in the roots and inhibiting its transport to the leaves [49]. This response gives rise to very 47
different Na+ environments in the two organs, with Na+ concentrations being far higher in 48
the roots than the shoots. We reason that the dose-insensitive DMMs identified in the present 49
study are all likely to response to low salt thresholds, and so appear in all salt treatments 50
across the titration. However, because the internal Na+ environments are very different 51
between roots and leaves [50], the dose-insensitive DMMs found in the two organs are highly 52
likely to have very different induction thresholds (presumably higher in the roots). Viewed 53
in this way, it is unsurprising that the abundance and scaling of leaf and root DMMs were so 54
different, and that so few dose-insensitive DMMs were shared by both organs. Indeed, this 55
divergence is in accordance with the known physiological response of the species to saline 56
exposure of the roots, and implies that both sets of DMMs would therefore provide a robust 57
indication of exposure to salt. Certainly, it has been widely reported that salinity imposes 58
extensive, genome-wide modification of the DNA methylation patterns, with more 59
methylation changes being reported in leaves when compared with roots [25-27,33,50-53]. 60
This trend accords with the finding here of a higher number of stable salt-induced DMMs in 61
leaves than in roots (5,593 vs. 528 DMMs respectively; Figures 1 and 3). In rice, about 50% 62
of CCGG site methylation were altered under salt stress in leaves, whereas less than 15% 63
changed in roots [25]. Taken at face value, the detection of more salt-induced methylation 64
changes in leaves than in roots appears counterintuitive, since roots are the primary organ of 65
contact with the salt stress. That said, the scale of the change in methylation was greater in 66
roots than in leaves (Figure 2), suggesting that although salt evokes change in fewer loci, the 67
effect on these sites is greater. Provided these changes are associated with concurrent changes 68
to expressions of key genes involved with responses to salt stress, these observations can 69
accommodate root-specific epigenetic responses to saline environments, while plants are 70
undergoing osmotic stress and salt toxicity [8,54]. Should at least one of these processes be 71
focused on repressed transport of Na+, then more mild ion accumulation in the leaves will 72
slowly increase stress [5,55] at a lower level because of ‘leakiness’ of the system, evoking a 73
widespread but more measured response. 74
Previous studies have reported that the overall level and direction of methylation flux in 75
response to salinity varies according organ types, with a tendency towards hypomethylation 76
in roots and hypermethylation in leaves [7, 25-27,33,47]. Similarly, we found that that salt 77
induces net hypomethylation in roots and hypermethylation in leaves (Figure 2a-c). However, 78
the proportion of de novo methylation and demethylation events varied in the same manner 79
in both roots and leaves, with a prevalence of hypomethylated events in both organs, albeit 80
at different frequencies (Figure 1). It is possible that divergence between our findings and 81
those of previous studies [7, 25-27,33,47] may simply be a feature of the crop. However, it 82
is also possible that the trend towards hypomethylation is a more general one and our findings 83
diverge because of methodological differences in the present work such as 1) the high-84
19 of 30
selecting DMMs (FDR < 0.01), and 3) the diversity of barley varieties used in this study, to 86
account for genotype-dependent DNA methylation [25-27]. Most studies of salt-induced 87
DNA methylation have relied on MSAP analysis of a single variety to assess flux in DNA 88
methylation [7, 25-27,33,47]. However, MSAP generates anonymous markers and lacks 89
resolution in showing whether there is a gain or loss of methylation in markers [42]. 90
91
Beside organ-specific methylation levels, there was a progressive increase in both the salt 92
concentration and the abundance of salt-related DMMs in leaves, but not in roots (Figure 1). 93
This gradual additive response to salt stress in leaves is concordant with a previous study, 94
showing that salt concentrations correlated with differential DNA methylation in rapeseed 95
[33]. Roots seemingly lacked this relationship, possibly because of the low number of loci 96
involved but possibly also because DNA fragments naturally at high salt concentrations 97
[33,56-58] affecting the effectiveness of the msGBS approach. DNA degradation may have 98
occurred at salt concentrations above 150 mM NaCl, leading to a decrease in salt-induced 99
DMMs in roots. High salinity-induced DNA fragmentation have previously been reported in 100
Arabidopsis [56], onion [57], rapeseed [33] and barley [58], suggesting that this is not an 101
isolated phenomenon. Resolution of these alternatives requires further investigation. 102
Salt-induced changes in DNA methylation may influence gene regulation
103
DNA methylation is modulated in the genome in three ways: de novo methylation 104
(hypermethylation), methylation maintenance, and methylation removal (hypomethylation) 105
[59]. Modification of DNA methylation in response to stress is hypothesised to be at least 106
partially directed to specific genomic regions where DNA methylation status influences the 107
expression of stress-response genes [18,30,60,61]. Our results provide limited support for 108
this assertion. We found salt-induced DMMs in barley primarily clustered around repeat 109
regions (Figure 5ab) but also some genes (Figure 5cd), with most DMMs occurring within 1 110
Kb of repeats and within gene-bodies. Overall, we found that dose-insensitive salt-induced 111
DMMs appear more common in sites that could facilitate perturbation in the expression of 112
genes that hypothetically could be part of a molecular response to salinity, as reported 113
elsewhere [61]. There is evidence from previous studies suggesting that salt-induced DMMs 114
can play an important role in evoking metabolic differences between seedlings growing under 115
control and saline conditions [25,26,29,34,60-62], although the markers found in these works 116
were either few in number or else identified from a single genotype. The provision here of a 117
robust list of consistent salt-responsive DMMs therefore provides a useful starting point from 118
which to gather a more holistic picture of DNA methylation-mediated regulation of molecular 119
responses to salt exposure. 120
121
Proof of a functional link between change of methylation status in these DMMs and 122
associated alteration in the expression of proximal stress response genes is beyond the scope 123
of the current study. Nevertheless, there are several grounds for reasoning that at least some 124
of the markers identified here will indeed be functionally important. Certainly, others have 125
argued that the close proximity of DMMs relative to the target genes is at least one 126
requirement for such a relationship [19,63-65]. Viewed in this context, the observed 127
20 of 30
consistent with salt-induced DMMs mediating a functional response to the stress. Others have 129
shown a high frequency of salt-induced DMMs in gene extremities (towards 5`UTR and 130
3`UTR) can influence gene regulation through 5`UTRs’ and 3`UTRs’ closed-loop regulation 131
systems, which generate inactive transcripts [66,67]; or through independent gene regulation 132
by each UTR type [68]. Karan et al. [25] similarly observed that salt-induced DNA 133
methylation changes generally occurred in exon and UTR regions and could affect diverse 134
biological functions in the plant. There is also a strong body of evidence suggesting that gene-135
body methylation in general can affect gene expression [19,54,64], by enhancing or inhibiting 136
transcription and translation processes [67,68]. 137
138
It has been claimed that, of all cytosine contexts, only mCG methylated occurs within gene-139
bodies [64,69-71]. Ours and previous results [72] do not support this stance, with non-CG 140
methylation such as mCCGG found frequently in transcribed regions from DNA isolated from 141
both leaves and roots of barley (Figure 5cd). It is, however, still open to question whether 142
these markers, like mCG, play a role in regulating gene expression [73]. We also observed 143
salt-induced DMMS associated with tRNA genes (Figure 6d), perhaps inviting further study 144
of the suggestion of a role for methylation dependent regulation to support the RNA quality 145
control system and protein synthesis [74-76]. 146
Salt-induced DMMs correlate with stress related genes
147
There is circumstantial support to argue that at least some of the DMMs identified here may 148
play a functional role in the expression of salt-response genes. Salt stress in barley alters the 149
expression pattern of genes involved in a diverse range of physiological and regulatory 150
pathways [3,9]. Given that salt-induced DMMs have the potential to regulate gene 151
expression, the functions of differentially methylated genes were explored for possible 152
correlations with stress responsive genes. The correlation of DM genes with GO terms that 153
are related to plant responses to stress, such as “negative regulation of signal transduction”, 154
“photosynthesis”, “response to osmotic stress” and “ion transmembrane transport”, is at least 155
consistent with the possibility that salt-induced DMMs target genes could play active 156
functions in the plant’s response to salt, and in broad accordance with previously expression 157
studies of salt response [29,77-79]. In addition, some of the DM genes identified here were 158
enriched for GO terms such as hydrolase activity, oxidoreductase activity, nucleic acid 159
binding, and translation factor activity (Figure 7; Supplemental Data Set S3). This agrees 160
with similar reports of differentially methylated genes associated with salt stress in rice 161
[25,26]. This concordance of DM gene idententity between species could be taken to imply 162
that a functional role is more likely. The present study also revealed differential DNA 163
methylation of genes implicated in organophosphate biosynthesis (Figure 7). Should the 164
change in methylation state alter expression of this gene, it would accord with previous 165
studies showing that salt stress induces an increase of the amount of intra-cellular 166
organophosphate solutes such as di-myo-inositol-phosphate, Inositol (1,4,5) trisphosphate, 167
b-mannosylglycerate, b-mannosylglycerate and Glutamate [80,81]. Furthermore, it was 168
reported that salinity induced inorganic phosphate toxicity when Pi exceeds 0.10 mM in the 169
substrate [82,83]. This salt-induced phosphate toxicity may arise from excess of phosphate 170
21 of 30
solutes [81,82]. However, it is important to recognise that the presence of DMMs near a gene 172
may be an indication of responsiveness to salt stress, but not provide sufficient evidence of a 173
functional role of DNA methylation in the regulation of the gene [21,65]; gene expression 174
analysis is required to assess the link between DNA methylation and gene activity under salt 175
stress. 176
177
Difficulty in extrapolating a functional link is highlighted by the fact that only seven of the 178
genes previously reported to be differentially expressed in roots [3] were also differentially 179
methylated under salt stress here (FDR < 10%, Table 4). This result may imply that few of 180
the marks found here are functionally important or alternatively be attributable the use of 181
different biological samples for methylation profiling and gene expression analyses, different 182
growing conditions [3], to the partial coverage of the barley reference genome used here [4] 183
or to the possibility of biased by salt-induced DNA degradation [33,56-58]. 184
Conclusions
185
To our knowledge, this study has provided the most comprehensive set of robust leaf and 186
root epimarkers to indicate the exposure of barley to salt stress. These markers were 187
conserved in both identity and direction across five diverse genotypes, biological replicates 188
and all salt concentrations used. The leaf markers have potential value as epigenetic sentinels 189
of the exposure of individual plants to soil salt stress. Viewed collectively, the root and leaf 190
markers provide a useful start point from which to assemble a more comprehensive picture 191
of the functional role of DNA methylation in facilitating the plastic molecular response of 192
barley to this important stressor. 193
194
4. Materials and Methods 195
4.1. Plant material and stress treatment
196
Five diverse spring barley varieties were used in this investigation: Barque 73, Flagship, 197
Hindmarsh, Schooner and Yarra. Seeds were kindly provided by the Salt Focus Group at the 198
Australian Centre for Plant Functional Genomics (ACPFG, Adelaide, South Australia). The 199
experiment was designed in randomized blocks of five replicates and four salinity treatments: 200
control (0), 75, 150 and 200 mM NaCl. 201
Seeds were germinated, and seedlings grown in 3.3 L free-draining pots, placed on saucers, 202
containing 2915 g of growth substrate (50% UC (University of California at Davis) potting 203
mix, 35% coco-peat, and 15% clay/loam (v/v)). The five barley varieties were sown per pot 204
and variety positions were randomized in each pot to minimize block effect. Two seeds were 205
sown per variety and thinned to one seedling 8 days after sowing. Salinity treatments were 206
applied 10 days after sowing in four increments over 4 consecutive days, to minimise osmotic 207
shock [84]. The required amount of NaCl for each salt concentration was calculated based 208
on the substrate soil dry weight and the target gravimetric water content of 16.8% (g/g) [84]. 209
At the time of salt application, the water content reached 26.4% and dropped down to the 210
final concentration through evapotranspiration. Pots were watered to weight every 2 days to 211
22 of 30
This experiment was conducted from 30th January to 20th February 2015, in a greenhouse at 213
the Waite campus, University of Adelaide, South Australia (34°58'11"S, 138°38'19"E). The 214
seedlings were grown under natural photoperiod and temperature was set at 22°C/15°C 215
(day/night). 216
4.2. DNA extraction
217
At day 11 after the first salt stress imposition to barley seedlings (21 days after sowing, three 218
leaves stage), 50 mg samples were collected from middle sections of the 3rd leaf blades and 219
roots. In total, 200 samples were collected (five varieties, four treatments and two tissue 220
types), and were snap frozen in liquid nitrogen, then stored in a -80℃ freezer until needed 221
for DNA extraction. Prior to DNA extraction, frozen plant material was disrupted in a bead 222
beater (2010-Geno/Grinder, SPEX SamplePrep®, USA). Genomic DNA was isolated using 223
a Qiagen DNeasy kit following the manufacturer’s instructions. DNA samples were then 224
quantified in a NanoDrop® 1000 Spectrophotometer (V 3.8.1, ThermoFisher Scientific Inc.; 225
Australia) and concentrations were standardized to 10 ng/µl for subsequent ms-GBS library 226
preparation. 227
4.3. Methylation Sensitive genotyping by sequencing (ms-GBS)
228
The methylation-sensitive genotyping by sequencing (ms-GBS) was performed using a 229
modified version [44,45] of the original GBS technique [85,86]. Genomic DNA was digested 230
using the combination of a rare cutter, EcoRI (GAATTC), and a frequent, methylation 231
sensitive cutter MspI (CCGG). Each sample of DNA was digested in a reaction volume of 20 232
µl containing 2 µl of NEB Smartcut buffer, 8U of HF-EcoRI (High-Fidelity) and 8 U of MspI 233
(New England BioLabs Inc., Ipswich, MA, USA). The reaction was performed in a BioRad 234
100 thermocycler at 37℃ for 2 hours, followed by enzyme inactivation at 65℃ for 10 min. 235
Then, the ligation of adapters to individual samples was achieved in the same plates by adding 236
0.1 pmol of the respective barcoded adapters with an MspI cut site overhang, 15 pmol of the 237
common Y adapter with an EcoRI cut site overhang, 200 U of T4 Ligase and T4 Ligase buffer 238
(NEB T4 DNA Ligase #M0202) in a total volume of 40 µl. Ligation was carried out at 24℃ 239
for 2 hours followed by an enzyme inactivation step at 65℃ for 10 min. 240
DNA samples were allocated to plates, 81 samples each, including the negative control water. 241
Prior to pooling plate samples into a single 81-plex library, the ligation products were 242
individually cleaned up to remove excess adapters using an Agencourt AMPure XP 243
purification system (#A63880, Beckman Coulter, Australia) at a ratio of 0.85 and following 244
the manufacturer’s instructions. Individual GBS libraries were produced by pooling 25 ng of 245
DNA from each sample. Each constructed library was then amplified in eight separate PCR 246
reactions (25 μl each) containing 10 μl of library DNA, 5 μl of 5x Q5 high fidelity buffer, 247
0.25 µl polymerase Q5 high fidelity, 1 μl of each Forward and Reverse common primers at 248
10 μM, 0.5 µl of 10 μM dNTP and 7.25 µl of pure sterile water. PCR amplification was 249
performed in a BioRad T100 thermocycler consisting of DNA denaturation at 98°C (30 s) 250
and ten cycles of 98°C (30 s), 62°C (20 s) and 72°C (30 s), followed by 72°C for 5 minutes. 251
PCR products were next pooled to reconstitute libraries. DNA fragments between 200 and 252
23 of 30
instructions. Bead-captured fragments were eluted in 35 μl of water and 30 μl of elution were 254
collected in a new labelled microtube. Next, libraries were 125bp paired-end sequenced in 255
an Illumina HiSeq 2500 platform (Illumina Inc., San Diego, CA, USA) at the Australian 256
Genome Research Facility (AGRF, Melbourne node, Australia). 257
4.4. Data analysis
258
The ms-GBS data was analysed following a workflow requiring bioinformatics tools in both 259
Linux bash shell and R environments. Fastq files from the Illumina sequencing platform were 260
first de-multiplexed and checked for read quality by the sequencing service provider, 261
reporting read quality encoded in symbolic ASCII format in Phred-like quality score + 33. 262
Only fragments with at least 95% of the reads having Phred > 25 were retained. Reads that 263
did not have a barcode were put into undetermined files and removed from any downstream 264
analyses. Prior to demultiplexing, Illumina adaptor sequences used for library construction, 265
were also removed. The second step consisted of preparing the reads for alignment in the 266
barley reference genome. As this was pair-end read sequencing data, both strands were 267
merged together in a single read, using the module bbmap in bash. Merged reads were next 268
aligned to the barley reference genome downloaded from the Ensembl database 269
(http://plants.ensembl.org/Hordeum_vulgare/). This required the module bowtie/2-2.2.3 to 270
build a bowtie2 index for the barley genome, and the module samtools/1.2 to perform 271
alignments. As paired reads were merged into single reads, therefore only those that overlap 272
were retained, to allow proper map. This alignment step yielded bam files containing only 273
reads that matched with the reference genome. Next, a read count matrix was generated using 274
only marker sequence tags that matched with MspI cut sites on known chromosomes (1H to 275
7H) and those on contigs were discarded. This count matrix was then used as source data to 276
perform subsequent analyses using R packages. 277
4.5. Salinity induced differentially methylated markers in barley
278
Alteration of DNA methylation in barley seedlings exposed to salinity was assessed in 279
mCCGG contexts by the use of MspI during sample preparation. Differentially methylated 280
markers (DMMs) were identified using the package msgbsR developed by Mayne et al [87] 281
(https://github.com/BenjaminAdelaide/msgbsR, accessed on 26/08/2016), fitting a 282
generalised linear model to the design, with the trimmed mean of M-values normalisation 283
option (TMM). Then, Benjamini-Hochberg method was used for P-values. Then, DMMs 284
were selected based on FDR < 0.01 for differences in read counts per million between salt-285
free control and salt treatments (75 mM, 150 mM or 200 mM NaCl), with at least 1 count per 286
million (CPM) reads. To obtain robust salt-induced markers, we selected DMMs that were 287
conserved in all barley genotypes, and present in at least 20 samples per treatment. The logFC 288
(logarithm 2 of fold-change in CPM reads) was computed to evaluate the intensity of salt 289
treatment-induced alteration of DNA methylation and infer whether the change was a de novo 290
methylation or demethylation event. This approach of determining the directionality of DNA 291
methylation uses the fold change as an inverse proxy for change in the methylation level. 292
That is, higher methylation levels on a specific locus will reduce the number of restriction 293
24 of 30
4.6. Distribution of salt-induced DMMs around genomic futures
295
To determine whether there was a correlation between salt-induced DNA methylation and 296
genomic features in barley, the distribution of DMMs was assessed around genes and repeat 297
regions as defined in the Ensembl database (http://plants.ensembl.org/biomart/martview/). 298
This was done by mapping stable salt-induced DMMs with repeats and genes in the barley 299
reference genome. Then, we tallied the number of DMMs within genomic features (repeats, 300
genes, exons) and per 1 Kb bins within 5 Kb flanking regions both up- and down-stream 301
[47,88], using the shell module bedtools /2.22.0 [89]. The same procedure was repeated to 302
estimate the number of DMMs around exons and UTRs of differentially methylated genes, 303
and tRNA genes. 304
4.7. Gene ontology of differentially methylated genes
305
Genes within 5 Kb of a DMM were referred to as differentially methylated genes (DM) genes. 306
These genes were used for gene ontology analysis, to investigate whether salt-induced 307
changes in DNA methylation correlated with salt responsive genes. DM genes were grouped 308
in hypermethylated and hypomethylated genes per organ (leaf or root), which were next used 309
separately for GO terms enrichment, using two R packages: GO.db and annotate [90,91]. 310
Significant GO terms were selected based on Bonferroni adjusted P-values [92] at a 311
significance threshold of 0.01 and a total GO enrichment of DM and non-DM genes at least 312
equal to 10. The results of GO analysis were visualized in treemaps generated in REVIGO 313
[93]. 314
4.8. Gene expression and ontology analysis of root transcriptome
315
We further investigated whether differentially methylated genes were known to be 316
differentially expressed in the plant. To do so, we used as an exemplar, a dataset of root 317
transcriptome of two barley varieties (Clipper and Sahara-3771) grown under salt stress (100 318
mM NaCl) and control conditions [3]. The raw data was downloaded from 319
https://www.ebi.ac.uk/arrayexpress/experiments/E-MTAB-4634/, and samples from the root 320
maturation zone, as defined by the authors [3], were used. The data contained four biological 321
replicates of two varieties and two salt treatments (control and 100 mM NaCl), for a total 322
library size over 390 million reads. A quality control was performed on these reads, which 323
were then merged to form a single large fastq file for each sample. Merged read pairs were 324
trimmed using AdapterRemoval [94], followed by a second round of quality control. 325
After alignment using hisat2-2.0.4 in bash [95], salt-induced differential gene expression 326
analysis was performed, using a custom GTF file from Ensembl and created by the tool 327
StringTie 1.3.1c [96]. This GFF file was restricted to transcripts on the known chromosomes 328
(1H to 7H). Read counts were assigned to genes in the GTF file using featureCounts v1.5.1 329
[97], and loaded as DGEList object in R. As the data contained paired end reads, the 330
parameters were set to only count fragments (i.e. template molecules), instead of individual 331
reads. This dataset was next filtered to keep only genes with CPM > 0.5 in at least four 332
samples. Gene transcripts passing these conditions and present on chromosomes 1H to 7H, 333
25 of 30
Before comparing treatments, the dataset was explored for sample variability using the MDS 335
plot. Differential gene expression was then estimated using the lmFit function in 336
limma::voom, a gene-wise linear model [98], and differentially expressed genes were defined 337
as having an absolute fold-change > 2, with an FDR adjusted P-value < 0.05. Differentially 338
expressed genes were first used “as are” for gene ontology analysis as described above 339
(previous section). Differentially expressed genes were then assessed for proximity to salt-340
induced DMMs within 5 Kb in both directions. Genes found in this proximity with DMMs 341
and referred to as differentially methylated DE genes, were used for another GO analysis. 342
Results of these GO enrichments were visualized in treemaps produced in REVIGO [93], to 343
show the main GO representatives. 344
Supplementary Materials: The following are available online at www.mdpi.com/link. Supplemental Data Set
345
S1. List of stable salt-induced differentially methylated markers in leaves and roots. Supplemental Data Set S2. 346
List of salt-induced differentially methylated genes. Supplemental Data Set S3. Annotation of salt-induced 347
differentially methylated genes in barley leaves and roots. Supplemental Data Set S4. List and annotation of salt 348
induced DE genes and differentially methylated DE genes in roots of Clipper and LR Sahara. 349
Acknowledgments: MK was financially supported by an Australian Awards Scholarship, offered by AusAID
350
(Australian Agency for International Development). The authors are grateful to the Bioinformatics Hub of the 351
University of Adelaide for assistance. 352
Author Contributions: M.K. conceived and performed the experiments, analysed the data and wrote the
353
manuscript; B.J.M. performed ms-GBS data alignments; S.M.P. performed bioinformatic analysis of publicly 354
available RNA-Seq data; M.J.W., E.S.S., B.B., C.M.R.L. conceived the experiments and supervised the work. All 355
authors read and commented on the manuscript. 356
Conflicts of Interest: The authors declare that they have no conflicts of interest.