Copyright © 1997, American Society for Microbiology
Evaluation of a Method for Counting Absolute Numbers
of Cells with a Flow Cytometer
JANET K. A. NICHOLSON,1* DANA STEIN,2TAMMY MUI,2RICHARD MACK,3
MARJORIE HUBBARD,1ANDTHOMAS DENNY2,3
Division of AIDS, STD, and TB Laboratory Research, National Center for Infectious Diseases, Centers for Disease Control and Prevention, U.S. Public Health Service, Atlanta, Georgia 30333,1and Department of Pediatrics2and
Department of Laboratory Medicine and Pathology,3New Jersey Medical School, Newark, New Jersey 07103
Received 5 December 1996/Returned for modification 8 January 1997/Accepted 19 February 1997
We evaluated a method for performing absolute cell counts of lymphocyte populations with a flow cytometer. In this method, TruCount, test tubes that contain a known number of brightly fluorescent polystyrene beads are provided by the manufacturer. Whole anticoagulated blood is accurately pipetted into the tubes and mixed with fluorochrome-labeled monoclonal antibodies, the erythrocytes are lysed, and this mixture is analyzed on the flow cytometer. Absolute counts of lymphocyte subsets are calculated by determining the ratio of beads to the cell population of interest and then multiplying this ratio by the number of beads in the tube. We found this method to be reproducible. The values we obtained by the TruCount method were 5 to 10% higher than those obtained by conventional methods (flow cytometry and automated hematology) used to determine absolute numbers of cells. We believe that these differences are due to the methods of determining absolute cell counts and not to faulty identification of lymphocyte subsets.
CD4 T-cell levels are commonly measured in human immu-nodeficiency virus (HIV)-infected patients (12). CD4 cells comprise the majority of T cells in healthy persons and are responsible for providing help to B cells in the production of antibody, as well as for augmenting immune responses to an-tigens. Because these cells are essential for maintaining vigor-ous immune responses, any loss of them is believed to result in the inability of the host to appropriately respond to foreign antigens, thus rendering the host susceptible to infections. Therefore, in cases of HIV infection, CD4 cell levels are be-lieved to be a good measure of the degree of immunosuppres-sion, with lower CD4 cell levels being related to a progressive loss of immune function in the host (6, 10). In addition, since CD41cells are the target of HIV infection, decreases in the
number of these cells reflect increases in the rate of HIV replication (4).
CD41-T-cell levels are measured by flow cytometry (to
de-termine the percentage of lymphocytes that are CD41T cells)
and hematology (to determine the number of leukocytes [WBC] in the blood and the proportion of WBC that are lymphocytes [the WBC differential]) (2). Because this type of measurement requires the results of three separate laboratory tests, the variability of the final measurement is greater than that of a single test. In addition, the hematology measurement methods limit the time in which a specimen can be tested with confidence. Generally, this time limit is 18 to 24 h. The devel-opment of new methods for determining absolute numbers of lymphocytes has grown from a desire to limit the number of tests needed to obtain absolute cell counts as well as to extend the time in which the specimen can be tested with confidence. Single-platform tests for determining the number of CD41T
cells have included simple technologies dedicated to obtaining absolute numbers for CD4 and CD8 T cells (3, 5, 8, 9). Re-cently, tests that permit these measurements to be made
di-rectly on clinical flow cytometers have been developed. This study evaluated one of these, the TruCount test (Becton Dick-inson Immunocytometry Systems, San Jose, Calif.), which uses tubes containing a known number of brightly fluorescent poly-styrene beads. The absolute number of cells is calculated based on the ratio of beads to cells counted in the tube. The advan-tages of this test are that it does not rely on hematology determinations for an absolute lymphocyte count, is suitable for specimens older than 18 h, and provides percentages as well as absolute numbers of lymphocytes such as CD41T cells.
MATERIALS AND METHODS
Patients.Samples from 81 donors (51 HIV positive and 30 HIV negative) from clinical studies at the University of Medicine and Dentistry New Jersey were assayed. Six donors were,2 years old, one was 4 years old, one was 12 years old, and the remainder were between 18 and 80 years old. Donors were categorized as having,200 CD41T cells/ml (n524), 200 to 500 CD41T cells/ml (n522),
and.500 CD41T cells/ml (n535). Whole blood was collected in EDTA, and
all tests were performed within 6 h of collection. Samples from an additional nine donors were used for quadruplicate measures. Three each in the categories described above were evaluated. All peripheral blood samples were collected as part of routine clinical evaluations, through patient participation in an institu-tional review board-approved research protocol, or from the University of Med-icine and Dentistry New Jersey laboratory’s healthy-donor program.
Hematology.A portion of the blood was divided into two aliquots for hema-tology testing. One aliquot was tested with a Coulter STKS hemahema-tology analyzer (Coulter Electronics, Inc., Hialeah, Fla.) and the other was tested with a Sysmex E-2500 (Baxter Healthcare Corp., McGaw Park, Ill.), which is commonly used in our laboratory. Five specimens had hematology flags (all HIV positive), and in all cases the automated differential was used.
Flow cytometry.For use with the hematology determination for absolute cell counts, a six-tube, two-color panel assay was performed (2). The tubes contained (i) fluorescein isothiocyanate (FITC)-CD45 and phycoerythrin (PE)-CD14, (ii) FITC-mouse immunoglobulin G1 and PE-mouse immunoglobulin G2, (iii) FITC-CD3 and CD4, (iv) FITC-CD3 and CD8, (v) FITC-CD3 and PE-CD19, and (vi) FITC-CD3 and PE-CD16 plus PE-CD56. Simultest IMK lym-phocyte reagents and lysing reagents were obtained from Becton Dickinson Immunocytometry Systems. The cells were prepared as previously reported (3). The TruCount test consisted of four tubes, containing (i) FITC-CD3, PE-CD4, and peridinin chlorophyll protein (PerCP)-CD45; (ii) FITC-CD3, PE-CD8, and PerCP-CD45; (iii) FITC-CD3, PE-CD19, and PerCP-CD45; and (iv) FITC-CD3, PE-CD16 plus PE-CD56, and PerCP-CD45 reagents (TriTest; Becton Dickin-son). Fifty microliters of whole blood and 20ml of monoclonal antibodies were added to the TruCount tubes. After a 20-min incubation, 450ml of lysing reagent (FACS lysing solution; Becton Dickinson) was added.
* Corresponding author. Mailing address: Centers for Disease Con-trol and Prevention, Atlanta, GA 30333. Phone: (404) 639-3436. Fax: (404) 639-2108.
309
on August 17, 2020 by guest
http://cvi.asm.org/
All tubes were analyzed on a FACScan flow cytometer (Becton Dickinson). The two-color data was analyzed by CellQuest software (Becton Dickinson) and the three-color data was analyzed with Attractors (Becton Dickinson). For the TruCount tubes, the analysis software calculated the percentage of lymphocytes that were positive for the subset of interest by identifying lymphocytes as being positive for CD45 but with low side scatter. Absolute numbers were calculated by the software as (number of cells of interest counted/number of beads counted)3 (total number of beads in tube [from manufacturer]/50ml [volume of blood tested]). The manufacturer also supplied tubes containing high, medium, and low counts of fluorescent beads to be used to check for counting linearity.
Statistics.To assess the test precision (reproducibility), we calculated the means, standard deviations, and coefficients of variation (CVs) for each set of four replicates. We then averaged the CVs. To compare the TruCount method with hematology and flow cytometry (referred to here as conventional methods), we performed paired t tests to look for differences between methods for all patients as well as the three subsets of patients based on CD4 cell numbers, drew linear regressions and calculated correlation coefficients to determine the rela-tionships between methods, and produced bias plots. These, combined with the paired t tests, were used to evaluate the biases the TruCount method exhibited compared with conventional methods. For one specimen, from a child,2 years old, the TruCount values were approximately one-half those obtained by con-ventional methods, and the reason for the discrepancy could not be determined. These values were excluded from analyses by the statistical analysis program. The absolute subset values for a sample from another child,2 years old were the highest for all subsets (except CD81T cells) from any of the donors. These
values were included in the analyses but not represented in the bias plots.
RESULTS
Hematology replicate variability.Percentages and absolute
numbers of lymphocyte populations from 81 donors obtained by current technology (flow cytometry plus hematology) and the new bead-based, flow cytometry-based absolute counting system (TruCount) were compared. We evaluated the Tru-Count system both for its precision of measurement and in comparison with conventional methods. To evaluate reproduc-ibility, four replicate specimens each from nine donors were set up with each assay system. Three donors had CD41-T-cell
counts of.500 cells/ml, three had 200 to 500 cells/ml, and three had ,200 cells/ml. First, we compared the precision of the WBC count and differential with either the Sysmex or Coulter hematology instrument. These results were not different be-tween instruments (Sysmex WBC CV52.89%, absolute lym-phocyte CV 5 4.9%; Coulter WBC CV 5 1.74%, absolute lymphocyte CV 5 4.56%), indicating that variations in the measured analytes were similar. Next, the WBC and absolute lymphocyte values from the hematology instruments were compared with each other. The WBC value determined with the Coulter hematology instrument was slightly higher than that determined with the Sysmex instrument (Coulter55,700, Sysmex 5 5,628; P5 0.023), the percentage of lymphocytes was lower according to the Coulter instrument (Coulter 5
35.2%, Sysmex 5 36.3%; P, 0.001), and the absolute
lym-phocyte counts were about the same with both instruments (Coulter51,926, Sysmex51,951; P50.11).
Lymphocyte subset absolute-count variability.Because the
CV in the absolute lymphocyte count was about 5.0%, addi-tional variability due to replicate subset percentage data made the CV of the absolute lymphocyte subset count.5.0% (CD3, 5.1%; CD4, 7.1%; CD8, 5.5%; CD19, 6.6%; and CD32CD161
CD561, 8.7% [hematology replicates’ absolute lymphocyte
count combined with data obtained by three-color flow cytom-etry]). As determined by using the TruCount method for cal-culating absolute numbers of lymphocyte populations, the CVs were as follows: CD3, 2.90%; CD4, 5.01%; CD8, 5.22%; CD19, 7.60%; and CD32CD161CD561, 8.15%. The higher
variabil-ity of B and NK cells, as measured by the CV, is typical of that found by lymphocyte immunophenotyping: as the proportion of cells measured in the populations decreases, the standard deviation decreases; because these decreases are not propor-tional, however, the CV increases.
Comparison of lymphocyte percentage data.In the
evalua-tion of current methodology and TruCount, two-color and three-color approaches as well as the derivation of absolute numbers of cells on single-platform (TruCount) and multiplat-form (flow cytometry and hematology) tests were compared. An additional difference between the flow cytometry methods is the method used for gating lymphocytes. The two-color method uses light-scattering characteristics of WBC to identify and gate lymphocytes. Then the gate is verified based on CD45 and CD14 fluorescence patterns consistent with lymphocytes as well as the ability of the test to identify all lymphocytes as being T, B, or NK cells (“lymphosum” [11]). Percent values are corrected for nonlymphocyte contaminants in the gate by di-viding the result by the percentage of lymphocytes identified as being bright for CD45 but negative for CD14. TruCount uses CD45 for the third color and identifies lymphocytes based on bright CD45 fluorescence combined with low light scattering. No adjustments are made for lymphocyte purity. (Based on the addition of T-, B-, and NK-cell populations to determine the proportion of lymphocytes within the gate, the lymphosum [11] was 100.1% 62.5% for the two-color method and 97.5%6
2.2% for the three-color method.) As determined by using a paired t test to compare percentages, the CD4 values obtained by the two-color and three-color approaches were not different (P50.95); however, the CD3, CD8, CD19, and CD32CD161
CD561results were found to be significantly higher with the
TruCount method (CD3, P,0.001; CD8, P,0.001; CD19,
P50.038; CD32CD161CD561, P50.002) (Table 1).
Comparison of absolute lymphocyte subsets. To compare
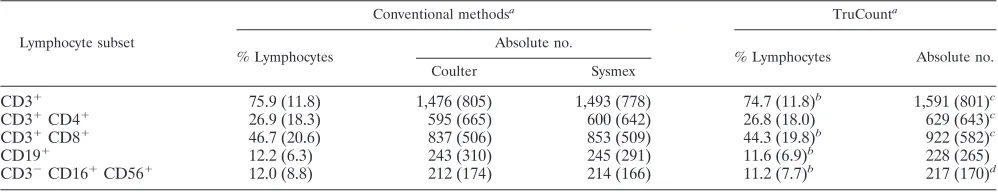
the absolute numbers determined by the TruCount and con-TABLE 1. Comparison of lymphocyte population percentages and absolute numbers of lymphocytes by
conventional methods and the TruCount system
Lymphocyte subset
Conventional methodsa TruCounta
% Lymphocytes Absolute no. % Lymphocytes Absolute no. Coulter Sysmex
CD31 75.9 (11.8) 1,476 (805) 1,493 (778) 74.7 (11.8)b 1,591 (801)c
CD31CD41 26.9 (18.3) 595 (665) 600 (642) 26.8 (18.0) 629 (643)c
CD31CD81 46.7 (20.6) 837 (506) 853 (509) 44.3 (19.8)b 922 (582)c
CD191 12.2 (6.3) 243 (310) 245 (291) 11.6 (6.9)b 228 (265)
CD32CD161CD561 12.0 (8.8) 212 (174) 214 (166) 11.2 (7.7)b 217 (170)d
aValues are means and standard deviations.
bCompared with conventional methods, P was,0.05 according to the paired t test.
cCompared with conventional methods (Coulter and Sysmex hematology and flow cytometry), P was,0.05 according to the paired t test. dCompared with Coulter hematology and flow cytometry, P was,0.05 according to the paired t test.
on August 17, 2020 by guest
http://cvi.asm.org/
ventional methods for CD3, CD4, CD8, CD19, and CD32
CD161CD561cells, we drew linear regression lines to look
for correlations and bias plots to look for biases. Correlations of results for the hematology analyzers were all .0.99. We found that there was a systematic bias between the TruCount absolute-count data and the data collected by conventional methods (Table 2). Though the differences were small, there also was a bias toward lower counts with the Sysmex hematol-ogy analyzer than with the Coulter STKS analyzer. Absolute counts of T cells and T-cell subsets, as well as B cells, were consistently about 10% higher with TruCount than with con-ventional methods. The NK-cell counts had less or no bias.
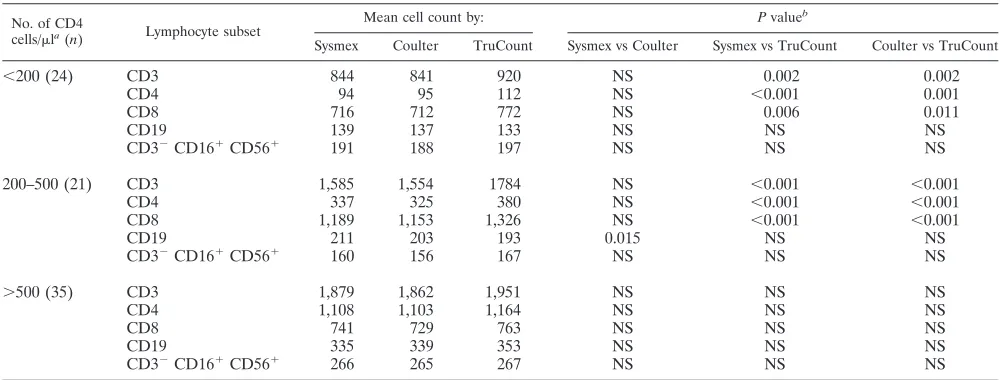
The patients were grouped into three categories based on the CD4 values obtained by conventional methods with the Sysmex hematology analyzer (the instrument used routinely in the testing laboratory): those with ,200 CD4 cells/ml, those with 200 to 500 CD4 cells/ml, and those with.500 CD4 cells/
ml. Paired t tests were performed for each absolute lymphocyte subset value, and the levels of significance are shown in Table 3. All T-cell subset (CD3, CD4, and CD8) values were statis-tically greater with TruCount than with conventional methods for patients with CD4 cell levels of,500 cells/ml.
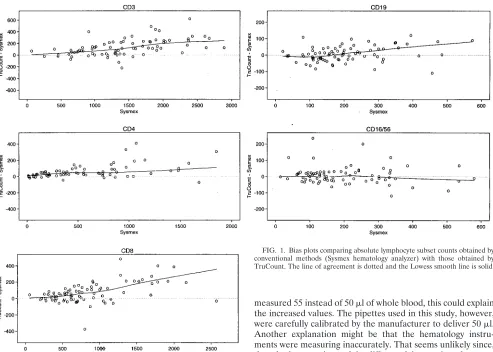
Bias plots were constructed by plotting the difference be-tween two methods against the results of one of the methods
(Fig. 1). As CD3 values increased, there tended to be an increase in the bias, so that at lower T-cell levels (,800 CD3 cells/ml) agreement was quite good. However, at higher T-cell levels the results obtained by the TruCount method deviated more from the results obtained by conventional methods, with a systematic bias toward higher values (Fig. 1). This deviation toward higher TruCount results at higher cell counts was re-flected in both the CD4 and CD8 T-cell values. Below 200 CD4 cells/ml, agreement was good. However, with higher numbers of CD4 cells (.200), there was a clear systematic bias for higher results from TruCount. CD8 T-cell levels of ,800 cells/ml were fairly evenly distributed above and below a line of agreement; however, at CD8 levels of .1,200 cells/ml, there was a bias for higher CD8 T-cell counts with TruCount. The B-and NK-cell populations were rB-andomly distributed around a line of agreement at all levels measured. The range of these results was considerably lower than that of the T-cell popula-tions, however.
DISCUSSION
Conventional methods for counting CD4 cells and other lymphocyte subsets rely on hematology instruments for deter-mining the WBC count and differential. We found the vari-ability of the absolute lymphocyte count to be between 4.5 and 5.0%. Combined with percent lymphocyte subset data, this value is usually 5 to 9%. It is believed that the variability of this measurement (flow cytometry combined with WBC count and differential) could be lowered by using a direct measurement of the number of cells rather than a counting method with mul-tiple steps. Other methods for performing CD4 cell counts require dedicated instruments (5, 8) or kits that measure cell products or characteristics of groups of cells (3, 9). Recently, methods for measuring cells directly from the flow cytometer have been developed (7) (Flow Count [Coulter Immunology], ImmunoCount [Ortho Diagnostics], and TruCount [Becton Dickinson Immunocytometry Systems]). These single-platform methods have many advantages. First, the volume of blood needed is quite small compared with the volume needed for both the hematology and flow cytometry determinations. Sec-ond, specimens older than 18 to 24 h (the recommended max-TABLE 2. Systematic differences between absolute cell counts
obtained by TruCount and conventional methods
Lymphocyte subset
% Differencea
Coulter vs
Sysmex Coulter vsTruCount Sysmex vsTruCount
CD3 24.4 19.8 112.2
CD4 23.7 19.2 111.3
CD8 20.4 112.0 112.0
CD19 26.3 112.9 118.1
CD32CD161CD561 24.9 10.5 13.8
aBias derived from linear regression data representing the difference from a
line of perfect agreement. A negative value indicates that the absolute cell count obtained by the second method listed is less than that obtained by the first; a positive value indicates that the absolute cell count obtained by the second method listed is greater than that obtained by the first.
TABLE 3. Comparison of absolute lymphocyte subset counts within groupings based on CD4 cell counts
No. of CD4
cells/mla(n) Lymphocyte subset
Mean cell count by: P valueb
Sysmex Coulter TruCount Sysmex vs Coulter Sysmex vs TruCount Coulter vs TruCount
,200 (24) CD3 844 841 920 NS 0.002 0.002
CD4 94 95 112 NS ,0.001 0.001
CD8 716 712 772 NS 0.006 0.011
CD19 139 137 133 NS NS NS
CD32CD161CD561 191 188 197 NS NS NS
200–500 (21) CD3 1,585 1,554 1784 NS ,0.001 ,0.001
CD4 337 325 380 NS ,0.001 ,0.001
CD8 1,189 1,153 1,326 NS ,0.001 ,0.001
CD19 211 203 193 0.015 NS NS
CD32CD161CD561 160 156 167 NS NS NS
.500 (35) CD3 1,879 1,862 1,951 NS NS NS
CD4 1,108 1,103 1,164 NS NS NS
CD8 741 729 763 NS NS NS
CD19 335 339 353 NS NS NS
CD32CD161CD561 266 265 267 NS NS NS
aDetermined by conventional methods (Sysmex hematology analyzer).
bComparisons between groups were made with the paired t test. NS, not significant.
on August 17, 2020 by guest
http://cvi.asm.org/
imum time allowed for many hematology instruments) can reliably be analyzed. Last, the variability of a single-platform method should be less than that of any method utilizing three platforms. In the case of TruCount, the variability ranges from about 3% for CD3 cells to about 8% for B and NK cells. This level of variability is slightly less than that of conventional methods.
We found that the TruCount absolute T-cell counts were about 10% higher than counts obtained by using either the Sysmex or Coulter hematology counter and flow cytometry. The reason for this is unknown. The biases between the he-matology instruments, though not great, reinforce the theory that identification of lymphocytes varies by instrument and method of lymphocyte identification (1). We did not compare other hematology instruments, so we do not know how results obtained with those instruments would compare with the Tru-Count results. The TruTru-Count method identifies lymphocytes by their CD45 and side-scattering characteristics. The higher ab-solute numbers of cells identified by this method cannot be due to the inclusion of nonlymphocytes in the lymphocyte gate, because the gate serves as a qualifier for the subset determi-nation. The number of CD4 T cells, for example, could only be decreased, not increased, because of improper gates. Lower numbers of cells, for example, NK cells, may be counted be-cause the CD45 and side scatter lymphocyte gate may have excluded them from the analysis. The TruCount method is absolutely dependent on measuring exactly 50 ml of whole blood; counts are calculated on this basis. If the pipette used
measured 55 instead of 50ml of whole blood, this could explain the increased values. The pipettes used in this study, however, were carefully calibrated by the manufacturer to deliver 50ml. Another explanation might be that the hematology instru-ments were measuring inaccurately. That seems unlikely since, though they are located in different laboratories, they per-formed similarly and the quality control for both instruments was carefully monitored. Finally, the method for measuring lymphocytes in a hematology analyzer is considerably different from that for TruCount. TruCount tubes containing a known number of beads are provided by the manufacturer. While any factors that affect the number of beads in the tubes could have an impact on the final result, we assume that the beads are provided in the numbers indicated on the tubes. Also, the TruCount system is a no-wash system, so cell loss is minimized, and calibrator beads are run on a daily basis to ensure that the flow cytometer is counting correctly. Thus, we are unable to explain why we obtained higher counts with TruCount than with conventional methods.
Laboratories which choose to use TruCount or other sys-tems that generate absolute lymphocyte subpopulation results should carefully compare the new system with conventional methods, looking for biases as well as evaluating performance. When there are consistent biases, the laboratory should either (i) correct all data to account for the biases or (ii) report the values obtained by the new method, with a clear statement that comparison with older methods included a bias, and suggest a correction factor that could be applied to the data. Results obtained by a new laboratory test that are different do not necessarily mean that the new test is in error. The true tests of any laboratory assay are its clinical relevance and how well it performs in helping users make diagnostic med-ical decisions. Many new single-platform cell-counting methods are currently undergoing clinical trials to determine these ca-pabilities.
FIG. 1. Bias plots comparing absolute lymphocyte subset counts obtained by conventional methods (Sysmex hematology analyzer) with those obtained by TruCount. The line of agreement is dotted and the Lowess smooth line is solid.
on August 17, 2020 by guest
http://cvi.asm.org/
ACKNOWLEDGMENTS
We thank Tim Green and Sherry Orloff for statistical analyses.
REFERENCES
1. Bentley, S. A., A. Johnson, and C. A. Bishop. 1993. A parallel evaluation of four automated hematology analyzers. Am. J. Clin. Pathol. 100:626–632. 2. Centers for Disease Control. 1992. Guidelines for the performance of CD41
T-cell determinations in persons with human immunodeficiency virus infec-tion. Morbid. Mortal. Weekly Rep. 41(RR-8):1–17.
3. Denny, T. N., B. D. Jensen, E. I. Gavin, A. G. Louzao, F. A. Vella, J. M.
Oleske, and W. Wong.1995. Determination of CD4 and CD8 lymphocyte subsets by a new alternative fluorescence immunoassay. Clin. Diagn. Lab. Immunol. 2:330–336.
4. DeWolf, F., M. Roos, J. M. A. Lange, J. T. M. Houweling, R. A. Coutinho, J.
Van der Noordaa, P. T. Schellekens, and J. Goudsmit.1988. Decline in CD41cell numbers reflects increase in HIV-1 replication. AIDS Res. Hum. Retroviruses 4:433–440.
5. Johnson, D., D. Hirschkorn, and M. P. Busch. 1995. Evaluation of four alternative methodologies for determination of absolute CD41lymphocyte counts. The National Heart, Lung, and Blood Institute retrovirus epidemi-ology donor study. J. Acquired Immune Defic. Syndr. Hum. Retrovirol.
10:522–530.
6. McDougal, J. S., J. K. A. Nicholson, and A. Mawle. 1987. Effects of HIV infection on the immune system, p. 51–88. In R. Madhok, C. D. Forbes, and
B. L. Evatt (ed.), Blood, blood products and AIDS. Chapman and Hall, Ltd., London, England.
7. Mercolino, T. J., M. C. Connelly, E. J. Meyer, M. D. Knight, J. W. Parker,
G. T. Stelzer, and G. DeChirico.1995. Immunologic differentiation of abso-lute lymphocyte count with an integrated flow cytometric system: a new concept for absolute T cell subset determinations. Cytometry 22:49–59. 8. Nicholson, J. K. A., W. M. Velleca, S. Jubert, T. A. Green, and L. Bryan.
1994. Evaluation of alternative CD4 technologies for the enumeration of CD4 lymphocytes. J. Immunol. Methods 177:43–54.
9. Paxton, H., M. Pins, G. Denton, A. D. McGonigle, P. S. Meisner, and J. P.
Phair.1995. Comparison of CD4 cell count by a simple enzyme-linked immunosorbent assay using the TRAx CD4 test kit and by flow cytometry and hematology. Clin. Diagn. Lab. Immunol. 2:104–114.
10. Rosenberg, Z. F., and A. S. Fauci. 1991. Immunopathogenic mechanisms of human immunodeficiency virus (HIV) infection, p. 141–161. In R. C. Gallo and G. Jay (ed.), The human retroviruses. Academic Press, Inc., San Diego, Calif.
11. Schenker, E. L., L. E. Hultin, K. D. Bauer, J. Ferbas, J. B. Margolick, and
J. V. Giorgi.1993. Evaluation of a dual-color flow cytometry immunophe-notyping panel in a multicenter quality assurance program. Cytometry 14: 307–317.
12. Turner, B. J., F. M. Hecht, and R. B. Ismail. 1994. CD41T-lymphocyte measures in the treatment of individuals infected with human immunodefi-ciency virus type I. Arch. Intern. Med. 154:1561–1572.