Available Online atwww.ijcsmc.com
International Journal of Computer Science and Mobile Computing
A Monthly Journal of Computer Science and Information Technology
ISSN 2320–088X
IMPACT FACTOR: 6.017
IJCSMC, Vol. 6, Issue. 6, June 2017, pg.239 – 244
A Review Study on Big Data
Analysis Using Hadoop
Jyoti Kumari
1, Mr. Surender
21
M.Tech Scholar, 2Associate Professor
1,2Department of Computer Science & Engineering, Om Group of Institutions (Haryana) 1
[email protected], 2 [email protected]
Abstract:- The emerging Big Data Science term, showing its broader impact on our society and in our business life cycle, has insightful transformed our society and will continue to attract diverse attentions from technical experts and as well as public in general. It is obvious that we are living in Big Data era, shown by the sheer volume of data from a variety of sources and its rising rate of generation. So far, most of the current mobile systems are mainly targeted to voice communications with low transmission rates. In the near future, however, big data access at high transmission rates will be. This is a review on accessible big-data systems that include a set of tools and technique to load, extract, and improve dissimilar big-data while leveraging the immensely parallel processing power to perform complex transformations and analysis. “Big-Data” system faces a series of technical challenges.
Keywords: - Big Data
INTRODUCTION
The emerging Big Data Science term, showing its broader impact on our society and in our business life cycle, has insightful transformed our society and will continue to attract diverse attentions from technical experts and as well as public in general [1] [2]. It is obvious that we are living in Big Data era, shown by the sheer volume of data from a variety of sources and its rising rate of generation. For instance, an IDC report predicts that, from 2005 to 2020, the global data dimensions will grow by a factor of 300, from 130 Exabyte‟s to 40,000 Exabyte‟s, representing a double growth every two years. This is focuses on accessible big-data systems that include a set of tools and technique to load, extract, and improve dissimilar data while leveraging the immensely parallel processing power to perform complex transformations and analysis. “Big-Data” system faces a series of technical challenges, including:
First, due to the large variety of different data sources and the huge volume, it is too difficult to collect, integrate and analysis of “Big Data” with scalability from scattered locations.
Second “Big Data” systems need to manage, store and integrate the gathered large and varied verity of datasets, while provide function and performance assurance [1], in terms of fast retrieval, scalability and secrecy protection.
Third “Big Data” analytics must effectively excavation large datasets at different levels in real time or near real time - including modeling, visualization [2], prediction and optimization - such that inherent potentials can be revealed to improve decision making and acquire further advantages.
ABRIEF HISTORY OF BIG DATA
Considering the growth and intricacy of “Big Data” science systems, previous descriptions are based on a one-sided view point, such as chronology or milepost technologies. The history of “Big Data” is presented in terms of the data size of interest. Under this framework, the history of “Big Data” is tied closely to the capability of efficiently storing and managing larger datasets, with size boundaries expanding by orders of degree.
TABLE I GROWTH OF BIG DATA
TRADITIONAL
DATA BIG DATA
VOLUME GB
CONSTANTLY
UPDATED (TB OR
PB)
Generated
Rate Per hour, day, More rapid
Structure Structured
Semi- structured or un-structured
Data Source Centralized fully distributed
Data
Integration Easy Difficult
Data Store RDBMS HDFX, No SQL
Access Interactive
Batch or near real time
1) Megabyte to Gigabyte: In the 1970s and 1980s, historical business data introduced the earliest “Big Data” challenge in moving from megabyte to gigabyte sizes. [18]
2) Gigabyte to Terabyte: In the late 1980s, the popularization of digital technology caused data volumes to expand to several gigabytes or even a terabyte, which is beyond the storage and/or processing capabilities of a single large computer system [2]. Data parallelization was proposed to extend storage capabilities and to improve performance by distributing data and related tasks, such as building indexes and evaluating queries, into disparate hardware.
3) Terabyte to Petabyte: During the late 1990s, when the database community was admiring its „„finished‟‟ work on the parallel database, the rapid development of Web 1.0 led the whole world into the Internet era[2], along with massive semi-structured or unstructured webpages holding terabytes or petabytes (PBs) of data.
BIG DATA PROBLEM AND CHALLENGES
However, considering variety of data sets in “Big Data” problems, it is still a big challenge for us to purpose efficient representation, access, and analysis of shapeless or semi-structured data in the further researches [12]. How can the data be preprocessed in order to improve the quality of data and analysis results before we begin data analysis [1] [2]? As the sizes of dataset are often very large, sometimes several gigabytes or more, and their origin from varied sources, current real-world databases are pitilessly susceptible to inconsistent, incomplete, and noisy data. Therefore, a number of data preprocessing techniques, including data cleaning [11], data integration, data transformation and date reduction, can be applied to remove noise and correct irregularities. Different challenges arise in each sub-process when it comes to data-driven applications.
PRINCIPLES FOR DESIGNING BIG DATA SYSTEM
In designing “Big Data” analytics systems, we summarize seven necessary principles to guide the development of this kind of burning issues [3]. “Big Data” analytics in a highly distributed system cannot be achievable without the following principles [13]:
4) Bring the analysis to data
5) Processing must be distributable for in-memory computation. 6) Data storage must be distributable for in-memory storage.
BIG DATA OPPORTUNITIES
The bonds between “Big Data” and knowledge hidden in it are highly crucial in all areas of national priority. This initiative will also lay the groundwork for complementary “Big Data” activities, such as “Big Data”substructure projects, platforms development, and techniques in settling complex, data-driven problems in sciences and engineering. Researchers, policy and decision makers have to recognize the potential of harnessing “Big Data” to uncover the next wave of growth in their fields.
BIG DATA ANALYSIS
The last and most important stage of the “Big Data” value chain is data analysis, the goal of which is to get useful values, suggest best conclusions and support decision-makingsystem of an organization to stay in competition market. [1]
Descriptive Analytics: exploits historical data to describe what occurred in past. For instance, a regression technique may be used to find simple trends in the datasets, visualization presents data in a meaningful fashion, and data modeling is used to collect, store and cut the data in an efficient way. Descriptive analytics is typically associated with business intelligence or visibility systems [2].
Predictive Analytics: focuses on predicting future probabilities and trends. For example, predictive modeling uses statistical techniques [6] such as linear and logistic regression to understand trends and predict future out-comes, and data mining extracts patterns to provide insight and forecasts [4].
Prescriptive Analytics: addresses decision making and efficiency. For example, simulation is used to analyze complex systems to gain insight into system performance and identify issues and optimization techniques are used to find best solutions under given constraints.
BIG DATA CLASSIFICATION ALGORITHM 1) Decision Tree
2) Random Forest
3) Support Vector Machine
Decision tree learning uses a decision tree as a predictive model which maps observations about an item to conclusions about the item's target value. It is one of the predictive modeling approaches used in statistics, data mining and machine learning. Tree models where the target variable can take a finite set of values are called classification trees. In these tree structures, leaves represent class labels and branches represent conjunctions of features that lead to those class labels. Decision trees where the target variable can take continuous values are called regression trees. In decision analysis, a decision tree can be used to visually and explicitly represent decisions and decision making. In data mining, a decision tree describes data but not decisions; rather the resulting classification tree can be an input for decision making [23].
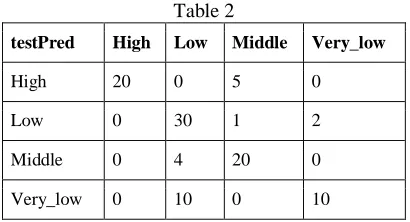
Confusion matrix - Decision Tree (Predict on Test Data)
Table 2
testPred High Low Middle Very_low
High 20 0 5 0
Low 0 30 1 2
Middle 0 4 20 0
Very_low 0 10 0 10
Apache Hadoop
It supports operations in distributed environment. It consists of various modules: 1. Hadoop Common – shared libraries ;
2. Hadoop Distributed File System (HDFS) – a distributed file-system to store large volume data 3. Hadoop YARN – responsible for Resource management, process scheduling and user application
management.
4. Hadoop MapReduce –Programming interface to process large scale data.
Hadoop Merits
It supports:
1. Scalability for data processing 2. Low cost data analysis 3. Robust Fault Tolerance
Figure: HADOOP Architecture
Data Node: stores data in HDFS
Name Node: It keeps the track of files stored at HDFS
Job Tracker: It keeps the track of process of MAPReduce, in a given cluster
Task Tracker: in a given, it handles the jobs related to Map, Reduce and Shuffle operations by interacting with Job Tracker. Hadoop Components
Figure: Hadoop Components
HDFS is a storage module which deals with Name Node (NN) and Secondary Name Node (SNN) hich keep the data track for Data Node (DN). DN performs I/O operations and interacts with NN.
MapReduce system
In a MapReduce system, many jobs are processed simultaneously. Each job is divided into small tasks and distributed to many virtual machines. A MapReduce job is also divided into three different phases:
Map
Shuffle
Reduce.
significant influence on the network traffic pattern, allowing us to reduce substantially both congestion and energy consumption by combining virtual machine assignment and traffic engineering. At the same time, the optimization results will be independent from traffic variations.[2]
MapReduce framework consists of:
Single master ResourceManager,
One slave per cluster-node,
MRAppMaster (for each application)
The MapReduce framework operates exclusively on <key, value> pairs, that is, the framework views the input to the job as a set of <key, value> pairs and produces a set of <key, value> pairs as the output of the job, conceivably of different types.
The key and value classes have to be serializable by the framework and hence need to implement the Writable interface. Additionally, the key classes have to implement the Writable Comparable interface to facilitate sorting by the framework.
Input and Output types of a MapReduce job:
(input) <k1, v1> -> map -><k2, v2> -> combine -><k2, v2> -> reduce -><k3, v3> (output)
Applications typically implement the Mapper and Reducer interfaces to provide the map and reduce methods. These form the core of the job.
Mapper
Mapper maps input key/value pairs to a set of intermediate key/value pairs.
Map is a process that transforms input records into intermediate records. The transformed intermediate records do not need to be of the same type as the input records. A given input pair may map to zero or many output pairs. The Hadoop MapReduce framework spawns one map task for each InputSplit generated by the InputFormat for the job. Overall, Mapper implementations are passed the Job for the job via the Job.setMapperClass(Class) method. The framework then calls map(WritableComparable, Writable, Context) for each key/value pair in the InputSplit for that task. Applications can then override the cleanup(Context) method to perform any required cleanup.
Output pairs do not need to be of the same types as input pairs. A given input pair may map to zero or many output pairs. Output pairs are collected with calls to context.write(WritableComparable, Writable).
Applications can use the Counter to report its statistics.
All intermediate values associated with a given output key are subsequently grouped by the framework, and passed to the Reducer(s) to determine the final output. Users can control the grouping by specifying a Comparator via Job.setGroupingComparatorClass(Class).
The Mapper outputs are sorted and then partitioned per Reducer. The total number of partitions is the same as the number of reduce tasks for the job. Users can control which keys (and hence records) go to which Reducer by implementing a custom Partitioner.
Users can optionally specify a combiner, via Job.setCombinerClass(Class), to perform local aggregation of the intermediate outputs, which helps to cut down the amount of data transferred from the Mapper to the Reducer.
Reducer
Reducer reduces a set of intermediate values which share a key to a smaller set of values.The number of reduces for the job is set by the user via Job.set Num Reduce Tasks (int). Overall, Reducer implementations are passed the Job for the job via the Job set Reducer Class(Class) method and can override it to initialize themselves.
COMPARISONS OF CLASSIFICATION FOR BIG DATA SCIENCE
To apply different classification technique I have chosen a real dataset about the student‟s knowledge status about the subject of Electrical DC Machines. Distribution of every numeric variable can be checked with function summary (), which returns the minimum, maximum, mean, median, and the first (25%) and third (75%) quartiles. For factors (or categorical variables), it shows the frequency of every level.
REFERENCES
1. Karthik Kambatla, GiorgosKollias, Vipin Kumar, AnanthGrama, “J. Parallel Distrib. Comput”, Elsevier 2014, PP 2561-2573
2. Yanchang Zhao, “R and Data Mining: Examples and Case Studies”, www.RDataMining.com,2014
3. H. T. Kahraman, Sagiroglu, S., Colak,“User Knowledge Modeling Data Set”, UCI, vol. 37, pp. 283-295, 2013 4. Mrigank Mridul, Akashdeep Khajuria, Snehasish Dutta, Kumar N, “Analysis of Bidgata using Apache Hadoop and
Map” , Volume 4, Issue 5, May 2014 Reduce, PP. 555-560.
5. Sonja Pravilovic,” R language in data mining techniques and statistics”, 20130201.12,2013
6. Vrushali Y Kulkarni,” Random Forest Classifiers :A Survey and Future Research Directions”, International Journal of Advanced Computing, ISSN:2051-0845, Vol.36, Issue.1, April 2013
7. Aditya Krishna Menon,” Large-Scale Support Vector Machines: Algorithms and Theory”. 8. Du Zhang,” Inconsistencies in Big Data”, IEEE 978-1-4799-0783-0/13, PP 61-67
10.VigneshPrajapati, Big Data Analytics with R and HadoopPackt Publishing
11.Lei Wang At. Al., “BigDataBench: aBigDataBenchmarkSuitefromInternetServices”,IEEE 978-1-4799-3097-5/14. 12.AnirudhKadadi At. Al., “Challenges of Data Integration and Interoperability in Big Data”, IEEE (International
Conference on Big Data)978-1-4799-5666-1/14, PP 38-40
13.SAS, Five big data challenges and how to overcome them with visual analytics
14.HajarMousanif At. Al., “From Big Data to Big Projects: a Step-by-step Roadmap”, IEEE (International Conference on Future Internet of Things and Cloud) 978-1-4799-4357-9/14, PP 373-378
15.Tianbo Lu At. Al., “Next Big Thing in Big Data: The Security of the ICT Supply Chain”, IEEE (SocialCom/PASSAT/BigData/EconCom/BioMedCom) 978-0-7695-5137-1/13, PP 1066-1073
16.Ganapathy Mani, NimaBarit, Duoduo Liao, Simon Berkovich, “Organization of Knowledge Extraction from Big Data Systems”, IEEE (4 Fifth International Conference on Computing for Geospatial Research and Application) 978-1-4799-4321-0/14, PP 63-69
17.Joseph Rickert, “Big Data Analysis with Revolution R Enterprise”, 2011
18.Carson Kai-Sang Leung, Richard Kyle MacKinnon, Fan Jiang, “Reducing the Search Space for Big Data Mining for Interesting Patterns from Uncertain Data”, IEEE 2014, PP 315-322
19.Ajith Abraham1, Swagatam Das2, and Sandip Roy3, “Swarm Intelligence Algorithms for Data Clustering”, PP 280-313
20.Swagatam Das, Ajith Abraham, Senior Member, IEEE, and Amit Konar, “Automatic Clustering Using an Improved Differential Evolution Algorithm”, IEEE 2008, PP 218-237
21.Karthik Kambatla, GiorgosKollias, Vipin Kumar, AnanthGrama, “J. Parallel Distrib. Comput”, Elsevier 2014, PP 2561-2573
22.Yanchang Zhao, “R and Data Mining: Examples and Case Studies”, www.RDataMining.com,2014
23.H. T. Kahraman, Sagiroglu, S., Colak,“User Knowledge Modeling Data Set”, UCI, vol. 37, pp. 283-295, 2013 24.Mrigank Mridul, Akashdeep Khajuria, Snehasish Dutta, Kumar N, “Analysis of Bidgata using Apache Hadoop and
Map” , Volume 4, Issue 5, May 2014 Reduce, PP. 555-560.
25.[24] Sonja Pravilovic,” R language in data mining techniques and statistics”, 20130201.12,2013