Western University Western University
Scholarship@Western
Scholarship@Western
Electronic Thesis and Dissertation Repository
8-14-2019 11:00 AM
The Predictive Validity of IELTS Scores: A Meta-Analysis
The Predictive Validity of IELTS Scores: A Meta-Analysis
Tomlin Gagen
The University of Western Ontario Supervisor
Faez, Farahnaz F.
The University of Western Ontario Graduate Program in Education
A thesis submitted in partial fulfillment of the requirements for the degree in Master of Arts © Tomlin Gagen 2019
Follow this and additional works at: https://ir.lib.uwo.ca/etd
Part of the Educational Assessment, Evaluation, and Research Commons
Recommended Citation Recommended Citation
Gagen, Tomlin, "The Predictive Validity of IELTS Scores: A Meta-Analysis" (2019). Electronic Thesis and Dissertation Repository. 6406.
https://ir.lib.uwo.ca/etd/6406
This Dissertation/Thesis is brought to you for free and open access by Scholarship@Western. It has been accepted for inclusion in Electronic Thesis and Dissertation Repository by an authorized administrator of
Abstract and Keywords
Abstract
Thousands of education institutions worldwide rely on IELTS scores as criteria for accepting
international students whose first language is not English. Individual studies have found varying
degrees of strength of correlations and conflicting results between IELTS scores and academic
success. These conflicting results were examined through a meta-analysis, while also
investigating multiple moderating variables: research funding bias, individual skill scores, level,
field, & country of study, presence of additional English courses, and GPA timepoint.
Results from 18 studies show an approaching-small effect size of r =.227 for the relationship
between IELTS scores and post-secondary GPA. The majority of macro skills (listening,
writing, and speaking) do not reach the small effect size, however reading approaches it with an
effect size of r =.215. Most moderator analyses were inconclusive owing to the small amount of
studies, but potential differences from individual studies are examined and discussed.
144 words
Keywords:
Summary for Lay Audience
Increases in international student enrolment has led to an increased need to examine the
language tests used to ensure they have the necessary English skills to succeed in university.
One of the most popular of those tests is the International English Language Testing System, or
IELTS. The present study is a meta-analysis, or synthesis of large amounts of already published
research, into how IELTS scores used for admission relate to actual student scores once in
post-secondary education. A total of 18 different studies were aggregated and examined to look for
any evidence of publication bias from the IELTS organization, as well as any stronger links for
specific English skills (listening, reading, writing, and speaking). Additional examination is
made into if the relationships are stronger for: different majors, different levels of study
(graduate or undergraduate), different countries, presence of extra English courses, and results at
different times.
Results show that the IELTS test has a relatively small predictive effect for GPA in
post-secondary programs. No evidence of bias was found in publishing source, and overall scores
were much more predictive than any one individual skill such as listening or writing, although
reading shows a slight relationship. Due to limited sample sizes, few conclusions can be drawn
Acknowledgements
The past two years have been extremely enlightening, and I’ve learned far more than I
originally expected to when I first applied for this program. Throughout this journey I’ve been
quite lucky to be able to count on the support from the faculty, my colleagues, friends, and
family. To my advisor Dr. Faez: I am eternally grateful for your kindness, patience,
understanding, and constant positive encouragement. Every interaction we had spoke to what a
great educator you are, and I don’t think my work would have progressed quite as well with
anyone else. The rest of the Faculty of Education have also been a joy to work with, whether for
quick questions, committee reports, or free lunches and workshops. The Education Graduate
Student Association was a wonderful community to be a part of and I count myself lucky to have
met so many great and positive people through it. The other graduate students I have studied
alongside are some of the most interesting and passionate people I have met, and there are far too
many of them to name, but they have all given me hope for the future of education. Finally, I
must thank my family for everything they have done. Despite their assurances to the contrary, I
am sure that welcoming their adult son back into their home was not easy for my parents, nor
were my constant excuses of “I’m working on my thesis, I’ll do that later”. And to my lovely
partner, thank you for your patience and understanding, I definitely owe you a few hundred date
Table of Contents
Abstract and Keywords ... ii
Summary for Lay Audience ... iii
Acknowledgements ... iv
List of Tables ... vii
List of Figures ... viii
List of Appendices ... ix
List of Abbreviations and Symbols... x
Chapter 1 - Introduction ... 1
Chapter 2 – Literature Review ... 3
2.1 IELTS ... 3
2.2 Academic Success ... 5
2.3 Validity ... 6
2.4 Meta-Analysis ... 8
2.5 Previous Meta-Analyses on English Test Validity ... 9
Chapter 3 – Integrated Article ... 11
3.1 Introduction ... 11
3.1.1 Research Questions... 15
3.2 Literature Review ... 16
3.2.1 IELTS ... 16
3.2.2 Meta-Analysis ... 17
3.2.3 Conducting a Meta-Analysis ... 17
3.3 Method ... 20
3.3.1 Defining the Research Domain ... 20
3.3.2 Conducting the Literature Search ... 21
3.3.3 Coding ... 23
3.3.4 Analysis ... 25
3.4 Results ... 26
3.4.1 Descriptive Statistics ... 28
3.4.2 Research Question 1: Overall Effect ... 30
3.4.3 Research Question 2: Funding Bias... 32
3.4.5 Research Question 4A: Field of Study ... 33
3.4.6 Research Question 4B: Level of Study... 34
3.4.7 Research Question 4C: Study Location ... 35
3.4.8 Research Question 4D: Top-up Programs ... 36
3.4.9 Research Question 4E: Timepoint ... 37
3.5 Discussion ... 38
3.5.1 Research Question 1: Overall Effect ... 38
3.5.2 Research Question 2: Funding Bias... 40
3.5.3 Research Question 3: Subscores ... 40
3.5.4 Research Question 4A: Field of Study ... 41
3.5.5 Research Question 4B: Level of Study... 42
3.5.6 Research Question 4C: Study Location ... 42
3.5.7 Research Question 4D: Top-up Programs ... 43
3.5.8 Research Question 4E: Timepoint ... 44
3.5.9 Other Discussion... 45
3.5.10 Publication Bias ... 46
3.5.11 Limitations ... 47
3.6 Conclusion ... 48
3.6.1 Disclosure Statement ... 49
Chapter 4 –Conclusion ... 50
4.1 Review ... 50
4.2 Implications ... 50
4.2.1 For the IELTS organization ... 50
4.2.2 For Students/Test-Takers ... 51
4.2.3 For Admissions Offices and Institutions ... 51
4.3 Future Research ... 51
References ... 53
Appendix A: Email Template ... 64
Appendix B: Included Studies ... 65
List of Tables
Table 1: Literature Search Results ... 22
Table 2: Analysis Type Moderator Analysis ... 27
Table 3: Descriptive Statistics ... 29
Table 4: IELTS Publication Status ... 32
Table 5: Individual Macro Skill Analysis ... 33
Table 6: Moderator Analysis – Field of Study... 34
Table 7: Moderator Analysis – Level of Study ... 35
Table 8: Moderator Analysis – Country of Study ... 35
Table 9: Moderator Analysis – Country of Study without Quebec ... 36
Table 10: Moderator Analysis – Top-Up ... 37
List of Figures
Figure 1. Publications by year ... 30
Figure 2. Forest plot ... 31
List of Appendices
Appendix A: Email Template
………64
Appendix B: Included Studies
List of Abbreviations and Symbols
CMA – Comprehensive Meta Analysis
EAP – English for Academic Purposes
EFL – English as a Foreign Language
ESL – English as a Second Language
GPA – Grade Point Average
IELTS – International English Language Testing System
L1 – First Language
L2 – Second Language
TOEFL – Test of English as a Foreign Language
ρ – Spearman’s Rho
r – Pearson’s Product-Moment Correlation
β – Beta Coefficient
p – Probability Value
Z – Standard Score
Chapter 1 - Introduction
Recent years have seen a large rise in the number of international students worldwide,
with the number of international students globally doubling from 2000-2013 (Choudaha, 2017).
Many of these students want to study in the Western world and will be studying in English,
which may not be their native language. As universities recruit more and more international
students, they need some way to measure their English language ability in order to ensure they
will be able to succeed in an academic setting. One of the most popular English language tests
used for university admissions around the world is the International English Language Testing
System or IELTS (IELTS, 2017b). Thousands of universities rely on IELTS scores as one of the
key factors in determining whether to accept a new student or not. The question then arises: is
the IELTS test capable of predicting academic success?
Academic success can be a vague term and mean many different things to many people.
For the purposes of the present study and the need for numerical analysis, Grade Point Average,
or GPA will suffice. Methods of calculating GPA differ from institution to institution, but
generally all institutions offer some form of numerical or ordinal score to represent how well a
student is performing in their academic classes. By looking at correlations between IELTS
admission scores and subsequent GPAs, a measure of predictive ability can be found.
The following thesis outlines a meta-analysis examining that very construct. A
widespread literature search was conducted, hundreds of results were examined in detail, 28
studies were coded and 18 of them were included in the final analysis. These studies were
examined for a variety of moderating factors such as IELTS funding status, study location,
The results from this meta-analysis may be of use to many different stakeholders. They
may help to validate the test itself for the IELTS organization, they may help validate the use of
IELTS scores for admission decisions by post-secondary institutions, and they may even
Chapter 2 – Literature Review
2.1 IELTS
The IELTS test was first introduced in 1989 and has risen to become one of the top
English tests worldwide (Davies, 2008). It is used for admission to universities, migration to
commonwealth countries, and even by a variety of employers. There have been several revisions
throughout the past decades, but the overall format has stayed the same since 1995 (IELTS,
2014). There are over 1000 testing centers around the world and the test is administered
approximately 40 times a year. It is owned and managed by three separate language groups: the
British Council IDP, IELTS Australia, and Cambridge English Language Assessment.
The IELTS test is scored according to a band system with levels ranging from 1 to 9 by
half-band increments (IELTS, 2014). Level 1 is labelled as a “non user” wherein the participant
has no ability to communicate in English, whereas level 9 is considered an “expert user” with
full command of the language, along with fluency and complete comprehension. The test-taker
is given a band score in each of the four components (listening, reading, writing, and speaking),
and the four scores are averaged and rounded to the nearest half-band to give an overall score. In
2017 the average overall score of all test-takers worldwide was roughly a band 6 for the
academic test and 6.5 for the general training test (IELTS, 2018a). IELTS as an organization
recommends that different academic institutions choose their own cut-off bands for entrance, but
overall suggests a 6.5-7.0 minimum for academic courses and 6.0-6.5 for training programs.
The IELTS test is offered in two different versions each containing four components
(IELTS, 2014). Test takers can choose between the academic or general training test, depending
(though some institutions do accept the general training test) while the general training test is
used for immigration or evidence of English proficiency. The academic test is much more
common overall, with 78.10% of test-takers in 2017 choosing to take the academic version
(IELTS, 2018a). Each test contains the same four components: listening, reading, writing, and
speaking. The listening and speaking sections of the test are the same for the general and
academic tests, while the writing and reading sections differ.
The listening section contains a total of 40 questions and takes 40 minutes. The
test-takers hear four different recordings of various scenarios ranging from informal conversations to
academic lectures. Each recording is played only once, and the process takes approximately
thirty minutes, after which the test-takers are given 10 minutes to transfer their answers to an
answer sheet. The questions come in a range of formats from multiple choice and matching to
table completion and short answers (IELTS, 2017a).
The reading section also contains 40 questions, and students are given 60 minutes to
answer all the questions. There are three sections in total, with the total word count ranging from
2150 to 2750 words across all three (IELTS, 2017a). The academic version of the reading
section is made up of three longer readings. They are authentic materials on academic topics that
are meant to be understandable by a lay-person and do not require specialized knowledge. The
general training version consists of a larger amount of shorter texts that are more general in
nature. They are meant to represent everyday English needs, and can consist of advertisements,
newspaper articles, schedules, magazine articles, etc. For both versions of the test, students must
answer a variety of questions such as multiple choice, matching headings, sentence completion,
questions contain a third option of “not given” if there is not enough relevant information to
answer the question.
The writing section of the test takes 60 minutes and requires the test-taker to write
approximately 400 words across two different tasks. The first task in the academic version of the
test requires the test-taker to describe or explain a graphic such as a chart, table, or graph in 150
words. The second task is to write a 250-word academic style essay in response to a prompt. In
the general training version, the first task is to write a 150-word letter to someone either
explaining a situation or requesting more information. The second task is to write a 250-word
essay in response to a prompt, but the topic is generally more personal and less academic than in
the academic format of the test.
The speaking section of the test is the same across academic or general training versions
and consists of 11-14 minutes of speaking face-to-face with an examiner. The speaking test is
made up of three parts in total. First the test-taker must answer some general questions about
themselves and familiar topics such as background or hobbies over the course of four-five
minutes. In the second section, the test-takers are given a topic and 60 seconds to prepare
themselves, after which they must speak uninterrupted about that topic for two minutes. The
examiner then transitions into the third section by asking the test-taker follow-up questions on
the topic, which leads to a more formal discussion of the topic. The final section should last
roughly four-five minutes as the test-taker expands on their ideas.
2.2 Academic Success
There are many measures used to quantify the construct of academic success. Some may
specific measures of individual course grades may also be examined. For the current study any
form of data that can be correlated with scores will be included.
One of the most common measures used is grade point average or GPA (Abunawas,
2014). This can be examined at the semester, year, or overall program level. GPA has been
shown to have a high internal reliability, with previous year’s GPA being one of the most
effective predictors of current year’s GPA (Bacon & Bean, 2006). Similarly there have been
some findings that high school GPA can be a better predictor of post-secondary GPA than many
standardized tests (Zahner, Ramsaran, & Steedle, 2012). GPA has been found to also be one of
the strongest predictors of academic retention (Millea, Wills, Elder, & Molina, 2018), which is
obviously a prerequisite for academic success.
GPAs are not the perfect measure, and there are issues to making use of them as a metric.
GPA standards can vary between courses, institutions, and countries (Bacon & Bean, 2006).
While they do reflect on success in the course, they may have little external validity outside of
the course context. Using simple course grades or GPAs without the necessary context of the
course can lead to overgeneralization and chances for errors (Brown, Plonsky, & Teimouri,
2018). For the context of this current study, they are a relied upon measure, but their
imperfections and the inherent dangers of using them must be recognized.
2.3 Validity
There have been many studies examining predictive validity of various entrance exams.
Kuncel and Hezlett (2007) conducted a synthesis of meta-analyses on standardized tests used for
university acceptance at the graduate level. They found that overall standardized tests predict
the two is the strongest. They argue heavily for the overall strengths of standardized testing and
the predictive validity they offer. While language tests were not included in their synthesis, most
other major standardized tests (SAT, GRE, etc.) had positive correlations with academic success.
One important area of note when examining entrance test validity is that of survivor bias.
Given that only students with acceptable scores are offered entrance to the university, there is no
available information about how test-takers with scores below the acceptable threshold would
perform in the academic context. This has been referred to as a gatekeeping effect, and must be
recognized as a form of selection or survivor bias (Woodrow, 2006). For the context of this
meta-analysis, it is highly likely that there is little-to-no data for students with band scores below
5.0, as entry cut-off criteria create a floor effect. This results in a non-normal distribution of
scores which makes the sample not truly representative of the overall population score
distribution.
The IELTS organization checks their own internal validity of the objective tests used
throughout the year. While the writing and speaking scores are marked by professionally trained
graders, both the reading and listening are objectively scored out of 40 points each. For 2017 the
listening sections had an overall Chronbach’s alpha of 0.91, the general training reading was
0.92, and academic reading was 0.90 (IELTS, 2018b). A Chronbach’s alpha of .90 or above is
generally considered excellent (Gliem & Gliem, 2003), though some statisticians have raised
concerns that a value that high implies redundancy in test items and signals that there should be
fewer items (Tavakol & Dennick, 2011). Given that each item it supposed to be a study of
Independent researchers have also examined the validity from different viewpoints.
Hyatt (2013) surveyed test-takers in the UK and found that 88% of them felt that the test was an
accurate indicator of the necessary academic English proficiency necessary for higher education.
Similar views from students and test-takers were found in a previous study, but the staff did not
have the same opinions. Coleman, Starfield, and Hagan (2003) found that academic and
administrative staff did not agree as much as the students did that IELTS entry scores used by
universities were an accurate measure of the necessary abilities to succeed in university. This
disparity between student and staff opinion is an interesting one and adds further value to the
need for more research into the true predictive validity of IELTS scores.
2.4 Meta-Analysis
The concept of using meta-analytic techniques to aggregate information from multiple
studies has existed for over a century, with the first use being credited to a medical study from
1904 (O’Rourke, 2007; Pearson, 1904). The actual usage of the term meta-analysis did not come
about until Glass’s seminal paper where he applied the same techniques to educational research
and coined the term meta-analysis, which he succinctly explained as the “analysis of analyses”
(Glass, 1976, p. 3). He argued that educational research was expanding at a rapid rate and
needed more summaries, especially given the wide variety of contextual differences and
conflicting results across studies. Meta-analyses caught on rather quickly and became
increasingly popular, by 2005 over 2000 meta-analyses were being published each year in the
medical field alone (Sutton & Higgins, 2008). This has since increased to over 9000 medical
meta-analyses on PubMed in just the calendar year of 2014 (Ioannidis, 2016). While the domain
domain, there has also been a steady increase in the amount of meta-analyses being conducted in
the field in recent years (Oswald & Plonsky, 2010).
Berman and Parker (2002) argue that a meta-analysis should have at least one of two
goals: to summarize the data and/or to explain the variability between studies. The current study
aims to meet both those goals. There have been a significant number of studies that have
examined IELTS predictive power for academic success, many of which have found differing
results (Neumann, Padden, & McDonough, 2018). Summarizing the data alone will help to
determine the true value of IELTS as a predictor of academic success. Ideally, by examining the
moderating variables the conflicting results between studies can also be examined.
2.5 Previous Meta-Analyses on English Test Validity
While there has not yet been a meta-analysis on the predictive validity of IELTS, there
have been two separate meta-analyses conducted that examine the links between another English
language test, the Test of English as a Foreign Language (TOEFL), and academic success.
Coincidentally enough both are PhD dissertations, and a brief overview of each follows.
Wongtrirat (2010) meta-analysed 22 studies from 1987-2009 that looked at TOEFL
scores and academic achievement of international students in the USA specifically. An overall
weighted average Z score of .181 was found for TOEFL scores and GPA, and .173 for TOEFL
scores and course completion, which the author classifies as small predictive validity. No
significant difference was found between the undergraduate and graduate levels for either GPA
or course completion TOEFL correlates.
The second meta-analysis examining TOEFL scores and academic success took a more
an overall effect size of .21 was found, which is considered small. Abunawas also chose to look
at the moderating effect of studies conducted within the USA versus elsewhere in the world and
Chapter 3 – Integrated Article
3.1 Introduction
As our society becomes more and more globalized, so too does our education system and
the diversity of our students. An international education is highly prestigious and sought after in
many parts of the world, leading to many students traveling abroad for their post-secondary
studies (Altbach, 2015). English is the global lingua franca, and so too is it the language of
higher education (Arkoudis, Baik, & Richardson, 2012). For students wanting to study abroad,
English skills are a necessity, and to the institutions that they enter, having an effective way to
measure those English skills is vital. One of the most popular and common methods of testing
English language abilities is through the International English Language Testing System, or
IELTS. It is used worldwide for admissions into English speaking universities, with over three
millions participants taking the test each year (IELTS, 2017b). With the widespread prevalence
of the test for post-secondary admissions, it begs the question: how reliable is IELTS at
predicting academic success?
IELTS as a test of English language ability has existed since 1989 (Davies, 2008).
Research into various aspects of IELTS has existed for almost as long, with a large variety of
focus on different aspects of the test itself, preparatory programs, validity, etc. Much of this
research is published by the IELTS organization, who also offer funding to research pertaining to
IELTS (IELTS, n.d.). While this resource has helped to inspire and support research into the test
itself, there is an argument to be made for the danger of bias and conflicts of interest in relation
to the research they fund and publish. Evidence of funding bias, wherein studies sponsored by
industry find more beneficial results for that industry, has been found in a variety of studies
effectiveness studies (Bell et al., 2006) to a wide range of pharmaceutical efficacy studies
(Lundh, Lexchin, Mintzes, Schroll, & Bero, 2017). Even among review articles such as
syntheses and meta-analyses evidence of stronger results from authors with ties to industry have
been found (Barnes & Bero, 1998). Given that the IELTS organization has a vested interest in
positive results, another question must be asked: Do studies funded or supported by the IELTS
organization show stronger results than independent studies?
The last few decades have seen numerous studies examining the predictive validity of
IELTS, published both by the IELTS organization and peer-reviewed journals (Neumann et al.,
2018). There have been mixed results between the studies, with many finding non-significant
effect sizes or weak-moderate correlations between both overall IELTS scores and academic
achievement, as well as individual skill bands and academic achievement (eg:, Arrigoni & Clark,
2015; Kerstjens & Nery, 2000; Oliver, Vanderford, & Grote, 2012). One very recent and
comprehensive study found one of the highest correlations to date, r = .509 (Müller & Daller,
2019). These discrepancies in the literature are troublesome and need further examination. One
method of examining and attempting to explain such varying results is through a meta-analysis.
The purpose of a meta-analysis is to explain the variability among studies and summarize the
data (Berman & Parker, 2002).
The concept of a meta-analysis in education research was first introduced over 40 years
ago (Glass, 1976). Meta-analyses have been gaining popularity and in recent years are becoming
more and more prevalent within the field of second language acquisition (Plonsky & Brown,
2015). There has been a recent push in the second language research community for more
meta-analyses (Plonsky & Oswald, 2012). By applying statistical meta-analyses to corpus of data within the
whole. Meta-analyses are beneficial for determining overall means of interventions on
populations, variability across studies, and the effects (and existence of) various moderator
variables (Field & Gillett, 2010).
While the overall scores are the most commonly examined measure, the individual scores
in the different macro skills are also of importance. IELTS gives the test-takers an individual
score for listening, reading, writing, and speaking, as well as an overall composite score. Certain
macro skills may be more important than others in academic contexts. For example, Kerstjens
and Nery (2000) found significant correlations of r = .262 for the reading score and grade point
average (GPA) and r = .204 for the writing score and GPA among post-secondary students, but
no significant results for listening or speaking. However Woodrow (2006) found correlations of
r = .39 for speaking, r = .33 for writing, and r = .35 for listening when compared to GPA, while
reading scores did not have significant results. Woodrow attributes this difference to be
potentially caused by differences in the curriculum and courses covered. Woodrow’s study also
focused on education postgraduate students, who have been shown to require a high level of
language proficiency (Faez & Karas, 2017). Nevertheless, the sub-scores offered for each
individual macro skill are important and must be examined.
As Woodrow (2006) claimed, not all academic programs are created equally, nor will
they be equally demanding on a student’s language abilities. Some programs may require more
use of high-level reading and writing abilities, while others may focus more on numbers and
formulae. Similarly, graduate level study is much more likely to be intensive than the
undergraduate level. Building on these assumptions, we can also surmise that a student pursuing
a PhD in journalism would face a much higher language burden than an undergraduate
study levels as equivalent, as there will most likely be strong differences between them.
Therefore, both the discipline studied and the level of study should be examined for their
moderating effects on any results for predictive validity.
In addition to variances across fields and levels of study, there also may be variances
across individual institutions. Measuring individual institutional differences would be near
impossible at a large scale, but generalizations can be made. Abunawas (2014) found that GPA
and TOEFL scores were more strongly correlated in studies done outside of the USA. This
raises some interesting implications with regards to rigour or English necessity in programs
outside of the “Anglosphere”, or English-speaking world. Many universities in non-English
speaking countries offer programs in English and require proof of English abilities (IELTS,
2017b). Given that IELTS is used for post-secondary entrance worldwide, it is worth examining
the differences that can come from the context of English in the country of study.
While IELTS score cut-off points exist at every institution, many universities are still
looking for ways to recruit and accept more international students (Sá & Sabzalieva, 2018). One
type of program that is becoming more common is the “top-up” program, sometimes also
referred to as additional EAP, conditional entry, foundation courses, etc. These programs allow
universities to still recruit students with lower English abilities and give the students a chance to
study and live in the culture before beginning their formal education experience in their
programs of study. It benefits the students through conditional admission instead of an outright
rejection, and it benefits the institutions by giving them more academically prepared students,
who also happen to be paying extra tuition before beginning their program. Schoepp (2018)
examined the GPAs of students that participated in such programs and compared them to the
found that the students that took part in the top-up programs had significantly lower GPAs than
those who didn’t. He even uses this as evidence to state that “This is a powerful demonstration
that IELTS scores have a predictive validity towards academic success.” (Schoepp, 2018, p.
281). Similarly, Johnson & Tweedie (2017) found that initial IELTS and TOEFL scores were
better predictors of GPA than grades received from top-up programs. Given the prevalence of
these top-up programs being offered worldwide, it is worth exploring their relationship with
predictive validity and GPA.
Post-secondary enrolment is an ongoing process, lasting multiple semesters or years, and
yet many studies focus solely on first semester results (Woodrow, 2006). To truly know if
students are prepared for a lengthy program, their performance must be evaluated at multiple
time points. Student retention is one of the key factors universities are examining in improving
their graduation rates (Millea et al., 2018). Therefore, it is of vital importance to examine the
power that IELTS scores have in predicting success at different timepoints throughout a
student’s academic journey.
3.1.1 Research Questions
The following research questions were developed based on the previous literature and goals
of this study:
1. How valid are IELTS scores at predicting academic success, as measured by GPA?
2. Do studies that were published by the IELTS organization itself report stronger results
than those published by third-parties?
3. To what degree are each of the four macro skills (listening, speaking, reading, and
4. What moderating effects exist across:
a. Field of study
b. Level of study (graduate vs undergraduate)
c. Role of English (native or foreign language) in the country of study
d. Completion of a “top-up” program or entry through IELTS scores alone
e. Different time periods in their program
3.2 Literature Review
3.2.1 IELTS
The IELTS test was first introduced in 1989, as an updated version of the previous ELTS
(English Language Testing Service), which was built upon the original EPTB (English
Proficiency Test Battery) from the 1960’s (Davies, 2008). It has quickly become one of the most
popular English tests worldwide, with over three million people taking the test in 2016 (IELTS,
2017b). It consists of four sections: listening, speaking, reading, and writing. Test-takers are
scored on a band ranging from a “non user” of 1 to an “expert user” of 9 for each of the
individual skills, as well as an overall composite score. Thousands of post-secondary institutions
worldwide use IELTS for proof of English competency for speakers of other languages.
Validation of English tests has been taking place for well over 50 years (Gue &
Holdaway, 1973). The IELTS test is no exception, it is continually validated, both internally and
externally. IELTS publishes annual data on the validity of their measures, for example both their
listening and reading tests in 2017 had Chronbach’s alpha of 0.9 or higher, which is considered
extremely high (IELTS, 2018b).Surveys of test-takers find that the vast majority of them believe
3.2.2 Meta-Analysis
Meta-analyses have been a cornerstone of educational research for over 40 years (Glass,
1976). They are a synthesis of already existing research on a topic, which allows for
summarizing existing data, as well as explaining variability that exists between studies (Berman
and Parker, 2002). While the current study is a novel one, there have been two prior
meta-analyses examining standardized English tests and academic success, both of which looked at
TOEFL scores (Abunawas, 2014; Wongtrirat, 2010). Both of these PhD dissertations found
overall small effects between TOEFL scores for admission and subsequent GPAs in relevant
post-secondary institutions.
3.2.3 Conducting a Meta-Analysis
When conducting a meta-analysis, the literature review is one of the most important
steps. The databases that are searched must be carefully chosen so as to not miss any relevant
studies. In’nami and Koizumi (2010) found that LLBA was the only database to include all 24
applied linguistics journals. ERIC and MLA International Bibliography covered 22 of the 24,
Linguistics Abstract included 20, and Scopus included 18. The other databases they examined all
covered significantly fewer journals, as of 2010 at least. They offer the following advice: “a
combination of either ERIC and Linguistics Abstracts or MLA and Linguistics Abstracts must be
used, and extra attention must be paid in conducting manual searches of journals that are missing
from these databases.” (In’nami & Koizumi, 2010, p. 178).
In a more recent study, Plonsky and Brown (2015) examined which databases were most
81% of L2 meta-analyses making use of it. This was followed by LLBA (49%), PsycINFO
(41%), ProQuest Dissertations and Theses (39%), Web of Science (14%), and Google Scholar
(10%). There were other databases included in some meta-analyses, but they were included in
less than 10% of examined meta-analyses overall.
Another database that is of particular use is the IELTS Research Reports database, offered
by the IELTS organization itself and available at
https://www.ielts.org/teaching-and-research/research-reports . These reports are of studies related to IELTS and supported by the
organization. The database itself contains over 100 separate reports, many of which focus on
different forms of validity. All studies found through this database were coded as such and
examined for potential impacts of bias in more detail.
Another search method that was utilized was the backwards search or snowball technique
(Wohlin, 2014). This consists of checking the references of studies to find other similar studies
that they have cited that may be of use. A modified version known as forward snowballing was
also conducted, where papers that cite the original study are examined.
Once the literature search is completed, the researcher must then begin coding the
studies. Plonsky and Oswald (2015) advise, “The meta-analyst should be prepared to pivot,
revise, and repilot the coding sheet before and even during the coding process” (p. 111). The
initial design for a coding sheet should include the necessary identification variables such as
author(s), year, publication type, journal impact factor, study design, setting, etc. For the present
study, as many variables about the participants as possible were included, such as age, education
level, first and target languages, context, etc. The most important points of focus were on the
Once coding is complete, the data must be analyzed. There are multiple programs
specifically designed for meta-analyses, each with their own strengths and weaknesses. A 2007
study compared six different programs designed for conducting meta-analyses and found that
CMA, alongside another program named MIX, had the highest usability, with the authors also
stating: “CMA was generally most versatile, in particular in options for analysis of various types
of data.” (Bax, Yu, Ikeda, & Moons, 2007, p. 7).
During analysis, the author must make multiple important decisions, one of the most
important is which model to use. The two most common modern models used for meta-analyses
are the fixed-effects (FE) and random-effects (RE) models, which have some important
differences to consider when designing a meta-analysis (Plonsky & Oswald, 2015). Schmidt,
Oh, and Hayes (2009) summarize the main difference as FE models assume that population
parameters are equivalent across studies, while RE models assume that there are differences in
population values used. They re-analysed a series of FE meta-analyses using RE techniques and
found an average underestimation of confidence intervals by 52% across the FE meta-analyses,
as well as the 95% confidence intervals in FE meta-analyses to actually be 56% confidence
intervals on average. They recommend the use of RE model meta-analyses in virtually all
situations, as do Plonsky and Oswald (2015), therefore a random-effect model was used for this
study.
Once the data has been analyzed, it must be interpreted. Traditionally researchers have
used Cohen’s suggested initial cut-off values of r = .1 for small, r = .3 for medium, and r = .5 for
to be treated as equivalent across all domains and special considerations must be taken. Plonsky
and Oswald (2014) analyzed 175 studies across 20 correlational meta-analyses and found that the
original cut-off points do not match well within the domain of second language research. They
advise instead to use the benchmarks of r = .25 for small, r = .40 for medium, and r = .60 for
large effect sizes.
A vital part of any meta-analysis is the test for heterogeneity, which examines whether all
studies are truly evaluating the same effect. If effect sizes are to be combined, they must be
comparable, and two common methods to measure their similarity are Cochran’s Q and the more
recent I2 (Higgins, Thompson, Deeks, & Altman, 2003). Cochran’s Q is used to determine if
there is heterogeneity or not, while I2 shows the extent of any heterogeneity. Huedo-Medina,
Sánchez-Meca, Marín-Martínez, and Botella (2006) conducted a Monte Carlo simulation to
compare the effectiveness of the two methods at measuring heterogeneity and found they were
roughly equally effective, but that I2 provides more context in a much more concise manner, as I2
values are meant to directly signify the percentage of heterogeneity present (for example, an I2
value of 25.63 would indicate 25.63% heterogeneity across studies).
3.3 Method
3.3.1 Defining the Research Domain
As previously mentioned, the focus of this meta-analysis is on IELTS scores and their
relation to academic success. Academic success can be defined in a number of different ways
such as first year GPA, overall GPA, course completion, etc. Measures of GPA at different
points in time are the most common measures of academic success found in the literature
In an attempt to be as inclusive as possible, a broad level of inclusion criteria and
minimal exclusion criteria were applied
Included studies must:
1. Be of quantitative design, or include a quantitative component
2. Examine the relationship between IELTS raw scores and some measure of academic
success at English-medium universities
3. Be available in English
4. Be published after 1995, or make use of IELTS scores from after the revisions in 1995
The inclusion criteria were left very broad and general on purpose. The study sought to take
somewhat of an exploratory approach and begin with a large amount of included studies.
Berman and Parker (2002) recommend inclusion criteria include the type of study, subject
characteristics, treatment modalities, and outcome measures. These inclusion criteria mostly
meet those, as subject characteristics are not a concern for the current study.
Studies were excluded that:
1. Made use of equivalent unverifiable categories to IELTS scores (for example reporting
CEFR scores or general categories such as “intermediate” instead of actual IELTS bands)
2. Re-used datasets from previously published and included studies
3.3.2 Conducting the Literature Search
A variety of different techniques previously mentioned were used to find and identify
appropriate literature for inclusion. While the primary method of finding appropriate literature to
The results of the database literature search can be seen in Table 1.
Table 1
Literature Search Results
Database Keyword(s) Results found
IELTS Research Reports *Manual Review 101
ERIC IELTS 143
LLBA IELTS 175
Proquest Dissertations and Theses IELTS 71
PsycInfo IELTS 69
Scopus IELTS GPA 6
Individual Journals
Higher Education Research & Development IELTS 31
Higher Education Quarterly IELTS 5
Studies in Higher Education IELTS 14
Assessment in Education: Principles, Policy &
Practice IELTS 11
Language Testing GPA 15
University of Melbourne Theses Repository IELTS 59
Multi-Databases
Google Scholar IELTS GPA 2280
Western Libraries IELTS GPA 285
Note. A manual review of each individual IELTS Research Report was conducted, no search
terms were required
Given that each of the databases returned less than 200 results each, every individual
article was reviewed by title and abstract. Due to the use of the IELTS acronym in the medical
field, many of the results on Google Scholar were deemed irrelevant, even with the addition of
the search term “GPA”. The first 10 pages of results for “IELTS GPA” were examined, after
and catalogues mentioned in Table 1, a total of 3265 studies were found, not accounting for
overlap.
Based on a review of titles and abstracts a total of 42 studies were originally identified for
inclusion. Throughout the coding process 14 of these studies were removed for a variety of
reasons. Despite delays in publishing, some still used data that was from prior to the 1995
revision (e.g., Ferguson & White, 1998; Huong, 2001), some had both GPA and IELTS scores
but did not report any correlations (e.g., Kiany, 1998; Lloyd-Jones, Neame, & Medaney, 2011;
Tweedie & Chu, 2017), some used practice tests or unofficial IELTS measures (e.g., Daller &
Phelan, 2013; Khemakhem, 2016), some used other measures than GPA that were less reliable
such as observation scores of language use (e.g., Bayliss & Ingram, 2006; Ingram & Bayliss,
2007; Paul, 2007), some had mixed groups of IELTS and TOEFL combined for one correlation
(e.g., Floyd, 2015), and some did not include enough detail, even after email correspondence
(e.g., Assylbekov, 2013).
3.3.3 Coding
The coding process consisted of constructing a coding sheet in Microsoft Excel and then
entering the relevant data from the studies into it. Early versions of the coding sheet were shown
to two different colleagues familiar with the meta-analysis process, and minor revisions were
made. A wide and rich variety of data was captured, including other details that could be of
interest for further analysis such as first language of test-takers, age-range, comparison to other
language tests, etc. All of this data was categorized and entered into the Excel sheet.
As this meta-analysis was conducted for a graduate thesis, the coding was entirely
the context of the research required it. For best results, multiple coders should code each study
(Schmidt & Hunter, 2015). Nonetheless, three colleagues were approached and asked to assist
with double coding. Raters 1 and 2 have both published multiple meta-analytic studies in
various journals as well as have presented their findings at international conferences, they are
both quite familiar with meta-analyses. Rater 3 was not as familiar with meta-analytic research
and was therefore given a smaller amount of studies to code.
The three raters were trained on the coding book within Microsoft Excel, shown multiple
examples of other coded studies, and then left to do their coding without the bias of the
researcher present. A total of 14 studies were coded by the additional raters, and their results
were compared cell by cell with the author’s original coding sheet and results, excluding
bibliographical data. Rater 1 had 108/111 or 97.3% matching cells, Rater 2 had 63/66 or
95.45%, and Rater 3 had 56/56 or 100% matching, for a cumulative total of 227/233 matching
cells or 97.42% overall interrater reliability. When discrepancies arose, the raters discussed them
and reached a consensus. This resulted in 50% of the studies being coded by multiple raters, as
well as external validation of the coding sheet itself.
A total of 28 studies remained after removing inappropriate studies, and all were coded
fully. During this process two more studies that initially seemed appropriate were removed.
Arrigoni and Clark (2015) was a very promising study with many effect sizes to examine,
however they were comparing IELTS scores to what seem to be EAP courses. The authors do
argue that the courses offer more than just English language skills but given that these courses
were English skill based in nature, and do not seem to be a requirement for native-speaking
students, it did not seem appropriate to include this study. Additionally, Breeze and Miller
tests on their own. Their report is published by IELTS, so an argument could be made for the
potential validity of their scores but given that they were not fully official IELTS test scores, the
study was removed.
Three of the studies (Feast, 2002; Phakiti, 2008; Thorpe, Snell, Davey-Evans, & Talman,
2017) made use of regression analysis as opposed to correlations, and thus reported beta
coefficients (β) instead of r values. In order to analyse these results, the data needed to be
converted. Peterson and Brown (2005) offer the following formula to convert beta coefficients
into r values:
𝑟 = β + .05λ
Where λ is equal to 1 if the β value is non-negative and 0 if the β value is negative. They
do warn that this formula works best with β values of ±.50, which is valid for two of the three
studies, the third study (Thorpe et al., 2017) reported beta coefficients much higher, and thus a
valid r value was not calculable. Therefore, this study was removed from analysis.
The remaining 25 studies were inputted into the Comprehensive Meta Analysis software
(version 3.3.070) and analysed. A total of 3475 students from 31 subgroups across 24 of the
studies reported on overall effect sizes; one study, Humphreys et al. (2012), did not report an
overall effect size, but just effect sizes for each of the four macro skills. This study was used for
examination of the individual macro skills, but not included in the other analyses. Including the
51 students from their study brings the total included students up to 3526 over 32 subgroups
from 25 studies.
The meta-analytic software Comprehensive Meta Analysis, or CMA (available at
https://www.meta-analysis.com/ ) was used for analysis of the data. It is a powerful tool that
allows for great control over the data as well as assistance with the meta-analysis process itself.
It allows a more user-friendly approach than using R or SPSS, as it is designed solely for
meta-analyses.
3.4 Results
An overall effect size of r= .299**, p= .000 was found, 95% confidence interval of [.207,
.386], and Z= 6.155. However, it must be noted that this is a composite of Pearson’s
correlations, Spearman’s rho, regression beta coefficients, and a singular t-test. While both
Pearson’s correlation and Spearman’s rho report correlations, they are distinctly different
statistics and must be acknowledged as such.
There are formulae to convert the two measures between each other. Lajeunesse (2013)
recommends the following formula to convert Spearman’s rho (ρ) to Pearson’s r (if the sample
size is under 90, otherwise he equates them):
𝑟 = 2sin (𝜋𝜌 6)
And de Winter et al. (2016) make use of the following conversion for Pearson’s r to
Spearman’s rho:
𝜌 = 6
𝜋arcsin ( 𝑟 2)
However, one of the coded studies did report both measures for the same correlation.
When using those values in the above formulae, the results do not match their reported values.
This is most likely due to the non-normal distribution of the data, as there is the previously
mentioned floor effect of IELTS admissions cut-off scores. Therefore, these formulae were
deemed unreliable for this meta-analysis, and conversions were not made.
To determine if the two correlations offered significantly different results, a moderator
analysis was conducted between the analysis types. For the sake of posterity, the regression and
t-test data were also included in the analysis as well, the results of which can be seen in Table 2.
Table 2
Analysis Type Moderator Analysis
Analysis type k r 95% CL Z p
Pearson’s r 17 .239** [.165, .310] 6.200 .000
Spearman’s rho 4 .586** [.326, .764] 3.948 .000
Regression 2 .371** [.237, .491] 5.159 .000
t-test 1 .140* [.030, .246] 2.498 .012
Note. Qbetween= 13.378, df= 23, p=.004
Given that Qbetween reaches significance at the p<.01 level, these are significant
differences, therefore Pearson’s r alone was chosen to focus on. While removing the Spearman’s
rho results does eliminate a significant amount of studies, four out of 25, it would be
inappropriate to treat the two different correlations as equivalent. Conducting secondary analysis
of each measure for both correlations was examined but given that only four studies in total used
Additionally, the two regression studies appear to be significantly distinct from the
Pearson’s r results. This could be due to the complicated nature of beta coefficients and the
many other variables that can affect them within their relevant models (Peterson & Brown,
2005). Due to the significant difference and dangers of including them, they were also removed
from the study. Finally, the single t-test was also removed in order to focus solely on studies that
reported a Pearson’s correlation. While removing so many studies does cause issues of
comprehensiveness, it raises the strength of the results by focusing solely on one analysis and
variable type.
One final note must be made that all studies except for one (Humphreys et al., 2012)
reported a correlation using the overall composite score, as well as occasional sub-scores for
individual macro skills. Humphreys et al. (2012) reported only the sub-scores with no composite
score correlation. The composite score is similar to an average, and arguments could be made
for averaging the other scores to impute the data (Lajeunesse, 2013). However, when trialling
averaging imputed data with other studies, the imputed data did not match exactly with the
overall correlation. This could be due to rounding with overall composite scores, as all IELTS
bands are rounded up or down to the nearest half-band at the very most, which would provide
less accuracy. To err on the side of caution and not include inaccurate data, the overall scores
were not imputed. Therefore, results from this study are only included when individual skills are
examined for research question 3 and were not part of any of the overall calculations or other
moderator analyses.
A total of 18 studies were included in the final meta-analysis, and the descriptive
statistics are outlined in Table 3.
Table 3
Descriptive Statistics
Authors Year Publication N Country of
Study
Cotton & Conrow 1998 IELTS Report 26 Australia
Hill, Storch, & Lynch 1999 IELTS Report 35 Australia
Kerstjens & Nery 2000 IELTS Report 113 Australia
Dooey & Oliver 2002 Journal 65 Australia
Woodrow 2006 Journal 62 Australia
Yen & Kuzma 2009 Journal 61 UK
Avdi 2011 Journal 40 Australia
Humphreys, Haugh, Fenton-Smith,
Lobo, Michael, & Walkinshaw 2012 IELTS Report 51 Australia
Oliver, Vanderford, & Grote 2012 Journal 376 Australia
Arcuino 2013 PhD Thesis 29 USA
Garinger & Schoepp 2013 Journal 181 UAE
Riazi 2013 Journal 60 Australia
Yixin & Daller 2014
Conference
Paper 57 UK
Schoepp & Garinger 2016 Journal 241 UAE
Johnson & Tweedie 2017 Chapter 33 Qatar
Neumann, Padden, & McDonough 2018 Journal 54
Quebec (Canada)
Schoepp 2018 Journal 953 UAE
Müller & Daller 2019 Journal 46 Australia
Overall there were 11 journal articles, four IELTS research reports, one PhD thesis, one
conference paper, and one book chapter. The studies were conducted across multiple continents,
with the majority taking place in Australia. There were four authors with multiple works
included: Rhonda Oliver, Michael Daller, Dawn Garinger, and Kevin Schoepp, but all of their
datasets appear to be unique. Participant pool sizes ranged widely from 26 – 953 students per
been an overall slight upward trend in number of publications over time. This can be seen in
Figure 1.
Figure 1. Publications by year
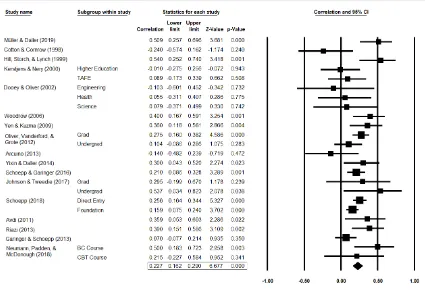
3.4.2 Research Question 1: Overall Effect
An overall effect size of r= .227 was found, 95% confidence intervals of [.162, .290], Z=
6.677, p = .000, from 29 effect sizes across 17 studies with 2432 students total. This is not quite
a small effect size, as it does not reach the updated .25 cut-off point (Plonsky & Oswald, 2014).
The 95% confidence interval does pass it by a significant margin, so it is safe to say that this
effect size is approaching small, or nearly small. The overall results and effect sizes of each
individual study can be seen in the forest plot in Figure 2.
Regarding heterogeneity, a Q-value of 45.353 was calculated, p=.004. This leads to an I2
value of 49.286, which is a moderate level of heterogeneity (Higgins et al., 2003), and discussed
further in the discussion section.
0 1 2 3 4
Figure 2. Forest plot
Of the 17 included studies, one (Cotton & Conrow, 1998) is bordering on being a
negative outlier; the upper bound of its 95% confidence level is equal to the lower bound of the
overall effect size 95% confidence level at a value of .162. Upon closer examination at four
decimal places, it is slightly higher (.1624 for the individual study, .1616 for overall), so the
confidence intervals do intersect, albeit to an almost negligible degree. Viechtbauer and Cheung
(2010) warn against simply deleting outliers and suggest looking deeper into the numbers. Upon
a more in-depth review of the article (Cotton & Conrow, 1998), one issue immediately stands
out. This study has an overall relatively small sample size of 26, which makes it the smallest
times throughout the paper, and repeatedly advise that their results are based upon such a small
group. They draw attention to a few individual students who were outliers within the study itself
and heavily affected the overall data, but were included nonetheless. Additionally, the authors
note that theirs is the first predictive validity study of IELTS done after the 1995 revision, and
perhaps there was still some fine-tuning going on with the early scores.
While the weighting calculations take the small sample size into consideration, an
additional analysis was run excluding this study to determine if there was a significant effect.
With it removed, the overall r value raises to r= .236 with a Z value of 7.192. While this is an
increase, it is not one of overly significant proportions, therefore the study was included for all
relevant analyses.
3.4.3 Research Question 2: Funding Bias
To answer the second research question, if there was a publishing bias from the IELTS
organization itself, a moderator analysis was conducted between those studies published by
IELTS and those published elsewhere. For this analysis only, studies themselves were used as
the unit of analysis. For all other analyses individual subgroups were examined, but this analysis
is focused on the meta-level study variable itself, so the subgroups within the studies were
averaged for an overall study measure. The results can be seen in Table 4.
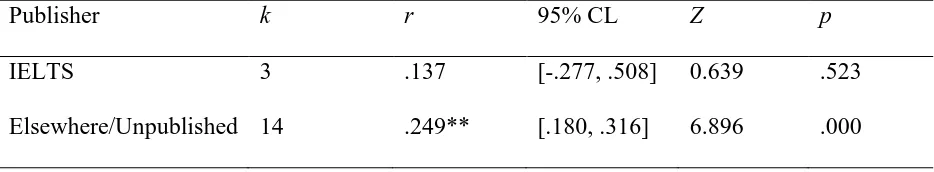
Table 4
IELTS Publication Status
Publisher k r 95% CL Z p
IELTS 3 .137 [-.277, .508] 0.639 .523
Note.Qbetween= 0.652, df= 16, p= .419
Overall the small number of studies and lack of statistical significance results in few
conclusions that can be reliably drawn from this data. While there is no evidence of higher
results from IELTS Research Reports, there is also no evidence of a lack of bias.
3.4.4 Research Question 3: Subscores
To examine the relationship between individual skills IELTS scores and GPA, four
separate analyses were conducted examining each outcome. Most of the studies included both
overall or composite scores alongside individual skill scores, but four of the studies (Arcuino,
2013; Hill, Storch, & Lynch, 1999; Müller & Daller, 2019; Yixin & Daller, 2014) only included
the composite scores, so they were not included in the results in Table 5.
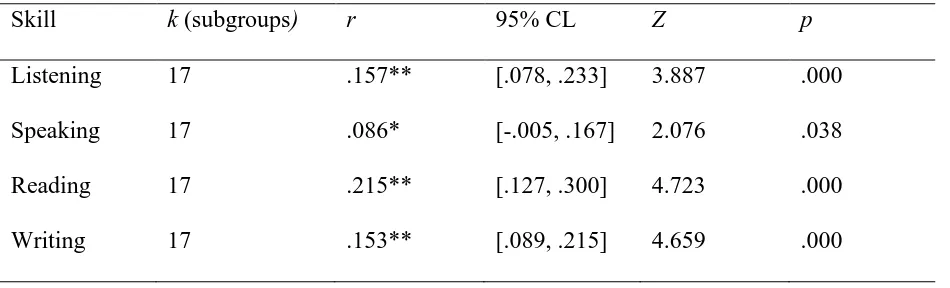
Table 5
Individual Macro Skill Analysis
Skill k (subgroups) r 95% CL Z p
Listening 17 .157** [.078, .233] 3.887 .000
Speaking 17 .086* [-.005, .167] 2.076 .038
Reading 17 .215** [.127, .300] 4.723 .000
Writing 17 .153** [.089, .215] 4.659 .000
While each of the results are significant, none of them cross the r= .250 threshold
necessary to be considered a small effect size. The reading r=.215 is the strongest of the
subskills, and possible reasons behind this will be discussed in the discussion section.
To examine the first moderator, studies were coded based on the program the students
were enrolled in. Many studies made use of overall mixed samples and could not be broken
down for individual analysis. Those that did were classified into broad categories and the results
of the moderator analysis can be seen in Table 6.
Table 6
Moderator Analysis – Field of Study
Major k (subgroups) r 95% CL Z p
Business 5 .226* [-.034, .404] 2.273 .023
Healthcare 3 .336* [.071, .557] 2.458 .014
Social
Sciences
1 .400** [.167, .591] 3.254 .001
STEM 2 .009 [-.344, .359] 0.046 .964
Note. Qbetween= 3.796, df= 10, p= .284
Given the relatively small amount of studies in each category, no strong definitive
conclusions can be drawn. Studies using business students seem to be almost perfectly
representative of the overall sample however, with business majors have a value of r= .226,
while the overall result was r= .227.
3.4.6 Research Question 4B: Level of Study
To examine the predictive validity of IELTS at different level of education, studies were
coded for study level of the relevant student population. Categories were initially quite broad but
then collapsed down to simply graduate or undergraduate level. Any program that required prior
requiring a prior bachelor’s degree. A number of studies made use of mixed samples containing
both undergraduate and graduate students, they were not included in this moderator analysis, the
results of which can be seen in Table 7.
Table 7
Moderator Analysis – Level of Study
Level of Study k (subgroups) r 95% CL Z p
Undergraduate 14 .202** [.127, .275] 5.206 .000
Graduate 5 .271** [.127, .404] 3.617 .000
Note. Qbetween= 0.711, df= 18, p= .399
While the values themselves seem to show a slightly higher correlation for graduate study
as opposed to undergraduate, the Qbetween value is quite low and was not significant, so it can
not be reliably assumed to be a moderating variable.
3.4.7 Research Question 4C: Study Location
Study location was coded as another moderator, dividing studies into completed in an
English-speaking country or not. For this coding, Australia, the USA, and the UK were
considered English-speaking countries, while the UAE and Qatar were considered non-English
speaking. Given that Quebec’s official language is solely French, it was treated as non-English
speaking for initial coding, the results can be seen in Table 8.
Table 8
Moderator Analysis – Country of Study
Country k (subgroups) r 95% CL Z p
Non-English 8 .207** [.131, .280] 5.283 .000
Note. Qbetween= 0.089, df= 23, p= .765
While there does not appear to be a significant difference, the English speaking
correlation is virtually the same as the overall correlation, r= .226 and r= .227 respectively.
Therefore the studies conducted in English countries may be seen as more representative of the
true predictive validity than those outside.
Analysis was also conducted with the Quebec study removed, as it is in Canada and a
unique language context in its own right. That analysis can be seen in Table 9.
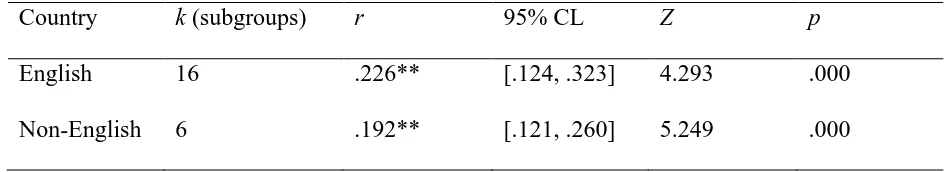
Table 9
Moderator Analysis – Country of Study without Quebec
Country k (subgroups) r 95% CL Z p
English 16 .226** [.124, .323] 4.293 .000
Non-English 6 .192** [.121, .260] 5.249 .000
Note. Qbetween= 0.306, df= 21, p= .580
Overall the Qbetween value does not change significantly, and even loses power. The
Quebec study does not seem to have a significant effect on changing the results of this analysis.
3.4.8 Research Question 4D: Top-up Programs
To examine the effectiveness of “top-up”, foundation, preparatory, preliminary, etc.
programs, studies were coded as to whether the students had to take one of those programs
or did not make mention of any such necessary courses, so only a few studies could be examined
for moderator analysis, results of which can be seen in Table 10.
Table 10
Moderator Analysis – Top-Up
Entry k (subgroups) r 95% CL Z p
Direct 3 .252** [.182, .320] 6.858 .000
EAP Top-up 2 .135** [.057, .211] 3.393 .001
Note. Qbetween= 4.90*, df= 4, p=.027
This result is the sole moderator analysis to reach statistical significance, with the caveat
that it really only includes 5 total effect sizes. While these results initially seem promising, the
small sample makes it unable to be reliably confirmed. This is examined more in depth in the
discussion section.
3.4.9 Research Question 4E: Timepoint
The final moderator analysis looked at different time points and the relevant predictive
validities. Two of the studies, (Dooey & Oliver, 2002; Yen & Kuzma, 2009) were longitudinal
in nature and had results for multiple time points. For all other analyses, these results were
pooled so as to not be treated as independent samples. However, for this specific analysis those
time points were treated as independent, which can create issues of validity as the groups are
comprised of the same students and initial IELTS scores, and not truly independent. This was
the most efficient way include the longitudinal studies for comparative analysis however.
Table 11