Digestive Physiology of Steers Grazing Fertilized and Non-
fertilized Blue Grama Rangeland
L.J. KRYSL, ML. GALYEAN, M.B. JUDKINS, M.E. BRANINE, AND R.E. ESTELL
AbStr8Ct
Eight fSeld trhls [nrly August 19%3 (EAUC83), l8tc August 1983 (LAUCS3), crvly November 1983 (ENOV83), ervly J8nuuy 1981 (KJANSQ), May 1984 (MAY84), l8tc July 19(14 (LJULg4), late August 1981 (LAUGM), htc November 19g4 (LNOV84)J were conducted on blue gr8m8 (Bouteloua gracffis) nngehnd in soutb- em r8ngelmd in southern New Mexico to ex8mine rel8tionships among nitrogen @I) fertilization of forclge, st8ge of plant growth, diet bohnierl 8nd chemical compoeition, forge inhke, digest8 kinetics, 8nd run&81 ferment8tion in beef steers. A fertilized p8s- ture (45 kg N/b8) w8a ev8lurtedduring the ye8r of 8nd ycrv 8fter fertilizer 8ppliation 8nd compared witb 8n 8dj8cent nonfertilixed p8sture. Two esopb8ge81- 8nd 4 rumin8lly crnnulrted steers/prs- ture were used in 8 split-plot design. Diehry orguric matter per- centage ~8s not 8ffected by fertiliz8tion; however, fiber compo- nents incrcrwd 8s phnts 8pprorcbed dorm8ncy on botb fertilized 8nd nonfertilixed mngehnd. Dietuy crude protein levels were numerierlly higher in the fertilized p8sture witbin 8lI tri8ls. Fertili- z8tion b8d no consistent effect on nte or extent of in vitro organic m8tter digestibility. Fertilixation increased (p<O.OS) mmhl ammoni8 (NHs) concentrntions in 8lI but one trial 8nd levels were 8deqtute for mrxim8l microbhl protein synthes~, however in tbe nonfertilized pasture, nunin8l NHs levels were potenthlly in8dt qurrte during periods of donnmcy. RumhI pH ~8s numerhlly bigber for steers on tbe fertilized p8sture tb8n for those on tbe unfertilized preture acb sunpling trhl except LNOVS4. Fertiliu- tion b8d little effect (JQO.05) on tot81 volatile f8tty 8cid (VFA) concentntion or mohr proportion of individual acids. Total rum- in81 VFA concentmtion WM bigbest in steers during periods of 8ctive pl8nt growtb. Voluot8ry orgmic matter intake wu ustully muffected (p>O.OS) by fertllix8tion except in EJAN 84 when intake was higher (p<O.OS) in tbe fertilixed prsture 8nd LNOVS4 wben int8ke wu higher (p<O.OS) for steers gr8xing tbe not&r& ixed p8sture. Orgrnic autter int8ke by steers 8verclged 21.8 g/kg body weight (BW) 8nd 21.6 g/kg BW l croes the 8 trhh for fertil- ixed 8nd nonfertilized p8stures, respectively. Inhke in both p8s- tures declined with 8dvmdng se8son. Particul8te purge r8te (PPR) WM not different between tre8tments (mO.05) during ENOV83, MAYSQ 8nd LNOVSI. However, PPR ~8s f8ster (X0.05) for steers gruing the fatilixed tb8n in the nonfertilized p88ture during the remting 5 sampling periods. Correspond- ingly, retention time of digest8 in tbe g88trointestin8l hrct ~8s reduced for steers gr8xing the fertilized prsture during these 5 trhls. Kstim8ted grstrointesthl fill ~8s uruffected (mO.05) by tre8tment except during tbe EAUG83 8nd LAUGH trhls when steers gmxing fertilized pasture bad reduced (KO.05) fill com- pued with steers gr8xing nonfertilized p8sture. Fluid purge rate (FPR) did not differ (p>O.OS) between treatments for any trhls except in LAUG84 when steers in the fertilized p8sture bad a lower (X0.05) FPR tb8n steers in the nonferthed p8sture.
Key Words: for8ge quality, fertiliution, digest8 kinetic8
At the time of this research, authors were graduate assistant, associate professor and
F
duate assistants respectively, Department of Animal and Range Sciences, New exlco State University, Las CNIXS 88003. Kay81 is currently assistant professor, Dapattment of Animal Science, University of Nevada-Rena. The authors wish to acknowledge the assistance of Drs. J.D. Wallace, G.B. Donart, R.D. Pieper, and Mr. E.E. Parker.
Journal article No. 121 I of the New Mexico Agr. Exp. .%a., Las CNCCS. Manuscript accepted 2 June 1987.
Livestock production from native rangeland depends on diet quality and availability. Various improvement practices and land- use strategies have been implemented in an attempt to manipulate vegetative resources to maximize animal production.
Fertilization of rangeland has been employed to increase forage quantity and quality and consequently, animal production. Humph- rey (1960) indicated range forage production was limited more by nitrogen(N) deficiency than by any other element. Nitrogen fertili- zation has increased herbage production on native rangeland (Rogler and Lorenz 1965, Burzlaff et al. 1968, Goetz 1969). Under proper conditions, N fertilization of blue grama (Boureloua graci- lis) dominated rangeland has resulted in a several-fold increase in annual herbage production (Banner 1969, Reed 1969, Schickedanz
1970, Kelsey et al. 1973, Pieper et al. 1974, Donart et al. 1978). Furthermore, diet quality (Kelsey et al. 1972, 1973; Havstad et al. 1979; Wallace et al. 1983) and animal production (Schickedanz 1970; Donart et al. 1978.1983) have been enhanced by N fertiliza- tion of blue grama rangeland.
Another important consideration regarding livestock produc- tion on native rangeland is the influence of advancing season on decline of nutritive value and diet selection of grazing ruminants. Such information is paramount to development and implementa- tion of grazing schemes and supplementation programs. Several authors (Cook 1972, Pieper et al. 1978, Kothmann 1980, McCol- lum et al. 1985) have examined the influence of advancing season on nutritive value of range forages; however, few studies (McCol- lum et al. 1985) have related diet quality to ruminal characteristics of the grazing herbivore. Because the rumen is the primary site of forage degradation, ruminal fermentation end-products and pH of ruminal contents may have profound effects on fiber digestion (Mertens 1979), microbial protein synthesis (Satter and Slyter 1974), and ultimately energy and protein available for mainte- nance, growth, and reproduction of grazing animals.
To improve forage utilization and productivity from native rangelands, it is necessary to measure or at least approximate components that affect livestock production. Forage intake by the grazing ruminant may be the most important of these components. It is essential that factors regulating forage intake be understood in order for livestock managers to make responsible management decisions to enhance livestock productivity and profitability.
Cordova et al. (1983) reviewed literature on intake of grazing sheep and cattle and found values ranging from 1 to 2.8% of body weight. Other researchers have examined effects of advancing season on quality and intake of legumes forages (Van Soest 1965, Thornton and Minson 1973). Only limited information is available on chemical and botanical composition of the diets of freely graz- ing ruminants and associated changes in forage intake (Holechek and Vavra 1982, McCollum and Galyean 1985b).
Rate of digesta disappearance from the gastrointestinal tract of ruminants encompasses both rate of digestion and rate of passage of undigested residues (Ellis 1978, Van Soest 1982). Furthermore, Ellis (1978) concluded ruminal volume, volume occupied by undigested residues and factors influencing ruminal turnover were the major determinants of forage intake. Hence, studies examining the interrelationships of these factors in grazing ruminants should provide greater insight into possible mechanisms controlling for- age intake.
study to relate dietary changes in steers grazing N fertilized and nonfertilized blue grama rangeland during the year of and year after fertilization with changes in seasonal forage quality, ruminal fermentation, intake, and digesta kinetics.
Materials and Methods
Study Area
Field data for this study were collected at the Fort Stanton Experimental Ranch located in the foothill-mountain region between the Sierra Blanca and Capitan Mountains in southern Lincoln County, New Mexico. Elevation of the area is variable, ranging from 1,900 to 2,300 m, with the study pastures at 1,950 m. Mean temperature is 1 lo C, with a mean maximum of 18.6” C and a mean minimum of 2.2” C. The average frost-free period is 161 days, with average first frost date of 10 October and average last frost date of 2 May. Mean annual precipitation is 35 cm with approximately 65% of the precipitation occurring between mid- July and late-September, which coincides with the growing season of the major forage species in the region (Pieper et al. 1971).
The study area was a 117-ha pasture fenced into 2 paddocks which were similar in terms of topography and vegetation. One pasture (5~ha) was fertilized biennially (single application) with 45 kg actual N/ha (dry urea) just before the growing season. During the present study, fertilization occurred 18 June 1984.
Historically, a biennial fertilization scheme was implemented in 1979. The pasture was fertilized annually from 1968 to 1979.
The pastures were similar in vegetative composition (Wallace et al. 1983). Vegetation is dominated by an overstory of pinyon pine (pinus edulis) and various juniper species (Juniperus spp.). Major understory grasses are blue grama, sideoats grama (Bouteloua curtipendula), hairy grama (B. hirsuta). sand dropseed (Sporobo- lw cryptandrus), mat muhly (Muhlenbergia richardsonii), ring
muhly (M. torreyi), wolftail (Lycurus phleoides), western wheat- grass (Agropyron smithi), and various panic grasses (Panicum spp.). Important forbs and shrubs are carruth sageworth (Artemi- sia cam&hi). scarlet globemallow (Sphaeralcea coccinea), Dakota verbena (Verbena bipinnetifido), nuttall milkvetch (Astragulos nuttalhanus), buckwheat (Eriogonum spp.), fendler bladderpod (Lesquerella fendleri), kochia (Kochia scoparia), portulaca (Por- tulaca pilosa), sandlily (Mentzeha humilis). plains zinnia (Zinnia
grandtfTora), broom snakeweed (Xanthocephalum sarothrae) and yucca (Yucca elata; Lebgue and Allnd 1985).
Field Trials
Eight trials were conducted in 1983 and 1984 [early August 1983 (EAUG83), late August 1983 (LAUG83), early November 1983 (ENOV83), early January 1984 (EJAN84), May 1984 (MAY84), late July 1984 (LJUL84), late August 1984 (LAUG84), late November 1984 (LNOV84)]. These sampling times were chosen to observe the effect of N fertilization over a broad range of plant maturity.
During each trial, 2 esophageal-cannulated steers-pasture and 4 ruminally-cannulated (10.2 cm id cannula) steers/pasture were allowed to freely graze study pastures. A salt-mineral mix (50% dicalcium phosphate, 45% salt and 5% cottonseed meal) was pro- vided free choice in each pasture. Esophageal-cannulated steers were placed on pasture a minimum of 1 wk before each trial, while ruminally<annulated steers were allowed a 2-wk minimum adap- tation period.
Diet samples were collected 3 times during the first 2 d of each 9-d trial. The 2 esophageal ftstulated-steers in each pasture were located during predawn @600-0700 h) and pre-sunset (1900-2000 h) periods. Once located, steers were bagged and allowed to graze for 30-45 minutes. Steers were not denied feed or water before collections. Following collection, 20% aliquot of each extrusa sample was placed in a plastic bag and stored frozen for future botanical and nutrient analyses. Remaining masticate was compo- sited by treatment, labeled with ytterbium (Yb) for determination of particulate passage rate and fecal output. Labeling procedures have been described in detail by Teeter et al. (1984) and McCollum and Galyean (1985a). Briefly, composite masticate samples were washed to remove salivary contaminants and soaked for 24 h in an aqueous solution containing 2.5 g YbCIs l XHsO/ liter. After soak-
ing, excess fluid was poured off and the remaining sample was washed with deionized water hourly for 6 h to remove unbound Yb. Labeled forage was divided into qua1 portions with 1 aliquot/ - treatment removed from Yb dose determinations.
Rumen fluid samples from 4 steers in each pasture were collected the third day of each trial. At sunrise (0600-0800 h), a 250-ml sample of whole ruminal contents was withdrawn after thoroughly
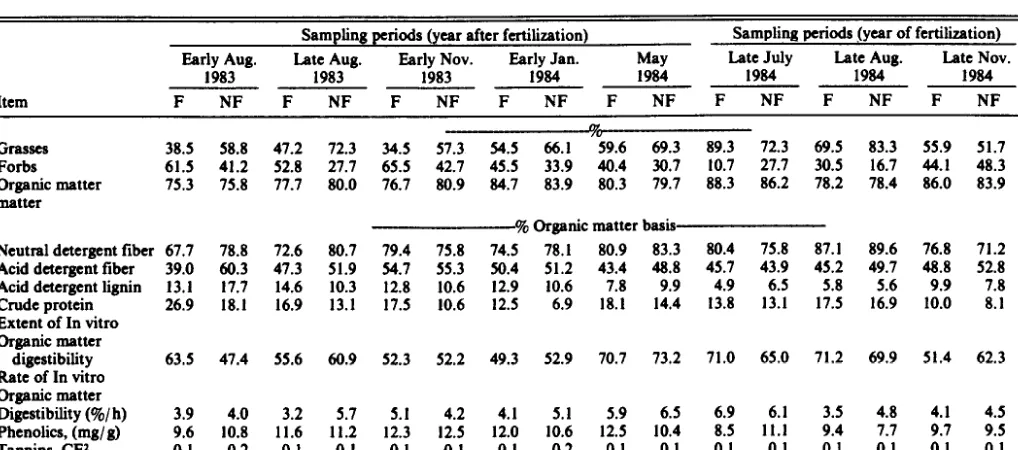
Table 1. Botanical and nutritional composition of steer dkta from fertllhed (F) and nonfertillzed (NF) blue pme morelend during the YCU of end after fettillutlon.l
Item
Sampling periods (year after fertilization) Sampling periods (year of fertilization) Early Aug. Late Aug. Early Nov. Early Jan. May Late July Late Aug. Late Nov.
1983 1983 1983 1984 1984 1984 1984 1984
F NF F NF F NF F NF F NF F NF F NF F NF
Gm3C3 Forbs Organic matter matter
Neutral detergent fiber Acid detergent fiber Acid detergent @in Crude protein Extent of In vitro
m
38.5 58.8 47.2 72.3 34.5 57.3 54.5 66.1 59.6 69.3 89.3 72.3 69.5 83.3 55.9 51.7 61.5 41.2 52.8 27.7 65.5 42.7 45.5 33.9 40.4 30.7 10.7 27.1 30.5 16.7 44.1 48.3 75.3 15.8 71.7 80.0 76.7 80.9 84.7 83.9 80.3 79.7 88.3 86.2 78.2 78.4 86.0 83.9
% Organic matter basis
67.7 78.8 12.6 80.7 79.4 75.8 14.5 78.1 80.9 83.3 80.4 75.8 87.1 89.6 76.8 71.2 39.0 60.3 41.3 51.9 54.7 55.3 50.4 51.2 43.4 48.8 45.7 43.9 45.2 49.7 48.8 52.8 13.1 11.7 14.6 10.3 12.8 10.6 12.9 10.6 7.8 9.9 4.9 6.5 5.8 5.6 9.9 7.8 26.9 18.1 16.9 13.1 17.5 10.6 12.5 6.9 18.1 14.4 13.8 13.1 17.5 16.9 10.0 8.1
Organic matter
digestibility 63.5 41.4 55.6 60.9 52.3 52.2 49.3 52.9 70.7 73.2 71.0 65.0 71.2 69.9 51.4 62.3 Rate of In vitro
Organic matter
Digestibility(%/h) 3.9 4.0 3.2 5.7 5.1 4.2 4.1 5.1 5.9 6.5 6.1 3.5 45
Phcnolics, (mg/g) 9.6 10.8 11.6 11.2 12.3 12.5 12.0 10.6 12.5 10.4 ;;
11.1 9.4
;; ;:: 9:5 Tannins, CE* 0.1 0.2 0.1 0.1 0.1 0.1 0.1 0.2 0.1 0.1 0:1 0.1 0.1 0:1 0.1 0.1
Table 2. Rumhal fermentation meuuremeata in &en grazlog ktUized (F) and nonfertilhd (NF) blue m WC- the JCU of d YCU after fertilintion.
Sampling periods (year after fertilization) Sampling periods (year of fertilization)
Early August Late August fiY Late July Late August Late November
1983 1983
Early November Earl:~;uary
1983 1984 1984 1984 1984
Item F NF SE’ F NF SE F NF SE F NF SE F NF SE F NF SE F NF SE F NF SE
Ruminal
PH 6.3 6.2 0.1 6.Sb 6.1’ 0.1 6.Sb 6.0’ 0.1 6.5 6.4 0.1 6.1 5.9 0.1 6.2 5.9 0.1 6.4b 6.0’ 0.1 6.1 6.3 0.1
Ammonia-
& lOOmi) 14.9b 9.2’0.9 ll.Zb 5.5’ 0.7 6.2b 2.2 0.4 5.3b 3.2’ 0.5 13.9b 7.8’ 1.0 10.3b 7.6’ 0.3 19.6b 12.6’ 1.0 5.Eb 3.0’ 0.9
Total
VFA, mM 102.0 103.7 4.2 91.9 %.O 2.0 85.1 81.8 2.9 80.4 78.7 2.4 89.9 88.4 4.5 65.6 68.9 2.8 64.5 62.3 2.8 74.4 72.6 7.2
moles/ IO0 moles
Acetate 65.7 65.3 0.5 68.Eb 70.3’ 0.3 72.9 73.4 0.9 73.4 75.5 0.6 66.5 66.3 0.6 67.6 68.9 0.6 64.5 62.3 2.0 74.4 72.6 0.7
Propionate 18.0 18.7 0.3 17.2 16.7 0.4 17.7 17.7 0.7 18.4 17.4 0.5 19.2 18.4 0.5 18.6 17.6 0.5 18.9 18.3 0.5 16.2 10.4 0.2
Butyrate 11.5 12.4 0.4 9.4 9.9 0.5 9.0 8.9 0.5 7.2 7.0 0.3 10.5 12.0 0.6 10.2 10.6 0.3 12.0 16.0 2.2 8.0 8.7 0.2
Minor
acidsd 4.Eb 3.6’ 0.2 4.6b 3.1’ 0.2 0.4 0.1 0.1 l.Ob 0.1’ 0.2 3.8 3.3 0.1 3.Sb 2.9’ 0.1 4.6b 3.4’ 0.2 l.4b 2.3’ 0.2
‘Standard error, n = 16 “Means within trials differ
dMinor acids = isobutyratc + valerate l isovaleratc
hand-mixing contents. Ruminal pH was measured immediately with a combination electrode, after which samples were strained through 8 layers of cheesecloth, acidified (1 ml 7.2 N H&O,/ 100 ml strained fluid) and frozen. After initial sampling, each steer was dosed intraruminally with 200 ml of cobalt ethylenediaminetetraa- cetic acid solution (CoEDTA; Uden et al. 1980) as a fluid passage marker. Steers were allowed to return to normal grazing activities and additional 2%ml digesta samples were obtained at 4,8, 12, and 24 h postdosing.
On day 4 of each trial at sunrise (0600-0800 h), each ruminally cannulated steer was dosed intraruminally with its respective por- tion of Yb-labeled masticate. Dose was placed in the middorsal region of the rumen. Because of variation in amount of masticate collected and Yb binding efficiency, the amount of forage and Yb administered varied among trials. In EAUG83, LAUG83, LNOV83, WAN84, MAY84, LJUI.84, LAUG84 and ENOV84, steers graz- ingfertilized pasture weredosed with 3.2,2.5,2.6,2.6,2.1,2.1,2.6, and 3.0 g Yb, respectively. Steers grazing nonfertilized pasture were dosed with 2.0,2.3,2.4,2.6,2.5,2.7,2.0 and 2.5 g Yb for the respective dates mentioned above. After dosing, steers were allowed to resume normal grazing activity and rectal grab samples were collected at 0,4,8,12,16,20,24,28,32,36,42,48,54,60,72,
84,96, 108, and 120 h postdosing. Individual grab samples were identified by steer and collection time and frozen.
Laboratory Analyses
Botanical composition of diets was determined using procedures outlined by Sparks and Malechek (1968). Four slides of each esophageal sample were mounted and examined at 100 X magnifi- cation until 15 fields/slide were viewed. Dietary similarities between pastures were calculated using Kulczynski’s similarity index (Oosting 1956).
Esophageal samples were dried at 500 C for 48 h and ground through a 2-mm screen in a Wiley mill. Dry matter and ash content were determined by standard procedures (AOAC 1984). Dietary fiber constituents [acid detergent fiber (ADF), acid detergent lig- nin (ADL), neutral detergent fiber (NDF)] were determined according to Goering and Van Soest (1970). Kjeldahl procedures were used for N analyses (AOAC 1984).
In vitro organic matter disappearance determination was con- ducted on the fourth day of the field trial, using esophageal extrusa samples cornposited across steers (within pasture) and sampling days as a substrate. Extrusa was dried at 50” C for 48 hand ground through a 2-mm screen in a Wiley mill. Ruminal fluid inocula were
collected at sunrise (0600-0800 h) from ruminally cannulated steers grazing study pastures during each trial. Ruminal fluid from 2 steers (randomly paired within a pasture) were cornposited for the other replication. This compositing scheme was repeated in the adjacent pasture. Extent of in vitro organic matter disappearance (IVOMD) was estimated using the Tilley and Terry (1963) 2-stage technique (48 h rumen fluid, 48 h pepsin digestion on0.5 g samples in triplicate). Rate of organic matter disappearance &,I) was calcu- lated using methodology described by Mertens and Loften (1980). Incubation times used for rate analysis were 0,4,8, 12, 16,20,24, 30, 36,48, and 72 h.
Condensed tannins were determined on esophageal masticate samples using the vanillin-HCl procedure (Burns 1971) as modi- fied by Price et al. (1978) in which 0.5 g samples were extracted with 1% HCl in methanol for 20 min by manual inversion. Catechin (flavonoid structurally similar to flavonoids in condensed tannins) was used as a standard in this procedure; thus, results were expressed as catechin equivalents. Total phenolic content of eso- phageal samples was determined by the Folin-Denis procedure (AOAC 1984). The 24-h extraction with 1% HCl in methanol was conducted with 0.5-g samples in a mechanical shaker with contin- uous shaking.
Ruminal fluid samples were thawed and 40 ml of fluid from each sample was centrifuged at 12,000 X g for 10 min. The supematant fraction was decanted and an aliquot was analyzed for ammonia concentration by the phenol-hypochlorite procedure of Broderick and Kang (1980). Another aliquot was analyzed for volatile fatty acids by gas chromatography (2cthylbutyric acid as an internal standard) as described by Goetsch and Galyean (1983). Only rumi- nal samples collected at 0, 4, 8, and 12 h were analyzed for pH, ammonia, and total volatile fatty acids. An additional aliquot was analyzed for cobalt concentration by atomic absorption spectro- scopy using an air/ acetylene flame.
Fecal samples were prepared for analysis by boiling ash residues in 3.1 N HCL for 30 minutes. After filtration (Whatman 541) and dilution, the solution was analyzed for Yb content by atomic absorption spectroscopy with a nitrous oxide/acetylene flame. Standards were made in solubilized ash from 0 h collections, and all samples and standards contained 2,000 p/ml of potassium as an ionization buffer.
Calculations and Statistiul Anatysh
Table 3. Orgaulc matter and neutral daterlent flbar intake, dry matter 111 and feral output in steem grazing ferttllzed (F) and nonfeHtlt?ed (NF) blue gram8 rangeland during the year of and year nftr fertllhtion.
Sampling periods (year after fertilimtion) Sampling periods (year of fertilization)
Early August Late August Early November Early January May Late July Late August Late November
1983 1983 1983 1984 1984 1984 1984 1984
~ ~~~~ ~_
Item F NF SE’ F NF SE F NF SE 1 F NF SE F NF SE F NF SE F NF SE’ F NF SE -
Steer
weight, kg 374.0 385.0 392.0 413.0 396.0 41 I .O 433.0 425.0 471 0 505.0 512.0 541.0 561.0 590.0 585.0 620.0
Organic matter intake,
gBl$gl 23.0 23.6 1.5 22.9 25.6 1.5 18.9 19.2 0.8 21.6b 19.1’ 0.7 26.1 24.5 1.0 24.8 21.4 1.6 21.9 20.0 0.7 15.5b 19.6’ 0.9
Neutral detergent fiber intake,
g/kgBW 15.6 18.6 1.1 16.6b 20.6’ I.2 14.4 14.5 0.6 16.1 14.9 0.5 21.1 20.4 0.8 19.9b 16.2’ 1.3 19.1 17.9 0.6 11.9b 14.0’ 0.7 Estimated
dry matter
fill, g/ 4
BW 11.6b 23.6’ 1.8 14.2 18.6 2.0 16.4 16.0 1.0 22.6 21.4 1.1 12.0 12.5 1.1 13.5 14.5 1.3 8.6b 14.0’ 1.0 16.5 17.3 1.3 Fecal out-
gi$ gl kg 8.4b 12.4’ 0.7 10.2 10.0 0.6 8.7 9.1 0.4 ll.Ob 9.0’ 0.3 7.6b 6.6’ 0.2 7.0 7.3 0.5 5.6b 6.3’ 0.2 7.1 7.4 0.4
‘Standard error, N = 4
“Means within trials differ (X0.05)
estimated by dividing dose by estimated concentration at 0 h. Fecal Yb excretion curves were analyzed by nonlinear regression proce- dures (Marquardt method) of the Statistical Analysis System (SAS 1984) using a l-compartment model (Pond et al. 1982): Y = k,
l (t-mu) l (ki’) l e-‘i(t-tau). Estimates from the model include tau
(calculated time until first appearance of marker in feces), k (initial concentration of marker in the compartment) and ki (passage rate constant). Calculations derived from estimates included:
Flow, %/h q (kt l 59635) X 100
Fecal output/h = dose/k,
Undigested dry matter fill = dose/(k, l ki l 59635)
Ruminal retention time q 2/ ki
Intestinal transit time q tau
Organic matter intake (OMI) was calculated as the ratio of fecal OM output to OM indigestibility, where fecal output was esti- mated from Yb and OM indigestibility was derived from 2-stage in vitro digestion.
Because of restrictions in facilities, animals, and nature of the long-term study, it was not possible to replicate fertilized and unfertilized pastures. In effect, steers within pasture served as psuedo:replicates, and pasture and fertilizer treatment were con- founded. Because of the limited number of esophageal-fistulated steers used in the study, no statistical analyses were conducted on botanical or chemical composition data. The botanical and nutri- tional information is provided to enhance interpretation of rumi- nal fermentation, intake, and digesta kinetics data.
Intake and digesta passage data were analyzed as a split-plot design by year after fertilization or year of fertilization with effects for main-plot treatment (fertilization), steer within main-plot, subplot (trial), and trial X treatment in the model. Main-plot effects were tested by steer within treatment, and subplot effects were tested with residual error. Significant trial X treatment inter- actions (K.05) were observed; therefore, comparisons were made within trial. Fermentation measurements were analyzed by an analysis of variance as a split-plot design with effects of steer, treatment, sampling time, sampling time X treatment and steer within treatment included in the model. No sampling time X treatment interaction was noted for fermentation measurements, thus values were pooled over time. Means were separated by the treatment F-test (Cochran and Cox 1968). Correlations were com- puted with the correlation procedure of SAS (1984).
Results and Discussion Botanical and Nutrient Composition of Diets
During active growing periods for warm-season grasses (June-- September), grass consumption averaged 67% (Table 1). As grasses approached dormancy (October-May), grass consumption decreased to 53%, while dietary forb intake increased from 33 to 47%. Blue grama, sand dropseed, and muhlenbergia species were the primary grasses consumed during the study by steers in both treatment groups. Major forbs consumed were carruth sagewort, scarlet globemallow, and kochia. Kochia consumption was res- tricted to the growing season, while carruth sagewort utilization occurred primarily during winter dormancy,
Dietary similarities of steers grazing fertilized and nonfertilized pastures were 61% (EAUG83), 73% (LAUG83), 61% (ENOV83), 67% (EJAN84), 98% (MAYM), 81% (LJUL84), 88% (LAUG84), and 87% (LNOV84). The low dietary similarities observed during this study indicate fertilization resulted in dietary shifts in animal selectivity or species availability. These dietary differences between pastures subsequently influenced ruminal fermentation, intake, and digesta kinetic data.
Organic matter (OM) percentage of diets did not vary between fertilized and nonfertilized pasture during the year of or year after fertilization (Table 1). These values are consistent with previous studies on fertilized (Cordova 1978, Wallace et al. 1983) and non- fertilized (Thetford et al. 1971, Wallace et al. 1983, Judkins et al. 1985, McCollum et al. 1985) pastures at Fort Stanton, but are lower than those reported from other studies in the western United States (Conner et al. 1963).
Dietary ADF and NDF were not affected by treatment (Table 1). Normally, advancing maturity is associated with increasing fiber constituents (Ulyatt 1981, Van Soest 1982). However, NDF tended to decline with advancing season, during the present study, especially during the year of fertilization, which may reflect selec- tive grazing by the steers. As previously stated, forb consumption increased with advancing season and could explain the decline in NDF. Similar declines in content of fiber constituents were observed by McCollum et al. (1985) for steers grazing comparable nonfertilized blue grama rangeland.
(assuming adequate forage consumption) for growing heifers and steers (minimum wt 225 kg) gaining 0.5 kg/day (9.5-lo%), lactat- ing cows (9-IO%), and heifers (9-11%; NRC 1984). Crude protein levels were, however, sufficient for pregnant cows (7-8%) and yearling heifers (89%) during EJANM and LNOV84. Crude pro- tein levels declined appreciably with advancing forage maturity.
Generally, as season advanced extent of IVOMD declined (Table 1). Similar trends in digestibility have been reported for nonfertilized (Kam and Lorenz 1983, McCollum et al. 1985) and fertilized (Cordova 1978, Havstad et al. 1979) blue grama range- land. In contrast, Thetford et al. (1971) did not observe a seasonal decline in IVOMD for either sheep or cattle grazing nonfertilized blue grama rangeland.
Phenolics in excess of 20 mg/ g of dry matter can depress nutri- tive value of forages by reducing voluntary feed intake and decreas- ing fiber and protein digestibility (McLeod 1974, Robbins 1983, Barry and Reid 1985). Proposed causes of reduced forage intake include decreased palatability (Wilkins et al. 1953, Donnelly 1954) and decreased ruminal and intestinal permeability, which could interfere with nutrient absorption (Mitjavila et al. 1979; as cited by McLeod 1974, Barry and Forss 1983). Decreased fiber and protein digestibility have been attributed to inhibition of microbial cellu- lolysis and pectinolysis (McLeod 1974, Van Soest 1982, Robbins 1983, Hahn et al. 1984, Barry and Reid 1985). Plants containing high amounts of tannins have often been found relatively resistant to degradation in the rumen. Tannins have strong protein-binding properties and may complex with other nutrients and metabolic intermediates (Jung and Fahey 1983). Other workers have sug- gested rumen microorganisms can readily adapt to phenolic and tannin exposure and alleviate negative effects of these secondary compounds (Van Soest 1982, Robbins 1983, Barry and Reid 1985).
Results of this study indicate cattle grazing blue grama range- land did not consume phenolic or tannin compounds in quantities sufficient to markedly alter forage intake or digestibility (Table 1). However, during certain times of the year, consumption of plant species with high phenolic or tannin content could alter fermenta- tion and digestion of protein and fiber. Further evaluation of effects of phenolic compounds on OMI and digestive physiology of grazing ruminants is needed.
Rumi~l Fermentation Measurements
Ruminal pH ranged from 5.9 to 6.5 during the study (Table 2). This range is similar to results of McCollumet al. (1985; 6.1 to 6.8) for steers grazing a nonfertilized pasture at Fort Stanton the year before the present study. Under grazing conditions, ruminal pH normally varies from 6.3 to 7.0, because of time spent grazing and ruminating in relation to ruminal VFA production (Qrskov 1982). Mertens (1979) suggested fiber digestion is diminished at a pH lower than 6.7. Similarly, @skov (1982) reported pH lower than 6.2 inhibits growth of cellulolytic bacteria. Ruminal pH was higher (X0.05) in the fertilized pasture for LAUG83, ENOV83, and
LAUG84 trials, while differences (m.05) were observed in other trials (Table 2).
Variation in pH was low across trials. Declining diet quality with advancing season did not result in an increase in ruminal pH, which would be expected if a smaller quantity of VFA were buf- fered by more saliva associated with increased chewing time and rumination of dormant forages. Results of this study differ from previous work of McCollum et al. (1985) in which ruminal pH increased with advancing season for steers grazing nonfertilized blue grama rangeland.
Molar proportions of individual acids varied with plant matur- ity with acetate increasing with advancing season (Table 2). This would be expected, because acetate is reflective of cell wall fermen- tation (Van Soest 1982). Butyrate tended to decline withadvancing season (Table 2). Similar shifts in molar proportions of VFA between wet versus dry and growing versus dormant seasons have been observed in grazing ruminants (Topps et al. 1965, Langlands and Sanson 1976, Playne and Kennedy 1976, McCollum et al.
1985). Minor acids (isobutyrate, valerate, isovalerate) varied sea- sonally, with highest proportions occurring during the growing season and lowest proportions with forage dormancy (Table 2). These minor acids are required by many cellulolytic species in the rumen (Grskov 1982) and may partially explain the concurrent decline in extent of IVOMD noted in the present study.
Fertilization decreased (PCO.05) acetate proportions only dur- ing LAUG83 (Table 2). However, fertilization increased (KO.05) minor acid proportions during all trials except ENOV83 and MAY84 when no difference (m.05) was observed and LNOV84 when ruminal fluid from steers grazing nonfertilized pasture con- tained a higher (KO.05) proportion of minor acids. Propionate and butyrate levels did not differ (t30.05) between fertilized and nonfertilized pasture (Table 2).
Ruminal ammonia (NHs) was increased (KO.05) by fertiliza- tion within each sampling period except LNOV84 (Table 2). Sea- sonally, highest NH3 concentrations coincided with active growing seasons and high dietary N content, while lowest NH3 concentra- tions were observed during dormancy when dietary N and IVOMD were lowest (Table 2). Playne and Kennedy (1976) detected a similar relationship between season of year and dietary N content. Satter and Slyter (1974), working in vitro, and Roffler et al. (1976), working in vivo, suggested a minimum ruminal NH3 concentration of 5 mg/ 100 ml of rumen fluid is required for optimal microbial protein synthesis. However, Slyter et al. (1979) puts a minimum ammonia concentration of 2.2 mg/lOO ml of rumen fluid for optimum microbial protein synthesis. Fifty to 70% of ruminal microbial N is derived from ammonia N (Hespell 1979). Ruminal NH3 levels in cattle grazing fertilized pasture were above 5 mg/ 100 ml throughout the study, indicating microbial protein synthesis and flow to the small intestine were probably not limited by NH3 supply. However, ruminal NHs-N levels in the fertilized pasture
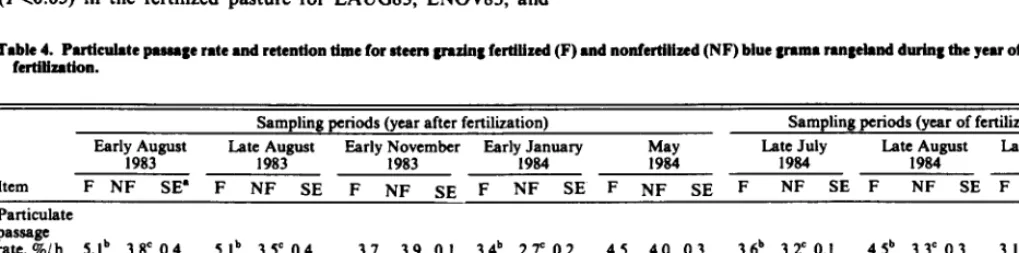
Table 4. Puticuhtc pesesge rate and retention time for eteere grazing fertiiized (F) and nonfertilized (NF) blue grama rengeiand durhg the year of end year efter ferttiintion.
Sampling periods (year after fertiliiation) Sampling periods (year of fertilization)
Early August Late August
1983 1983
Early F8ymher Farly,~~uary May Late July Late August Late November
1984 1984 1984 1984
item F NF SE’ F NF SE F NF SE F NF SE F NF SE F NF SE F NF SE F NF SE
Particulate passage
rate,%/h 5.ib 3.8’ 0.4 S.ib 3.SC 0.4 3.7 3.9 0.1 3.4b 2.P 0.2 4.5 4.0 0.3 3.6b 3.1 0.1 4.5b 3.3c 0.3 3.1 3.0 0.3
Ruminal retention
time, h 23.6b 32.9’ 3.1 23.9b 34.0’ 2.1 32.5 30.4 1.0 35.5b 45.9’ 3.2 26.6 30.6 1.9 33.2 36.8 1.3 26.5b 36.4’ 2.2 40.5 44.0 5.1 intestinal
transit
time, h 12.0 18.0 I.9 i3.3b i7.1C 1.1 i5.9b 21.4’ 1.0 i5.ib 22.8’ 0.9 10.6 10.5 0.8 12.7 14.2 I.1 12.9 16.8 1.3 20.6 19.6 I.0
*Standard error, N = 4
during EJAN84 and LNOV84 were marginally sufficient for microbial protein synthesis (Table 2). On the other hand, cattle grazing nonfertilized pasture had potentially deficient NHs levels during ENOV83 (2.2 mg/ 100 ml), EJAN84 (3.2 mg/ 100 ml), and LNOV84 (3.0 mg/lOO ml) when forage was dormant. Similar ruminal NHs levels have been reported for cattle grazing nonfertil- ized blue grama rangeland (McCollum et al. 1985, Funk 1986). These results indicate nonfertiliied winter pasture may not contain sufficient N to supply adequate ruminal ammonia levels for optimal microbial growth and metabolism. Biological consequen- ces include decreased rate of ruminal fermentation (Mehrez and Qrskov 1976), increased microbial requirements for growth and maintenance as a result of limited substrates for biosynthesis of cellular constituents (Hespell 1979) and a loss of endogenous N from the body resulting in negative N balance. Fermentation of resistant feedstuffs can be adversely affected by insufficient NHs levels (Tamminga 1979). In addition, Qrskov (1982) suggested N requirements for optimum microbial growth are less than require- ments for maximum organic matter digestion. Ruminal NH3 con- centrations in both pastures in all trials were below the minimum level (>20 mg/ 100 ml) suggested by f$rskov (1982) for maximum digestion.
Forage Intake
Voluntary organic matter intake (OMI) was unaffected (FX.05) by fertilization during any sampling periods except in EJAN84 when intake was greater (p<O.OS) for steers grazing fertilized than for those grazing nonfertilized pasture and LNOVM when intake was greater (PCO.05) for steers grazing nonfertilized pasture (Table 3). These conflicting results may be caused by the larger difference in forage digestibility between pastures in LNOV84 compared with EJAN84 (Table 1). Numerous studies have shown fertilization with various levels of N did not influence forage intake by grazing sheep (Mahoney and Poulton 1962, Holmes and Lange 1963, Reid and Jung 1965, Reid et al. 1966) or cattle (Cordova 1978). However, Odhuda et al. (1965) and Kelsey et al. (1973) noted significant increases in intake for sheep consuming N fertilized forages. Minson (1973) reported a 78% increase in forage intake of sheep grazing N-fertilized tropical pasture. In the present study, organic matter intake by steers averaged 21.8 g OM/ kg BW and 2 1.6 g OM/ kg BW across the 8 trials for the fertilized and nonfertil- ized pastures, respectively. Cordova (1978) reported average year- long intake levels for steers grazing fertilized and nonfertilized blue grama rangeland of 16.6 g OM/kg BW and 18.0 g OM/kg BW, respectively. Similarly, McCollum (1983) reported average year- long intake levels of 18.5 g OM/ kg BW for steers grazing nonfertil- ized blue grama rangeland. Rosiere et al. (1980) reported
intake estimates for lactating and nonlactating 2-yr-old cows graz- ing blue grama rangeland during the summer of 21 .O g OM/ kg BW and 14.0 g OM/kg BW, respectively.
In the present study, intake declined with advancing season, which is consistent with earlier studies on blue grama rangeland in New Mexico (Cordova 1978, McCollum and Galyean 1985b) and Nebraska sandhills (Powell et al. 1982). Steers grazing the fertilized pasture during the year after fertilization experienced an OMI decline of 16% from the EAUG83 and LAUG83 to ENOV83 and EJAN84 sampling periods, while a decrease of 22% was observed in the nonfertilized pasture over the same time period. In contrast, during the year of fertilization, OMI declined 33% fertilized pas- ture from MAY84 through LNOV84, while only a 5% decrease was observed in nonfertilized pasture for the same period.
Neutral detergent fiber intake (NDFI) estimates were variable with no consistent trends noted between fertilized and nonfertil- ized pastures during the year of or year after fertilization (Table 3). Neutral detergent fiber intake declined with advancing season, as would be expected with the observed decline in OMI and decrease in dietary NDF. Previous forage studies suggest cell wall content limits intake when proportion of cell wall exceeds 50 to 60?$ of the dry matter (Van Soest 1965). Diet samples collected during this study contained in excess of 60% NDF and NDFI declined with advancing season within each pasture supporting the concept that NDF is a major factor limiting forage intake.
Fecal output (FO) varied from a low of 5.6 to a high of 12.4 g/kg BW across all sampling trials and treatments (Table 3). Kahn and Spedding (1984) and McCollum and Galyean (1985b) reported a similar range of FO estimates for cattle grazing rangeland. The variation in FO observed during this study could be the result of a combination of expanded gut capacity and botanical components consumed during these sampling periods. Freer (1981) and Kahn and Spedding (1984) postulated gut capacity would increase in response to prolonged consumption of lowquality forage in order to maintain the same intake of metabolizable energy, but only up to a point associated with critical distension of the alimentary tract during eating. Examination of data revealed that generally when
gut fill was greatest (Table 3), steer diets contained predominantly grasses (Table 1). The ease and manner in which forb material fragments during comminution might enable digesta to pack more
densely in the gastrointestinal tract and allow for increased fill with high-forb diets (Ingalls et al. 1966, Troelson and Campbell 1968). However, during the present study, gut fill estimates were generally lowest during sampling periods when steers consumed high-forb diets. The rate of digestion of forbs which is generally faster than other forage components may compensate for the packing density effect and result in minimal change in gut fill estimates.
Tsbk 5. Ruminal fluid pngc rate, volume 8nd turnover rate and time for ateen mzing fertilized (F) snd nonfertilized (NF) blue gram8 mngehd during the year of snd year after fertilintioa.
Item
Sampling periods (year after fertilization) Sampling periods (year of fertilization) Early August Late August Early November Early January May Late July Late August Late November
1983 1983 1983 1984 1984 1984 1984 1984
F NF SE’ F NF SE F NF SE F NF SE F NF SE F NF SE F NF SE F NF SE
Fluid pas=F
ratc,%/h 10.6 Il.8 I.0 Il.2 9.1 1.3 10.5 8.6 0.8 8.1 7.2 1.0 11.5 11.1 0.5 9.9 10.9 0.9 9.Nb 11.3’ 0.4 10.8 8.9 0.8 Fluid
volume, liters/ kg
BW 0.1 0.1 0.1 0.1 0.2 0.1 0.2 0.2 0.1 0.2 0.2 0.1 0.2 0.2 0.1 0.2 0.2 0.1 0.2 0.2 0.1 0.1 0.1 .o Fluid tum-
over rate,
liters/h 3.6 5.7 0.8 5.8 6.2 1.1 6.4 6.2 1.0 7.7 5.3 2.8 9.8 10.7 0.4 8.9 9.4 0.1 9.1b 9.2’ 0.3 4.4b 6.6c 1.1 Fluid
turnover
time, h 9.4 8.5 1.4 8.9 11.0 1.7 9.5 11.6 0.7 12.3 13.9 0.5 8.7 9.1 0.6 10.1 9.2 0.8 10.2 8.8 0.5 9.3 11.2 0.5 ‘Standard crro~, n = 4.
Pasqe Rate Estimatea
Particulate passage rate (PPR) was faster in steers grazing fertil- ized pasture during LAUG83 (p<O.OS), EJAN84 (p<O.O5), and LAUG84 (p<O.OS) than in steers grazing nonfertilized pasture. However, no differences (BO.05) were noted in PPR during the remaining sampling periods (Table 4). In general, PPR declined in both fertilized and nonfertilized pastures with advancing season, which would be expected because there was a concurrent increase in undigested residues in the gut which was reflected in increased gut fill (Table 3) and lower organic matter digestion with advanc- ing season (Table 1). Increased PPR was associated with decreased ruminal retention time (RRT) and intestinal transit time (ITT). Rumen retention time was decreased (p<O.OS) in steers grazing fertilized compared with nonfertilized pasture during the year after fertilization for the EAUG83, LAUG83, and EJAN84 trials. Sim- ilarly, during the year of fertilization, steers grazing fertilized range- land had decreased (KO.05) RRT and LAUG84 compared with steers grazing nonfertilized rangeland (Table 4). Ruminal retention time averaged 30.7 h and 35.9 h across the 8 trials for the fertilized and nonfertilized pastures, respectively. McCollum (1983) reported similar RRT (34.3 h) for cattle grazing nonfertilized blue grama rangeland. Likewise average IIT for the present study was faster for steers grazing fertilized (14.1 h) versus nonfertilized (17.6 h) pastures. Intestinal transit time was lower (X0.05) in steers graz- ing fertilized compared with nonfertil&d rangeland during LAUG83, ENOV83 and EJAN84 (Table 4). No differences (m.05) were noted for other trials.
Organic matter intake in the fertilized pasture across both years showed a negative relationship with RRT (r = -.51, KO.05) and ITT (r q -.58, X0.05). Likewise, OMI in the nonfertilized pasture across years showed a negative relationship with RRT (r = -.50, KO.05) and ITT (r q -.38, X0.05). In addition, dry matter fill was negatively correlated to PPR for both fertilized (r q -.68, p<O. 10) and nonfertilized (r = -.37, X0.05) pastures. These data indicate declines in OMI with advancing season are associated with dietary factors, slower PPR and increased gastrointestinal dry matter fill.
Fluid passage rate (FPR) and fluid turnover time were unaf- fected (m.05) by fertilization except during the LAUG84 period when FPR was faster (K.05) in steers grazing fertilized versus nonfertilized pasture (Table 5). During the year after fertilization, no differences (m.05) were noted in fluid volume and turnover rate, but some minor differences were observed during the year of fertilization (Table 5). The FPR observed in the present study were typical for ruminants consuming forage diets (Kennedy 1982, McCollum and Galyean 1985b).
Research conducted by McCollum and Galyean (1985b) showed a high correlation (KO.05) of FPR with OMI (r = .65) and PPR (r = .77) for steers grazing nonfertilized blue grama rangeland. Dur- ing the present study, however, these relationships were less pro- nounced for steers grazing nonfertilized pasture (FPR with OMI; r = .34, PCO.10; FPR with PPR; r = .40, X0.05). Goetsch and Owens (1985) proposed faster FPR would increase removal of small particles, thereby increasing PPR. In contrast, no significant relationship (m.50) was observed among FPR, OMI, and PPR in the fertilized pasture. Results from the fertilized pasture support the findings of Varga and Prigge (1982) in which a 2-fold increase in FPR did not influence PPR.
As noted with RRT, advancing season was accompanied by longer fluid turnover times. McCollum and Galyean (1985b) reported a constant relationship between the flow of fluid and particulate matter through the GIT for steers grazing nonfertilized blue grama rangeland. The ratio of fluid turnover time to RRT was .41, .41, .30, .35, .33, .30, .38, .21 for EAUG83, LAUG83, ENOV83, EJAN84, MAY84, LAUG84, and LNOV84, respec- tively, for the fertilized pasture and .26, .32, .40, .35, .30, .26, .24, .29 for EAUG83, LAUG83, ENOV83, EJANM, MAY84, LJUL84, LAUG84, and LNOV84, respectively, for nonfertilized pasture. These data, while not statistically evaluated, suggest differ factors
affect flow of fluids and particulates, and their relationship to each other is minimal.
Fertilization altered steer selectivity, with steers grazing fertil- ized rangeland consuming a higher percentage of forbs than steers grazing nonfertilized rangeland. Correspondingly, total available N content was higher and fiber constituents were generally lower for diets consumed by steers grazing fertilized blue grama range- land. However, during the year of fertilization, fiber constituents were generally higher for diets consumed by steers grazing fertil- ized as compared with those grazing nonfertilized rangeland. Sim- ilarly, fertilization increased digestiblity during the growing season but digestibility was depressed by fertilization during dormancy. Results from this study indicate steers grazing N fertilized range- land had increased ruminal pH and NH3 levels throughout the year, but fertilization had little effect on VFA proportions when compared with nonfertilized rangeland.
Nitrogen fertilization (year after application) of blue grama rangeland had a minimal effect on voluntary forage intake. How- ever, fertilization generally increased forage digestion and PPR. Correspondingly, RRT and ITT were reduced in steers grazing fertilized blue grama rangeland. During the year of N fertilization, voluntary forage intake was increased during growing season but was depressed during dormancy. Fertilization generally increased PPR and decreased RRT and IlT.
Literature Cited
AOAC. 1984. Official methods of analysis (14th cd.). Association of Off- cial Analytical Chemists. Washington, D.C.
B8~er, R.E. 1969.Influencc of nitrogen fertilization on production char- acteristics of blue grama. MS. Thesis. New Mexico State Univ., Las CrUceS.
Barry, T.N., end D.A. Form. 1983. The condensed tannin content of
vegetative Lotus pedunculutus, its regulation by fertilizer application,
and effect upon protein solubility. J. Sci. Food Agr. 34: 1047-1056.
Berry, T.N., and C.S.W. Reid. 1985. Nutritional effects attributable to condensed tannins, cyanogenic glycosides and oestrogenic compounds in New Zealand forages. p. 25 l-259. In: R.F. Barnes, P.R. Ball, R. W. Brougham, G.C. Marten, and D.J. Minson (eds.). Forage Legumes for Energy-Efficient Animal Production. Proc. Trilateral Workshop. USDA- ARS.
Broderick, GA., and J.H. Keng. 1980. Automated simultaneous determi- nations of ammonia and total amino acids in ruminal fluid and in vitro media. J. Dairy Sci. 3364-75.
Bums, R.E. 1971. Method for estimation of tannin in grain sorghum. Agron. J. 63511-512.
Burzleff, D.F., G.W. Flock,end L.R. Rittenbouse. 1968. Effect of nitrogen fertilization on certain factors of a western Nebraska range ecosystem. J. Range Manage. 21:21-24.
Coehran, W.C., end GM. Cox. 1968. Experimental designs (2nd ed.).
John Wiley & Sons, Inc., New York.
Conner, J.M., V.R. Bohman, A.L. Lesperence, end F.E. KInsinger. 1963.
Nutritive evaluation of summer range forage with cattle. J. Anim. Sci. 22:%1-969.
Couk, C.W. 1972. Comparative nutritive values of forbs, grasses and shrubs. p. 303-310. In: C.M. McKell, J.P. Blaisdell and J.R. Goodin (eds.). Wildland Shrubs-Their Biology and Utilization. USDA Forest Sew. Gen. Tech. Rep. INT-I.
Cordova, FJ. 1978. Intake and nutritive value of forage grazed by cattle on
fertilized and unfertilized blue gmma rangeland. Ph.D. Diss. New Mex- ico State Univ. Univ Microfilms. Ann Arbor, Mich.
Cordova, FJ., J.D. Wellace, end R.D. Pieper. 1983. Forage intake by
grazing livestock: A review. J. Range Manage. 31:430-438.
Donart, C.B., E.E. Parker, and R.D. Pieper. 1983. Livestock and range- land performance to nitrogen fertilization in southcentral New Mexico. p. 351-354. In: D.B. Hannaway (ed.). Foothills and Food and Forests, Symposium No. 2. Timber Press, Beaverton, Ore.
Donart, G.B., E.E. Parker, R.D. Pieper, and J.D. Wallace. 1978. Nitrogen fertilization and livestock grazing on blue grama rangeland. Proc. Int. Rangeland Cong. 1:614-615.
Donnelly, E.D. 1954. Some factors that affect palatability in sericea lesped- eza (L. cuneata). Agron. J. 46:%.
Freer, M. 1981. The control of food intake in grazing animals. p. 105-124. McCollum, F.T., and M.L. Galyean. 198Sb. Cattle grazing blue grama In: F.H. Morley (cd.). Grazing Animals. Elscvier Sci. Publ. Co., New rangeland II. Seasonal forage intake and digesta kinetics. J. Range
York. Manage. 38543-546
Funk, M.A. 1986. Effect of changes in forage quality throughout the growing season on dietary composition, intake, digestion and microbial protein synthesis in steers grazing blue grama rangeland. M.S. Thesis. New Mexico State Univ., Las Cruces.
Coering, H.D., and PJ. Van Soest. 1970. Forage fiber analyses (apparatus, reagents, procedures and some applications). USDA-ARS Handbook No. 379.
McCollum, F.T., M.L. Galyean, L J. Krysl, and J.D. Waiiacc. 1985. Cattle
grazing blue grama rangeland. I. Seasonal diets and rumen fermentation. J. Range Manage. 38539-543.
MeLeod, N.M. 1974. Plant tannins-their role in forage quality. Nutr. Abstr. Rev. 44:803-815.
Goetscb, A.L., and M.L. Calyaan. 19ll3.Influence of feeding frequency on passage of fluid and particulate markers in steers fed a concentrate diet. Can. J. Anim. Sci. 63:727-730.
Goetseh, A.L., and F.N. Owens. 1985. Effects of sampling site on passage rate estimates in heifers fed alfalfa hay or a high concentrate diet. J. Dairy Sci. 683914-922.
Hahn, D.H., L.W. Rooneyiand C.F. P&p. 19g4. Tannins and phenols of sorghum. Cereal Foods World 29:776-779.
Goetz, H. 1969. Composition and yields of native grassland sites fertilized at different rates of nitrogen. J. Range Manage. 22384-390.
NRC. 1984. Nutrient requirements of domestic animals. No. 4. Nutrient Reauirements of Beef Cattle (6th cd). Nat. Acad. Sci. Nat. Res. Count. Mchrez, A.Z., and E.R. Orskov. 1976. Rates of rumen fermentation in
relation to ammonia concentration. Proc. Nutr. Sot. 35:4OA.
Mcrtens, DR. 1979. Effects of buffers upon fiber digestion, p. 65-80. In: W.H. Hale and P. Meinhardt (eds.). Regulation of Acid Base Balance. Church and Dwight Company, Inc., Piscataway, N.J.
Mertees, D.R., and JR. Loften. 1986. The effects of starch on forage fiber digestion kinetics in vitro. J. Dairy Sci. 63: 1437-1446.
Minson, DJ. 1973. Effects of fertilizer nitrogen on digestibility and volun- tary intake of Chloris gayana, Digitaria decumbens and Pennisetum clandestinum. Australian J. Exp. Agr. Anim. Husb. 13:153-157.
Havsiad, K.M., R.D. Pieper, G.B. Donart, J.D. Wallace, F J. Cordova,
and E.E. Parker. 1979. Cattle diets on a fertilized blue grama upland range site. J. Range Manage. 32398401.
HespeU, R.B. 1979. Efficiency of growth by ruminal bacteria. Fed. Proc. 38:2707-2716.
Holechek, J.L., and M.Vavra. 1982. Forage intake by cattle on forest and grassland ranges. J. Range Manage. 35:737-741.
Holmes, J.C., and R.W. Lange. 1963. Effects of fertilizer nitrogen and herbage dry matter content on herbage intake and digestibility in bul- locks. Anim. Prod. 5:17-26.
Humphrey, R.R. 1960. Range ecology. Ronald Press Co. New York.
Inylls, J.R., J.W. Thomas, M.B. Taur, and D.L. Carpenter. 1966. Reia-
tions between ad libitum intake of several forage species and gut fill. J. Anim. Sci. 25:283-289.
Jung, H.G., aed G.C. Fahey. 1983. Nutritional implications of phenolic monomers and lignin: A review. J. Anim. Sci. 57:20&219.
Judkins, M.B., L.J. Krysl, J.D. Waiiace, M.L. GaIyean, K.D. Jones, and E.E. Parker. 1985. Intake and diet selection by protein supplemented grazing steers. J. Range Manage. 38:210-214.
Karn, J.F., and R.J. Lorenz. 1983. Supplementation of yearling steers grazing fertilized and unfertilized Northern Plains rangeland. J. Range Manage. 3641-45.
Kelry, R.J., A.B. N&u, G.S. Smith, and R.D. Pkper. 1973. Nutritive value of hay from nitrogen-fertilized blue grama rangeland. J. Range Manage. 26292-294.
Kelry, RJ., A.B. Nelson, G.S. Smith, R.D. Pieper, and J.D. Waiiace.
1972. Effects of N-fertilization on blue grama parts. Proc. West. Sec. Amer. Sot. Anim. Sci. 23:237-240.
Kennedy, P.M. 1982. Ruminal and intestinal digestion in Brahman crossbred and Hereford cattle fed alfalfa or tropical pasture hay. J. Anim. Sci. 55:1190-1199.
Kahn, H.E., and C.R.W. Spedding. 1984. A dynamic model for simulation of cattle herd production systems: 2-An investigation of various factors influencing the voluntary intake of dry matter and the use of the model in their validation. Agr. Sys. 13:63-82.
W&hington, DC.
Odhuda, E.K., R.L. Reid, and G.A. Jung. 1965. Nutritive evaluation of tall fescue pasture. J. Anim. Sci. 24:1216-1221.
Oosting, H.J. 19%. The study of plant communities. W.H. Freeman and Co. San Francisco.
Grskov, E.R. ln2. Protein nutrition in ruminants. Academic Press, New York.
Piayne, JJ., and P.M. Kennedy. 1976. Ruminal volatile fatty acids and ammonia in cattle grazing dry tropical pastures. J. Agr. Sci. (Camb.) 86367-372.
Pieper, R.D., J.R. Montoya, and F.L. Grace. 1971. Site characteristics on pinyon-juniper and blue grama ranges in southcentral New Mexico. New Mexico Agr. Exp. Sta. Bull. 573.
Pieper, R.D., RJ. Keisey, and A.B. Neiaon. 1974. Nutritive quality of nitrogen fertilized and unfertilized blue grama. J. Range Manage. 27470472.
Pieper, R.D., A.B. Nelson, G.S. Smith, E.E. Parker, E.J.A. Bo&no, and S.F. Hatch. 1978. Chemical composition and digestibility of important range grass species in south cential New Mexico, New Mexico State Univ., Agr. Exp. Sta. Bull. 662.
Pond, K.R., W.C. Eliis, H J. Matis, G.T. Scheilin~, and L.W. Greene. 1982. Compartmental models for estimating gastrointestinal tract fill, flow and output using pulse dose marker data. J. Anim. Sci. 53(Suppl. 1):452.
range in Nebraska. J. Range Manage. 3596-99~
Price, M.L., S. Van Seoyoe, and L.C. Butler. 1978. A critical evaluation of the vanillin reaction as an assay for tannin in sorghum grain. J. Agr. Food Chem. 26:12141218.
Reed, R.L. 1969. Effects of nitrogen fertilization and clipping on production and water usage in blue grama. M.S. Thesis. New Mexico State Univ., Las truces.
Reid, R.L., and G.A. Jung. 1965. Influence of fertilizer treatment on the intake. digestibility and palatability of tall fescue hay. J. Anim. Sci. 24:615-625. - -
Poweii, DJ., D.C. Clanton, and J.T. Nichols. 1982. Effects of range condition on the diet and performance of steers grazing native sandhills
Kothmann, M.M. 1989. Nutrition of livestock grazing on range and pas- ture lands. p. 56-90. In: D.C. Church (ed.). Digestive Physiology and Nutrition of Ruminants Vol. 3. Practical Nutrition. (2nd cd.). 0 and B Books, Corvallis, Ore.
Langlands, J.P., and J. Sansoa. 1976. Factors affecting the nutritive value of the diet and the composition of rumen fluid of grazing sheep and cattle. Australian J. Agr. Res. 27691-708.
Leblue, T., and K.W. Ailred. 1985. Fiora of the Fort Stanton Experimental Ranch, Lincoln, County, New Mexico. New Mexico Agr. Exp. Sta. Bull. 557.
Mahoney, A-W., and B.R. Pouiton. 1962. Effects of nitrogen fertilization and date of harvest on the acceptability of timothy forage. J. Dairy Sci. 45:1575-1581.
McColium, F.T. 1983. The influence of advancing season on nutritive quality, intake and rumen fermentation of cattle diets on blue grama rangeland. Ph.D. Diss. New Mexico State Univ., Univ. Microfilms. Ann Arbor, Mich.
McCoiiun~, F.T., and M.L. Galyean. 1989a. Influence of cottonseed meal supplementation on voluntary intake, rumen fermentation and rate of passage of prairie hay in beef steers. J. Anim. Sci. 60:570-577.
Reid, R.L., G.A. Jung, and SJ. Murray. 1966. Nitrogen fertilization in relation to the palatability and nutritive value of orchard grass. J. Anim. Sci. 25~636-645.
Robbins, CT. 1983. Wildlife Feeding and Nutrition. Academic Press, New York.
Rofiier, R.E., C.G. Schwab, and L.D. Satter. 1976. Relationship between ruminal ammonia and nonprotein nitrogen utilization by ruminants. III. Influence of intraruminal urea infusion on ruminal ammonia concentra- tion. J. Dairy Sci. 5980-84.
Rogier, G.A., and RJ. Lorena. 1965. Nitrogen fertilization of natural grassland in the Northern Plains of the United States. Proc. Inter.Grassl. Cong. 9: 1327-l 330.
Rosiere, R.E., J.D. Wallace, and R.D. Pieper. 1980. Forage intake in Zyear old cows and heifers grazing blue gtama summer range. J. Range Manage. 33:71-73.
SAS. 1984. SAS User’s Guide. SAS Institute, Inc., Cary, North Carolina.
Satter, L.D., and L.L. Slyter. 1974. Effect of ammonia concentrations on rumen microbial protein production in vitro. Brit. J. Nutr. 32:199-208.
Slyter, L.L., L.D. !htter, and D.A. Diniur. 1979. Effect of ruminal ammo- nia concentration on nitrogen utilization by steers. J. Anim. sci. 48906.
Sparks, D.R., and J.C. Makchek. 1961. Estimating percentage dry weights in diets using a microscopic technique. J. Range Manage. 213264-265.
Tmmminga, W. 1979. Protein degradation in the forestomachs of rumi- nants. J. Anim. Sci. 491615-1630.
Teeter, R.G., F.N. Dwens, and T.L. Madr. 19M. Ytterbium chloride as a marker for particulate matter in the rumcn. J. Anim. Sci. 58465473.
Tlwtlord, F.D., R.D. Pkper, and A.B. N&OII. 1971. Botanical composi- tion of cattle and sheep diets on pinyon-juniper grassland ranges. J.
Range Manage. 2442543 1.
Thornton, R.F., and D.J. Mhon. 1973. The relationship between appar- ent retention time in the rumen, voluntary intake and apparent digestibil- ity of legume and grass diets in sheep. Australian J. Agr. Rcs. 24~889-898.
Tilky, J.M.A., and R.A. Terry. 1963. A 2-stage technique for the in vitro digestion of forage crops. J. Brit. Grassl. Sot. 18: 104-l 11.
Topps, J.H., W.C. Reed, and R.C. Elliott. 1965. The effect of season and of supplementary feeding on the rumen contents of African cattle grazing subtropical hcrbagc II. pH values and conccntrationsand proportions of volatile fatty acids. J. Agr. Sci. (Camb.). 64:397402.
Troekon, J.E., and J.B. Campbell. 196g. Voluntary consumption of forage by sheep and its relation to the sire and shape of particles in the digestive tract. Anim. Prod. 10~289-294.
Ulyatt, M.J. l#l. The feeding value of temperate pastures. p. 125-142. In: F.H.W. Morley (cd.). Grazing Animals Elsevier Scientitic Publishing Co., New York.
Udcn, P., D.E. Colucd, and P.J. Van Soest. 19gO. Investigation of chro- mium, ccrium and cobalt as markers in digesta rate of passage studies. J. Sci. Food Agr. 31:625432.
Ven Soest, PJ. 1965. Symposium of factors influencing the voluntary intake of herbage by ruminants. Voluntary intake in relation to chemical composition and digestibility. J. Anim. Sci. 24~834-843.
Van Soest, PJ. 19C2. Nutritional Ecology of the Ruminant. 0 and B Books, Corvallis, Ore.
Varga, GA., and E.C. Prigge. 1%2. Intluencc of forage species and level of intake on ruminal turnover rates. J. Anim. Sci. 55:1498-1504. WaBace, J.D., FJ. Cordova, C.B. Donart, and R.D. Pieper. 19g3. Nutri-
tive value of cattle diets on fertilized and unfertilized blue grama range- land. Proc. Int. Grassl. Cong. 27:688-690.
Wilkins, H.L., R.P. Bates, P.R. Herman, I.L. Londhal, and R.E. Davis. 1953. Tannin and palatability in sericea lespedeza (L. cuneara). Agron. J. 45:335.