THE DESIGN PROCESS OF AN
AUTOSTEREOSCOPIC VIEWING INTERFACE
FOR COMPUTER-ASSISTED MICROSURGERY
POLYDOROS Ch i o s
UNIVERSITY COLLEGE LONDON
A T h e sis S u b m itte d to the U n iv e rsity o f L o ndon fo r th e D eg ree o f
Do c t o r o f Ph i l o s o p h y
ProQuest Number: U642949
All rights reserved
INFORMATION TO ALL USERS
The quality of this reproduction is dependent upon the quality of the copy submitted.
In the unlikely event that the author did not send a complete manuscript and there are missing pages, these will be noted. Also, if material had to be removed,
a note will indicate the deletion.
uest.
ProQuest U642949
Published by ProQuest LLC(2016). Copyright of the Dissertation is held by the Author.
All rights reserved.
This work is protected against unauthorized copying under Title 17, United States Code. Microform Edition © ProQuest LLC.
ProQuest LLC
789 East Eisenhower Parkway P.O. Box 1346
ABSTRACT
This thesis describes and evaluates the design process of an autostereoscopic viewing interface for computer-assisted microsurgery using augmented reality techniques. The augmentation of three-dimensional real-time optical images, as these are acquired from the surgical microscope, with volumetric reconstructions from CT/MRI data, ensures that the surgeon is offered optimum visual information about the patient’s pathology at the time of surgery, thus allowing him/her to perform highly complicated procedures with a great degree of accuracy.
It is well known that the working conditions in the operating theatre are uncomfortable since the surgeon has to operate by looking through a surgical microscope. The interface looks to improve the way surgeons perceive visual data, by introducing the use of a prototype 3D visual display unit that replaces the viewing end of the surgical microscope, thereby making surgery much less stressful for the surgeon and much less hazardous for the patient.
AKNOWLEDGEMENTS
The author would like to thank his supervisor, Dr. Alfred Linney, whose direction has been vital for the completion of the study. Furthermore, this work would not have been possible without the financial support of the Institute of Laryngology and Otology and the personal commitment of Professor Anthony Wright. The author would also like to extend his gratitude to the members of the Physics, Surgery and Instrumentation Group of University College London, particularly Mr. A 0 Tan and Mr. Gus Alusi for their insightful comments, as well as Mr. Cliff Ruff from the Medical Physics Department for lending his ear and revising the document.
DEDICATIONS
TABLE OF CONTENTS
ABSTRACT
AKNOWLEDGEMENTS
DEDICATIONS
TABLE OF CONTENTS
LIST OF TABLES_____
LIST OF FIGURES_________________________________________________________________ 10
LIST OF PUBLICATIONS___________________________________________________________ 14
GLOSSARY OF ABBREVIATIONS___________________________________________________15
1. INTRODUCTION_________________________________________________________________ 18
1.1 Com puter-assisted su r g e ry _____________________________________________________ 18 1.1.1 Microsurgery_____________________________________________________________19 1.1.2 The CAESAR project_____________________________________________________ 21
1.2 Visual display engineering______________________________________________________ 22
1.3 Human fa cto rs_________________________________________________________________ 24
1.4 Research aim __________________________________________________________________ 26
1.5 T hesis layou t__________________________________________________________________ 27
2. PRELIMINARIES ________________________________________________________________28
2.1 A treatise on lig h t _____________________________________________________________ 28
2.2 Optical te c h n o lo g y ____________________________________________________________ 31
2.2.1 Telescopes____________________________________________________________31
2.2.2 Microscopes___________________________________________________________32
2.3 Surgery through t im e __________________________________________________________ 34
2.4 The inquiry of R ea lity__________________________________________________________ 36
3. HUMAN VISION AND VISUAL DISPLAYS__________________________________________ 40
3.2 S te r e o p s is ____________________________________________________________________ 44 3.2.1 Binocular v ision____________________________________________________________ 45 3.2.2 Depth perception - The cyclopean stimulus_____________________________________ 47 3.2.3 Binocular imaging___________________________________________________________ 51
3.3 The stereo m icro sco p e_________________________________________________________ 54 3.3.1 Stereo microscope d esig n ____________________________________________________56 3.3.2 Video microscopy___________________________________________________________ 58
3.4 Three-Dimensional displays_____________________________________________________63 3.4.1 Stereoscopic displays________________________________________________________ 66 3.4.2 Autostereoscopic displays____________________________________________________69
4. VIRTUAL REALITY FOR HELATHCARE SYSTEM S_________________________________ 72
4.1 VR applications________________________________________________________________72
4.2 VR sy ste m s in m ed icin e________________________________________________________ 75 4.2.1 Stereotactic neurosurgery____________________________________________________75 4.2.2 Endoscopic surgery_________________________________________________________ 77 4.2.3 Prosthetic surgery__________________________________________________________ 79 4.2.4 Medical Education and Training_______________________________________________ 80
4.3 Augmented Reality surgical s y s t e m s ____________________________________________ 82 4.3.1 AR Neurosurgery___________________________________________________________ 83 4.3.2 AR Orthopaedic surgery______________________________________________________ 85 4.3.3 AR microsurgery____________________________________________________________ 86
5. DESIGN CYCLE I: FOCUS ON USER______________________________________________ 90
5.1 Interface a sp ect m o d e ls ________________________________________________________ 92 5.1.1 The physical m o d e l_________________________________________________________ 92 5.1.2 The behavioural model_______________________________________________________ 93
5.2 User stu d ie s___________________________________________________________________ 94 5.2.1 Interview-based stu d y _______________________________________________________ 95 5.2.2 In-situ video observations_____________________________________________________96
5.3 Task a n a ly sis__________________________________________________________________ 97
5.4 R esu lts_______________________________________________________________________ 99
5.5 D iscu ssio n ___________________________________________________________________ 102 5.5.1 The physical aspect model___________________________________________________103 5.5.2 The behavioural aspect model_______________________________________________ 104
6. DESIGN CYCLE II: EARLY AND CONTINUOUS TESTING__________________________ 107
6.1 Prototype developm ent________________________________________________________ 107 6.1.1 Design Characteristics______________________________________________________ 109 6.1.2 Video camera selection_____________________________________________________ 112
6.2.3 Results________________________________________________________________ 117 6.2.4 Error analysis___________________________________________________________ 121 6.2.4.1 Statistical error analysis______________________________________________ 121 6.2.4 2 Systematic error analysis____________________________________________ 123
6.3 D iscu ssio n __________________________________________________________________ 123 6.3.1 Early testing____________________________________________________________ 123 6.3.2 Continuous testing_______________________________________________________ 124
7. DESIGN CYCLE III: INTERFACE OPTIMISATION__________________________________ 126
7.1 Field experim ent______________________________________________________________ 127 7.1.1 Human factors considerations_____________________________________________ 127 7.1.2 Grommet insertion_______________________________________________________ 129 7.1.3 Observational results_____________________________________________________130 7.1.4 Heuristic evaluation______________________________________________________ 132
7.2 Iterative d e s ig n _______________________________________________________________ 132 7.2.1 Modified design characteristics_____________________________________________ 134 7.2.2 Aperture-priority design___________________________________________________136
7.3 Judgment study_______________________________________________________________ 138 7.3.1 Aperture study__________________________________________________________ 139 7.3.2 Disparity magnitude study________________________________________________ 141 7.3.2.1 Experimental protocol________________________________________________ 143 7.3.2 2 Results___________________________________________________________144
7.4 D iscu ssio n ___________________________________________________________________ 146 7.4.1 Field experiment_________________________________________________________ 146 7.4.2 Judgment study_________________________________________________________ 147
8. DESIGN CYCLE IV: INTEGRATED DESIGN________________________________________ 149
8.1 Digital video com m unications__________________________________________________ 150 8.1.1 The digital image________________________________________________________ 150 8.1.2 Video signal transmission__________________________________________________151
8.2 System dem ands______________________________________________________________ 152
8.3 Broadcasting I/O management__________________________________________________ 155
8.4 Network C om m unications_____________________________________________________ 157 8.4.1 Health care and Information Technology_____________________________________ 157 8.4.2 Implementation of a Dedicated Optical Fibre Network for Real time Stereo Imaging 159
9. CONCLUSIONS________________________________________________________________ 163
9.1 Major scientific contributions___________________________________________________ 165
9.2 General rem arks______________________________________________________________ 168
9.4 Future w o r k __________________________________________________________________ 171
9.5 Epilogue______________________________________________________________________173
REFERENCES___________________________________________________________________ 176
APPENDIX A ____________________________________________________________________ 183
APPENDIX B ____________________________________________________________________ 187
LIS T OF TABLES
Table 1.1: Taxonomy of 3D displays...23
Table 1.2: Design methodology for good HCI...25
Table 5.1 .Event recording at time of operation...95
Table 5.2: Serial events and associated tasks...98
Table 5.3: List of main combined events...99
Table 6.1: Survey results on choice of industrial video camera modules...113
Table 6.2: Variation of statistical results for magnification factors 10x& 16x....125
Table 7.1: Monitor vs. Binoculars FOV for three, different focal length, Zeiss video objective adapters...134
Table 7.2: Rank questionnaire of disparity offset vs. Viewing comfort and DOF...144
Table 7.3: Kruskall-Wallis non-parametric test results of viewing comfort and DOF appreciation in Series I of the magnitude disparity study....145
LIS T OF FIGURES
Figure 1.1: Schematic presentation of the CAESAR project...22
Figure 2.1: Magnified image of mould growing on the leaf of a rose (Micrographie, 1667)...33
Figure 2.2: Hooke’s microscope...33
Figure 2.3: Early 19th century, Greenough-type, microscope...34
Figure 2.4: Mixed Reality Spectrum...38
Figure 3.1: Primary human sensory system bandwidth...40
Figure 3.2: Human eye anatomy...42
Figure 3.3: The human e ye...42
Figure 3.4: Objective focal length of the resting human eye...43
Figure 3.5: Human eye response to radiation of different wavelengths...44
Figure 3.6: The binocular visual field and overlap region...46
Figure 3.7: Object sensation (a) within and, (b) outside Panum’s fusional area...46
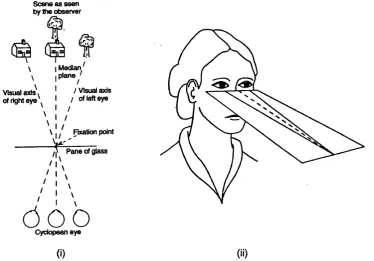
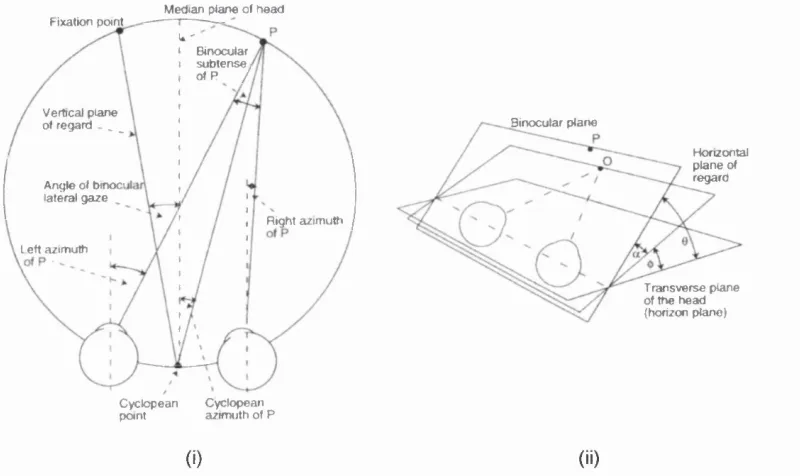
Figure 3.8: Geometry of the cyclopean coordinate system...48
Figure 3.9.Cyclopean coordinates of absolute disparity...49
Figure 3.10: (i) Azimuth planes in stereoscopic images...50
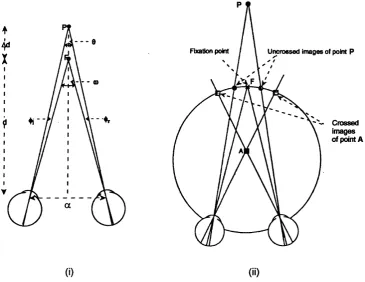
Figure 3.11: Geometric representation of binocular disparity...51
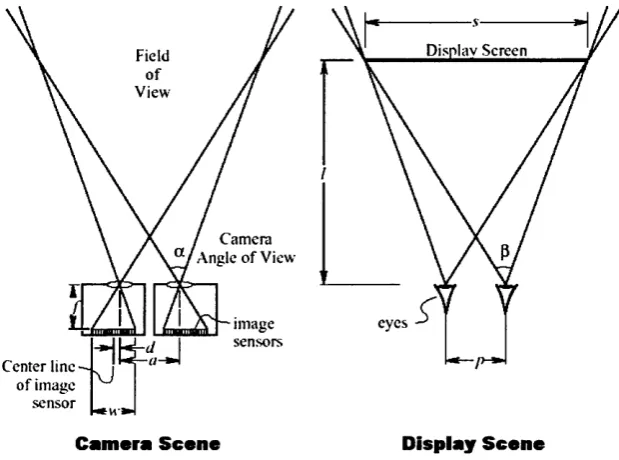
Figure 3.12: Geometry of a parallel-axes stereo camera system for an orthoscopic viewing frustum...52
Figure 3.13: Geometry of a parallel-axes stereo camera system fora stereoscopic viewing frustum, (i) in the viewer-display space and (ii) in the camera-scene space...53
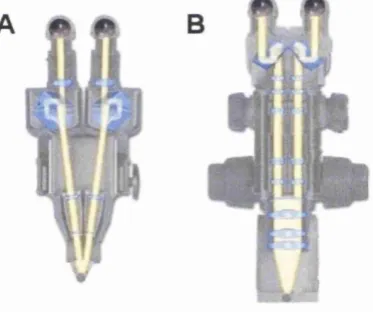
Figure 3.14: Schematic beam path diagram of the G reenough (A) and Common Main Objective (B) stereo microscope system s...55
Figure 3.15: Schematic diagram of the Cycloptic® stereo microscope...56
Figure 3.16: Graphical representation of the optical ray path inside the beam splitter...59
Figure 3.17: One of the latest surgical stereo microscope as it is manufactured by Zeiss 59 Figure 3.18: Charge-Couple Device sensor formats...60
Figure 3.19: Graphical arrangement of a three CCD colour video camera attached onto the microscope’s beam splitter...61
Figure 3.20: I/O signal component diagram of a colour TV system... 62
Figure 3.21: Schematic diagram of the mirror stereoscope...64
Figure 3.22: Schematic diagram of the lenticular stereoscope...64
Figure 3.23: Schematic diagram of LCD operation...66
Figure 3.24: Schematic diagrams of: (i) time-multiplexed and (ii) polarisation-multiplexed display, for producing stereo video images...67
Figure 3.25:CrystalEyes® stereo vision formats...68
Figure 3.26: Commercial VR stereoscopic displays...68
Figure 4.1: Mixed Reality living room...75
Figure 4.2: Stereotactic frame for image-guided surgery...76
Figure 4.3: Tracking devices...77
Figure 4.4:Visualisation process of 3D virtual MR! diagnostic data...79
Figure 4.5: Craniofacial anomaly correction technique, based on VR simulation...80
Figure 4.6: The interaction panel from the ‘Interactive Rhinolog/ CBT course as developed at the Institute of Laryngology & Otology, University College London...81
Figure 4.7: Axial (a) and side (b) views of a cadaver's temporal bone...82
Figure 4.8. The human temporal bone in its entirety...82
Figure 4.9: CAS process using AR at the Brigham & Women’s hospital, Boston...84
Figure 4.10: Orthopaedic surgeon using the 'Image Overlay’ CAS AR system...86
Figure 4.11: Merged data from a tracked microscope and computer model of tumour...87
Figure 4.12: Mathematical transforms and projections during the calibration procedure...88
Figure 5.1: Typical arrangement of staff and equipment inside the operating theatre...93
Figure 5.2: (i) Microscope stand arrangement during ENT surgery...93
Figure 5.3: Parallel event recording...96
Figure 5.4: The Zeiss OPMi® ORL surgical microscope used in both video scenanos...98
Figure 5.5: Percentage duration of serial events during acoustic neuroma removal...100
Figure 5.6: Time distribution diagram of most frequent events during 9000 seconds of acoustic neuroma removal...100
Figure 5.7: Time distribution diagram of most frequent events during the burring period of acoustic neuroma removal....101
Figure 5.8: Percentage duration of serial events during cranio-facial resection...101
Figure 5.9: Frequency diagram of most common events during 3600 seconds of cranio-facial resection...102
Figure 5.10: Event plot diagram of most microscope-affected events in cranio-facial resection ...104
Figure 5.11: Sequence of serial events during the early stages of burring...105
Figure 6.1: Basic components of an optical system...108
Figure 6.2: Optical geometry of telephoto lenses...109
Figure 6.3: Side view of coupler’s original design using a commercial micro-positioning stage 110 Figure 6.4: Original design of the video objective lens-camera coupler using three screws ....111
Figure 6.5: Prototype coupler mounted on a Zeiss video objective adapter...112
Figure 6.6: Optical microscopic image acquired from the Panasonic GP-US522 video camera ...113
Figure 6.7: Experimental arrangement of the equipment...114
Figure 6.8: Miniature model measurements using the passive robot arm...115
Figure 6.9: Calibration grid...116
Figure 6.11: Axial deviations from the actual positioning of the second point for a single operator
when using the display and the binoculars. Magnification factor is 16x....118
Figure 6.12: Axial deviations from the actual positioning of the second point for a single operator when using the display and the binoculars. Magnification factor is lOx....119
Figure 6.13: Correlation pattern between the autostereoscopic 3D display and the eyepieces of the microscope. Magnification factor is 16x....120
Figure 6.14: Graphical representation of results from the time study...121
Figure 6.15: Depth perception variation for all operators...122
Figure 6.16: Depth variations in the viewer-display space...123
Figure 6.17: The stereo camera system installed on a Zeiss beam-splitter...124
Figure 7.1: Eargrommets are polymer tubes with length of about 1.5 m m...127
Figure 7.2: Schematic diagram of prototype set-up during grommet insertion...130
Figure 7.3: Monitor FOV vs. Binoculars FOV...134
Figure 7.4: Ray tracing inside the video coupling system...135
Figure 7.5: Side view of coupler’s modified design...136
Figure 7.6: Depth of focus in the eyepiece...137
Figure 7.7: Aperture-priority modified design of the video coupling system...138
Figure 7.8:Test images of the aperture-priority design evaluation study...140
Figure 7.9: Depth of focus effects in image capture from the aperture-priority design...141
Figure 7.10: Calibration grid for setting the camera offset in the capturing scene...143
Figure 7.11: Plot diagram of Viewing comfort and Depth of Field against uncrossed and crossed disparities...145
Figure 7.12: Plot diagram of Viewing comfort and Depth of Field against uncrossed and crossed disparities...146
Figure 8.1: Image augmentation of a cadaver skull using “sandwiched” digital video frames.. 153
Figure 8.2: System Architecture diagram...156
Figure 8.3: “in-house” audio/video communication at the Department of Surgery, Technical University Munich...158
Figure 8.4: “In-house” audio/video communication at the Royal National ENT Hospital at UCL, London...159
Figure 8.5: Fibre Optics dedicated links for CAS Microsurgery...160
Figure 8.6:Fibre Optics Architectural Design at the Royal National ENT Hospital, London 161 Figure 9.1: Illustration of the facial nerve and its neuronal branches...164
Figure 9.2: Operating theatre surgeon-display space arrangement using the Dresden D4D® 3D display...169
Figure 9.3: Schematic diagram of the microscope sidearm extension...170
Figure 9.4: Illustration of the proposed surgeon-dispiay space arrangement...170
Figure 9.5: Illustration of the proposed surgeon-dispiay space arrangement using a mirror.... 171
Figure 9.6: OpenGL virtual models: a) no shadows, b) shadows and microscope lighting...172
Figure C. 1: Single link system (A), Multipoint system (B) and Network system (C)...189
Figure C.2: (A) Star Design, (B) Double-Star Design and (C) Bus Design...190
L IS T OF PUBLICATIONS
Sections of this research work have been published previously;
• Chios, P., Tan, AC, Linney, A. Alusi, G. H., Wright, A., Woodgate, G., Ezra, D. (1999). The potential use of an autostereoscopic 3D display in microsurgery. In C. Taylor & A. Colchester (Ed) Medical Image Computing and Computer-Assisted Intervention MICCAI V9, vol. 1679 of Lecture Notes In Computer Science, pp. 998-1009, Springer, September 1999
• Chios, P., Tan A 0 (2000). Implementation of a Dedicated Optical Fibre Network for Real Time Stereo Imaging. In A. Hasman et al (Ed.) Medical Informatics In Europe
-MIE 2000, volume 77 of Studies in Health Technology and Informatics, pp. 11 S i l l 55, August 2000
• Lapeer, R. J., Chios, P., Alusi, G. H., Linney, A. D., Davey, M. K., Tan, A 0. (2000a). Computer Assisted ENT Surgery using Augmented Reality: Preliminary results on the CAESAR project. In MICCAI’2000 Conference Proceedings, October 2000
• Lapeer, R. J., Chios, P., Alusi, G. H., Linney, A. D., Davey, M. K., Tan, A C. (2000b). Augmented reality for ENT surgery: an overview of the CAESAR project, in
ISA/ICC-2000 Conference Proceedings, December 2000
GLOSSARY OF ABBREVIATIONS
Numbers in brackets indicate the chapters or appendices in which the abbreviation appears.
2AFC Two-Alternative Forced-Choice (7)
3D Three-Dimensional (1, 2, 3, 4, 5, 6, 7, 8, 9)
AI Artificial Intelligence (2)
AN OVA Analysis of Variance (7, B)
AR Augmented Reality (1,4, 8)
AV Augmented Virtuality (2, 8)
CAESAR Computer-Assisted Ent Surgery using Augmented Reality (1, 8, 9)
CAMI Computer-Assisted Medical Interventions (1)
CAS Computer-Assisted Surgery (1, 4, 5, 6, 7, 8, 9)
CASPIT computer-assisted surgical planning, intervention and training (1, 4)
CBT Computer-Based Training (4)
CCD Charge Coupled Device (3, 4, 6, 7)
CCIR International Radio Consultative Committee (8, C)
e c u Camera Central Unit (6)
CIST Computer Integrated Surgery and Therapy (4)
CMC Common Main Objective (3, 7)
CT Computed Tomography (1, 4, 8)
DIF Design Information Framework (5, 9)
DIVO Digital Video Option (8)
DOF Depth of Field (3, 7, 9, B)
ENT Ear, Nose and Throat (1, 4, 5, 7, 8, 9, B)
FN Field Number (3, 7)
FOV Field ofView (1,3, 4, 7, 9)
HCI Human Computer Interaction (1, 4, 5, 6, 7. 8, 9)
HIS Hospital Information Systems (1)
HMD Head Mounted Displays (3, 4)
ICS Image Coordinate System (4)
IGS Image Guided Surgery (1, 4)
IPD InterPupillary Distance (1,3)
ITU-R International Telecommunications Union-Radio (8)
LAN Local Area Network (8)
LCD Liquid Crystal Display (1, 3, 6, 9)
LED Light Emitting Diode (1, 4)
MAGI Microscope-Assisted Guided Intervention (4)
MRI Magnetic Resonance Imaging (1, 2, 4, 8)
NA Numerical Aperture (3, 7)
NTSC National Television System Committee (3, 4, 6, 8)
OHD Off-Head Display (3)
OME Otitis Media with Effusion (7)
PACS Picture Archiving and Communication Systems (1)
PAL Phase Alternation Line (3, 6, 8)
RGB Red, Green, Blue (3, 6, 8, C)
ROI Region of Interest (1, 3, 4, 7)
SECAM SEquential Colour Avec Mémoire (3, 8)
TFT Thin-Film Transistors (3)
VCR Video Cassette Recorder (3)
VIEW Virtual Interface Environment Workstation (4)
VE Virtual Environments (2)
VR Virtual Reality (2, 3,4 , 9)
In t r o d u c t io n
CHAPTER 1
INTRODUCTION
Let the reader imagine the following futuristic narrative:
.. His first day at the new job had not worried him that much until that morning. Why should it anyway? The Giles Volare Institute might have been the best ENT hospital in the country; nonetheless, his record spoke for itself. It was the operation that was foremost on his mind. The Chameleon was a tricky tumour to deal with. Growing axially behind the trigeminal nerve makes it almost impossible to see, let alone removing it! This one looked even worse. While looking at the pre-op scans on his home PC the night before, he noticed that it was bundled right at the end o f the nerve, nearly touching the brainstem. He tried a couple of surgical simulations on that amazing surgical-planning software from Takamitsi, trying different approaches, and then decided to use the posterior fossa. He ran the virtual fly-through, saved it, and uploaded the file to the hospital server.
His PDA bleeped as he was entering the hospital door. The patient was in the operating theatre, asleep. He walked into the room ten minutes later, after discussing a few details with Dr. Moyes, the assistant surgeon. He sat in fi*ont of the theatre’s computer workstation and loaded his patient’s electronic folder. He nodded Dr. Moyes to start the procedure while he began teleconferencing with Professor Rupier, at the University Medical School. The operation was going to be broadcasted live to trainee surgeons and a small introduction was required. Everything was running smoothly. The skin was cleared and he was now ready to cut the bone. He placed the microscope over the lesion and switched on the computer-guidance system. The lesion appeared on the 3D display, augmented with the virtual reconstructions o f the adjacent anatomical structures. He began burring the bone guided by the path line o f the fly-through. Forty minutes later, he was there. He could see the virtual tumour residing deep in the image background, highlighted in neon blue colour. His burr, appearing in the foreground, was touching the surface o f the display. He proceeded slowly and started removing the tumour bit by bit. At the same time, rendered views o f the fly-through appeared on the terminal screen, the tracked position o f the tool flashing in red. He smiled! He remembered the old X-ray light boxes his uncle used to have...”
1.1 Computer-assisted surgery
In t r o d u c t io n
management o f patient records with the aim o f building fully integrated Hospital Information Systems (HIS) and fast transfer o f data and images (e.g. PACS - Picture Archiving and Communication Systems) between HIS. At the same time, specialised computer systems were built to process and enhance image data from diagnostic modalities, such as Magnetic Resonance Imaging (MRI) and Computed Tomography (CT). The use o f enhanced CT and MRI images led to the birth o f Image Guided Surgery (IGS). Other terminology for similar concepts has since been used, e.g. Computer-Assisted Surgery (CAS), Computer Integrated Surgery and Therapy (CIST) and Computer-Assisted Medical Interventions (CAMI) [1]. The term ‘assisted’ implies that the user, i.e. the surgeon, is still responsible for the outcome and the overall control o f the operation. The system is there as an aid, thus the surgeon has to decide as to whether the information provided by the system is reliable or not.
Surgical simulation and planning was developed in parallel with CAS, possibly because o f its solid base for testing new technologies which might prove too unreliable for direct use in a real clinical intervention. At the end o f the 80’s, simple 3D visualisation o f the anatomy o f the patient, mainly obtained from MRI and CT images, was already a major step forwards in the planning and simulation o f surgery. Before that, surgeons had to reconstruct the human anatomy mentally, i.e. by observing a series of 2D images and then trying to mentally visualise the 3D structure. The development o f IGS systems allowed displaying a virtual surgical tool into the 3D virtual scene, hence offering more realistic planning and execution o f interventions like stereotactic and endoscopic surgery which previously provided the surgeon with only local visual information. Displaying the trajectory o f the surgical tool in 2.5/3D was a useful aid to the surgeon even if the accuracy was not much better than a few millimetres. Today, CAS has become popular in a variety of surgical fields including cranio- and maxillo facial surgery, ENT (ear, nose and throat) surgery, orthopaedic surgery, cardiac surgery, laparoscopy, interventional radiology and several other surgical disciplines [2].
1.1.1 Microsurgery
In t r o d u c t io n
o f surgical stereo microscopes is universal, but they limit the surgeon’s head movement. However, the instrument offers the surgeon stereoscopic viewing, which is important for the perception of depth. Surgical microscopes use a single objective lens that allows the eyepieces to receive two different views o f the ROI, thus producing stereo vision effects. The field o f view (FOV) under the objective lens covers a sensing area o f 20- 120 mm in diameter. Magnification and the physical properties o f optical elements derive the depth o f field, which is the area above and below the focal plane in the ROI that is still perceived as a sharp image. Further magnification in the instrument’s eyepiece enhances the relative depth between two or more points. This viewing arrangement makes the surgical operation stressful, uncomfortable for the eyes and hence more hazardous for the patient.
The use o f CAS systems in microsurgery becomes more difficult. This arises from several reasons. The most important one is that the surgical intervention now involves a ‘not-natural’ viewing interface, an optical instrument (e.g. a microscope). When the surgeon looks through a stereo microscope, his/her vision is acconunodated to the microscope binoculars; s/he is ‘immersed’ in the microscopic environment. In order to see the computerised 3D reconstruction o f the human anatomy, the surgeon needs to look away from the microscopic scene, at a computer monitor. The transition from microscope ‘immersiveness’ to computer workstation monitor requires a mental reorientation which relies completely on the surgeon’s own skill and knowledge o f the variations of the normal anatomy. This becomes more difficult when a surgical tool needs to be held in position.
In t r o d u c t io n
1.1.2 The CAESAR project
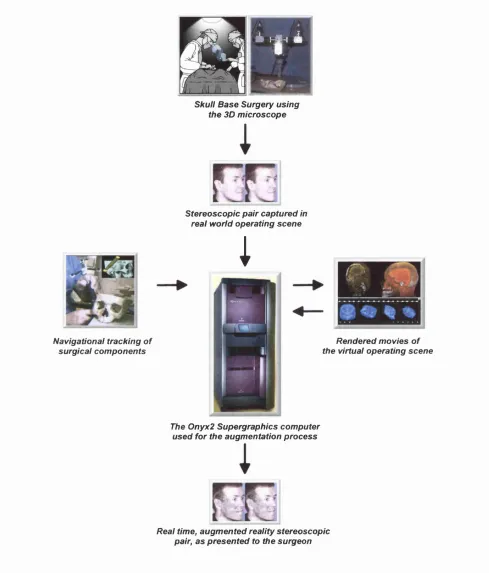
The research group from the Institute o f Laryngology and Otology at UCL, London, has been conducting active research in the field o f AR in ENT surgery [3]. The aim o f its latest project. Computer-Assisted En t Surgery using Augmented Reality (CAESAR), is to create a tool based on the concept o f AR that will allow surgeons to realistically plan, rehearse and execute complex otological and skull-base surgery with a greater degree o f accuracy, thus reducing the risk o f morbidity, as well as deafiiess to the patient. The scientific and technical issues relate to creating dynamic 3D augmented images, integrating an accurate tracking technique and creating a suitable human-machine interface for viewing the augmented surgical microscopic scene.
The overall project, shown in Figure 1.1, involves research and development in the following fields:
• Development o f an appropriate computer graphics technique for visualisation o f 3D reconstructions o f pre-operative CT/MRI scans with real time processing, image buffer updating and parallel processing,
• Calibration o f the CAESAR components,
• Registration of pre-operative CT/MRI images to the patient’s head,
• Tracking objects participating in the surgical procedure (e.g. drilling tools, patient’s head, surgical microscope, etc.),
• Design o f a ‘heads-up’ viewing interface.
In t r o d u c t i o n
Navigational tracking of surgical components
é
hflhé
Skull Base Surgery using the 3D microscope
Stereoscopic pair captured in real world operating scene
;
Rendered movies of the virtual operating scene
The Onyx2 Supergraphics computer used for the augmentation process
Real time, augmented reality stereoscopic pair, as presented to the surgeon
Figure 1.1: Schematic presentation of the CAESAR project.
1.2 Visual display engineering
Spatial vision is based on m onocular and binocular depth cues contained in the
observed scene. M onocular cues are visible with one eye while stereo vision is based on
-In t r o d u c t io n
local displacements (disparities) between the 2D projections o f the scene onto the left and right eye retinas. Stereo vision, along with pictorial and motion cues, is responsible for the perception o f depth in real and virtual scenes [4].
Two-dimensional displays retrieve depth information from monocular {e.g.
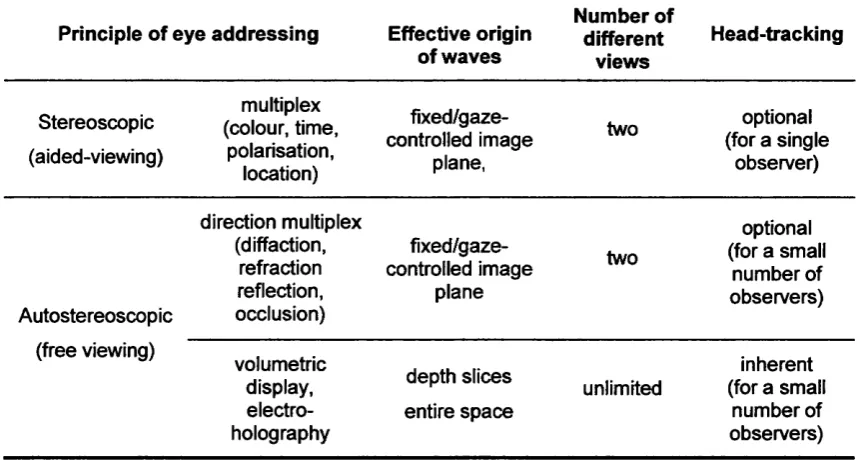
perspective, occlusion, shading, etc.) and motion cues. On the contrary, stereoscopic displays are based on stereo vision effects. Current electronic 3D display technology can provide true depth by displaying to each eye a disparate view o f the visual scene, such that the right eye sees only the right-eye scene and the left eye sees only the left- eye scene. This is done by means of various techniques. In fact, 3D displays are classified by the technique used to channel the left and right images to the appropriate eyes (see Table 1.1) [5]. Some require optical devices close to the observer’s eyes (stereoscopic), while others have the eye-addressing techniques integrated into the display itself (autostereoscopic). Adding depth information to a display helps it match the capabilities o f the human visual system. As a result, the development o f 3D display interfaces has become increasingly popular for use in teleoperation, simulation, entertainment and other multimedia applications [6].
Principle of eye addressing Effective origin
of waves Number of different views Head-tracking Stereoscopic (aided-viewing) multiplex (colour, time, polarisation, location) fixed/gaze-controlled image
plane,
two optional
(for a single observer) Autostereoscopic direction multiplex (diffaction, refraction reflection, occlusion) fixed/gaze-controlled image
plane
two
optional (for a small
number of observers) (free viewing) volumetric display, electro holography depth slices entire space unlimited inherent (for a small
number of observers)
Table 1.1: Taxonomy of 3D displays.
In t r o d u c t io n
required. Autostereoscopic displays have the ability to present the content o f a 3D scene in the same manner that this would appear under natural viewing conditions. The quality of a 3D scene depends on the following parameters:
• Field-of-View: The visual angle subtended by the display surface,
• Spatial resolution: The number, angular size and spacing o f the pixels,
• Refresh rate: The frequency with which the display hardware can draw the image on the display surface,
• 3D content presentation: Generating binocular disparity effects by displaying separate images for each eye.
Stereo image presentation is characterised by the stereo camera properties: the interpupillary distance (IPD), the distance between the nearest and furthest object shown, the location and orientation o f the viewpoints and whether the object appears in front o f or behind the screen.
1.3 Human factors
Recent advents in display and computing technology have revolutionised the way humans interact with machines. Now that state-of-art LCD panels are produced at relatively low cost, the time has come to focus on designing systems with maximised capabilities in ways most effective for the user.
Human Computer Interaction (HCI) is a discipline concerned with the design, evaluation, and implementation o f interactive computing systems for human use, and with the study o f major phenomena surrounding them [7]. When designing a new interface, the importance o f analysing not just the observer or the image presented but also the task to be performed is fundamental [8]. This implies that a human-centered design approach based on Human Factors and Ergonomics research is desired for evaluating the quality o f a viewing interface.
In t r o d u c t io n
thus have significant effects on VDS usability [9]. The designer must also assess their interactions to optimise for a given application. An effective viewing interface design results fi*om trading-off the display parameters, in terms of both economics and visual perception [10].
Gould [11] suggests a four-cycle design methodology that provides good HCI in interface design. Each cycle attributes separately to the overall design o f the new system.
• Focus on the User: The aim is to understand users’ cognitive, behavioural, attitudinal and tasks characteristics.
• Early and Continual User Testing: This phase includes the empirical design o f components, prototype development and evaluation.
• Iterative design: The aim is to optimise the design. The prototype must be modified upon the results o f psychophysical tests and behavioural analysis. • Integrated design: This phase involves all aspects o f usability, such as help
system, training plan and documentation.
Some design phases can and should be run in parallel. For example, interviews and training plans o f the new system must be run in parallel in order to create a good user manual. Table 1.2 lists the various methodologies that can be employed in a good design process.
Focus on Users Early User testing Iterative design Integrated design
Talk with users Protocols Follow-up studies All aspects of usability
Visit customer locations Video scenarios Design
modification
Observe users working Simulations Development work
Videotape users Early prototyping Optimisation
Participative design Early demonstrations
Task analysis Make videotapes
Surveys Formal prototype test
In t r o d u c t io n
1.4 Research aim
The main aim o f this thesis is to describe and evaluate the design o f an autostereoscopic viewing interface for computer-assisted microsurgery. The interface looks to improve the way ENT surgeons perceive visual data, particularly real-time 3D video images. The proposed design introduces the use o f a 13.8”, prototype Sharp Micro-optic Twin-LCD, autostereoscopic 3D display* which replaces the viewing end o f the surgical microscope, thus equipping the viewer with ‘electronic eyes’, and thereby making surgery much less stressful for the surgeon and much less hazardous for the patient.
The design process aims to:
• Derive physical and behavioural patterns of surgeon-microscope interaction during ENT surgery,
• Design, develop and evaluate a prototype 3D video surgical microscope, • Optimise and evaluate the prototype’s viewing comfort and sensation o f
depth,
• Design and implement an “in-house” audio/video communications network for real-time CAS intervention at the Royal National ETN Hospital, which allows parallel broadcasting to remote locations.
The process, based on Gould’s methodology, is divided into four cycles: During the first design cycle {Focus on User) the designer focuses on potential users and their needs during microsurgery by means o f in-situ video observations. In the second design cycle {Early and Continuous Testing)^ an original design for the proposed interface is established, followed by objective evaluation of a user task. During the third cycle o f the design process {Interface Optimisation), the designer applies iterative design techniques in order to optimise the interface’s effectiveness, and carries out a subjective evaluation o f stereoscopic viewing. In the last design cycle {Integrated Design), a computer network for integrated design o f the interface and other CAESAR components
In t r o d u c t io n
in the operating theatre is set up, based on successful I/O control o f the CAS system’s broadcasting and communicative signal parameters.
1.5 Thesis layout
Following the introductory material in this chapter, Chapter 2 presents a philosophical review in the theory o f light, the course o f optical technologies and surgery in time, and the concept o f mixed reality environments. Chapter 3 describes the basic properties of stereo vision and 3D visual systems. A literature review o f CAS systems, including their advantages and disadvantages, is presented in Chapter 4.
Chapters 5, 6, 7, and 8 discuss the author’s experimental work. In Chapter 5, physical and behavioural aspect models o f ENT surgeons are derived from surgical task analysis o f conventional microsurgery. Chapter 6 exhibits the design characteristics o f the interface, and results from a quantitative analysis o f the interface’s accuracy and precision. Chapter 7 presents a field experiment using the prototype, followed by laboratory-based psychophysical experiments in stereo vision and a qualitative analysis of viewing comfort and depth appreciation. In Chapter 8, the author addresses the broadcasting demands o f the interface and explains the design and implementation o f a dedicated fibre optics network for real-time stereo imaging and CAS microsurgery.
Pr e l im in a r ie s
CHAPTER 2
PREUMlNARtES
Fvcbarj : K n o w led g e
As stated by Aristotle, the meaning o f "knowledge^ needs special attention. The philosopher never used the word itself. Instead, he used the word "'yiyvœœœiv^ which in English would be interpreted as '‘the ability to know \ He used 'sîôevai\ a word that finds its root in the noun 'eîôoç' which in turn means 'fornF. Both the two latter Greek words are derived from the root o f the verb '‘i0eiv\ which means Uo se e \ In other words, Aristotle thought o f vision as perhaps the most important sense in acquiring
'knowledge\
In the first sentence o f his book 'Metaphysics\ the philosopher attempts to give a picture o f a man in words. We are to see him trying to see, as if he is reaching out for a light which would make everything clear. According to Aristotle that is what man is by nature. The more care he uses in his seeing the clearer things, and the distinctions between them, become. The spectator develops his theory based upon his visual experience; and to have theory is the consummation of human life.
So, vision is the consummating sense. Without it, nothing would be seen. Thus, it is the visible world which is really primary in the matter o f theory. It is the consummation o f perception because whatever other than visible things is perceived, is in the visible world attached in some way to what is visible.
2.1 A treatise on light
Pr e l im in a r ie s
The oldest theory o f light was proposed by Empedocles (450 B.C.) and taken on by Plato. According to them, the eye projects forward a narrow visual ray that feels the object’s radiation and returns through the pupil into the sensitive part o f the eye, where it creates an image in the mind. The straight visual ray is considered as a long finger projecting fi*om the eye, and sight is a kind of touch^. The theory was supported mathematically by Euclid who, through the geometrical principles o f straight lines, suggested that a finite number o f rays that leave the vibrating eye, sweep out the surface o f an object and reflect back to the eye an eidolon (model) o f the surface. Euclid also derived the law o f reflection, which states that when a visual ray strikes a polished surface at an incident angle, the angle o f reflection is equal to the angle o f incidence.
The Platonic theory was not debated until the early years o f 1000 A.D. when Alhazen (965-1038), an Arab philosopher, proposed after empirical observations that light is an accidental quality o f an object that is illuminated by a source. When this happens, the object becomes luminous and is itself a source. The new source of illumination spreads outward in every direction and in this way is propagated from point to point until it reaches an opaque object.
The development o f astronomy and in particular, astronomical observations led to new theories about the origin and motion of light. Scientific findings were mainly derived fi*om observation and supported by mathematical relations. The new theories on cosmology influenced astronomers and mathematicians to study the properties o f light. One o f them, the great astronomer Galileo (1564-1642) was already convinced that the Sun is the centre o f the world and had extensively studied the planetary motions through his telescopes. At the same time, Johannes Kepler (1571-1630), was the first mathematician who found that these physical motions are governed by mathematical laws. On the motion o f light, Kepler proposed that light flows along straight rays in an instant. The rays themselves do not move and are not light. Rather, it is a surface perpendicular to a ray that moves and is considered as light. A generation later, the Dutch mathematician Christiaan Huygens (1629-1695) explained that this surface is a wave which travels in three dimensions.
PREUMIN ARIES
The birth o f experimental philosophy originated new ways o f studying the nature o f light, mainly through its properties. An example o f this comes from Isaac Newton (1642-1727) who, through his Theory o f Colour, explained that light consists o f pulsating particles that move through space in straight lines. When these particles encounter a reflecting or refracting surface, they set up vibrations in the particles that compose it. The vibrations propagate in the aether, resulting to a final effect that we sense as white colour. Nevertheless, if the vibrations could be separated, the longest one would be sensed as red colour and the shortest as violet. The latter observation suggested that there is secondary motion that follows a wave pattern when light travels in aether (shovm in Figure 3.5).
The aim o f mathematical physics is to mechanise the universe, to explain natural phenomena by means of a logic that follows the laws of mathematics. The debate between the Newtonian and Keplerian approaches to the motion o f light reached its peak with the arrival o f Dr. Thomas Young (1773-1829). He, like Huygens, proposed that light should be considered as matter in aether in exactly the same way that sound is matter in air. In 1801, Young gave a lecture at the Royal Society in London, where he explained that light is a travelling wave that follows a fundamental concept, which he called the principle o f interference^. Young’s greatest contribution to the nature o f light is found in his studies o f colour. He realised that the explanation o f colour perception is not found in the nature of light but in the physiological characteristics o f the human eye (as described in Chapter 3). Young experimented with mixing colours and found that all colours consist o f three primary colours -red, green and blue. Hermann von Helmholtz (1821-1894) studied his theory further, deriving what today is known as the tristimulus model o f colour vision.
The study o f electricity and magnetism in the 19* century offered new ground for research to the quality o f light. James Clerk Maxwell (1831-1879) expressed the empirical relationship between electromagnetism and light in a few mathematical formulae from which he derived a formula for the speed of light inside a medium. He continued by declaring that light is an electromagnetic disturbance in the form of waves
Pr e l im in a r ie s
propagated in the aether. Still, the new properties o f the aether remained unclear and in contradiction with other theories. The problem was to be solved 25 years later, by Albert Einstein (1879-1955). Einstein rejected the aether hypothesis through his theory o f relativity, and later showed that light is always propagated in empty space with a definite speed c that is independent of the state o f motion o f the emitting body.
2.2 Optical technology
The use o f optical instruments began in ancient Greece during warfare activities. The study o f Euclidian geometry had already uncovered the law o f light reflection, and enlistment o f mirrors as defence devices can be found in many historical battles. Later, the Greek-Egyptian philosopher Claudius Ptolemaeus (ca. 100-170), made a first scientific approach on the law o f refi*action. He found through an experiment that when a light ray travels inside water, it bends. He tabulated results o f refi*action for various incident angles. The phenomenon was not studied further until the beginning o f the 13*** century, when Robert Grosseteste (ca. 1168-1253) studied how a lens brings light to a focus: from rays refracting at each surface of the lens. The latest theory triggered the production o f spectacles.
2.2.1 Telescopes
The first clear lenses were manufactured in Italy, late in the 16* century. Optical experimentation using a combination o f convex and concave lenses led to the invention of the first telescope in September 1608 by Hans Lippershey (1587-1619), a Dutch spectacle maker. A foot-long tube, with a concave eyepiece at one end and a weaker convex lens at the other, could make distant things seem closer.
Galileo made the first telescopes for observing planetary motions. He managed to manufacture an objective lens with a magnification power o f 30x, which allowed him to observe the texture o f the moon’s surface. Soon, other scientists started making their own telescopes. However, all o f them suffered from three effects: low image brightness, spherical chromatic aberrations, and small magnification power. In search o f a solution, researchers designed two types o f telescopes: one that used mirrors (reflecting
telescope) to guide more light to the object, and another that combined a number o f
Pr e l im in a r ie s
former telescopes were suffering from spherical aberrations, the latter suffered from low magnification power. With the development o f silver-coated glass mirrors, the production o f reflecting telescopes surpassed that o f refracting ones. Nowadays, reflecting telescopes are equipped with a thin figured transparent plate mounted at the front end that acts as a refractor and allows the reflector to give a sharp image over the entire field o f view.
2.2.2 Microscopes
It is believed that the first microscope was created by Galileo in an attempt to study insects. Nevertheless, the invention o f the first compound"^ microscope was attributed to a Dutch spectacle maker, Zacharias Janssen (ca. 1595).
Originally, microscopes were used for the study o f insects and bacteria. New, improved instruments were manufactured, offering better image brightness, higher magnification and greater resolution. Anthony van Leeuwenhoek (1632-1723), a Dutch master o f the art, made a single lens microscope that had a magnification power o f 25Ox. His instruments were very simple, made out o f a single lens from glass or quartz crystals. The lens itself was very small and curved, very finely ground and polished. Unfortunately, the small size o f the lens made long viewing tiresome and uncomfortable. Moreover, like telescopes, the quality o f the new instrument was limited due to the physical properties o f the single lens.
The first drawings o f the microscopic world were drafted by Robert Hooke (1635- 1703), and presented in his book Micrographia (see Figure 2.1). His microscope was based on the Galilean model and consisted o f two lenses: a convex front lens formed a magnified image o f the object and a second concave, called the eyepiece, magnified the image further. The microscope is illustrated in Figure 2.2.
Pr e l i m i n a r i e s
i
Figure 2.1: Magnified image of mould growing on the leaf of a rose (Micrographia, 1667).
t :
Figure 2.2: Hooke’s microscope.
The instrument began to take its traditional shape at the beginning of the 19^^^ century with the contribution of Carl Zeiss (1816-1888). The German engineer opened the first microscope production workshop in 1846 with the aim of producing high-precision microscope for dissections. Soon, he realised that no matter how precisely his microscopes were made; the only way to make them better would be to establish a computational rather than experimental design for his instruments. He went on to collaborate with Ernst Abbe (1840-1905), a mathematician and physicist at the university of Jena. A few years later, Abbe developed his wave theory for microscopic imaging and for the first time microscopes were assembled according to theoretical considerations. In 1886, Otto Schott (1851-1935), a glass chemist and new member of the Zeiss-Abbe partnership, produced a range of new objective lenses that were free from chromatic aberrations^.
T his type o f lens is called apochrom at as it produces images with no colour distortions.
-Pr e l i m i n a r i e s
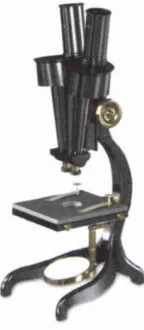
The full potential of Abbe’s mathematical designs was not reached until August Koehler (1866-1948) devised a new illumination method for microphotography in 1893. Three years later, Horatio S. Greenough designed a light microscope, consisting of two objectives and two oculars, which allowed the perception of depth in a microscopic image (see Figure 2.3). An alternative microscope design for depth effects, consisting of a single objective lens and two oculars (CMO), was introduced early in the 20^ century. Both the Greenough and the CMO microscope designs are explained further in Chapter 3.
Figure 2.3: Early 19^ century, G reenough-type, microscope.
Abbe’s designs and Koehler’s illumination method form the basis of light microscope development up to this date. Still, the theory of optical instruments has proved that there is a limit to the power of light microscopes. Optical studies have shown that no light microscope can clearly visualise any detail smaller than 200 nm. However, the applications of light microscopy have become almost endless, with microscopes commonly found in all kind of laboratories, industrial sites and hospitals.
2.3 Surgery through time
The practice of surgery dates back to the late days of the Stone Age. Archaeological excavations of skulls and surgical tools in various regions of the planet have confirmed surgical treatment of the head and the lungs. The most common treatment for head injuries was trepanation, where a drill was used to open a hole in the skull. The technique was used in order to relieve the patient from hydrocephaly, severe headaches
-Pr e l im in a r ie s
or, in some supernatural way, bad spirits! Similarly, respiratory diseases were treated by opening a hole in the lungs o f the patient and let the pleuma pour out o f the body. Amazingly enough, some patients survived the procedure and lived on!
In most ancient cultures, surgeons were usually priests who enjoyed special status within the society. In ancient Greece, surgery became a profession, with young candidates from all ends o f the state attending the Hippocratic School on the island o f Kos. The Romans, who used to assign physicians to their military units, fiirther increased the role o f qualified surgeons.
Naturally, the success rate o f surgical procedures was limited by the poor knowledge o f human anatomy. Nevertheless, improvements came during the Renaissance period. Andreas Vesalius (1514-1564) was the figure that managed to change the course o f medicine. Already a surgeon and anatomist, he published the first complete textbook of human anatomy. De Humanis Corporis Fabrica in 1543. The book, with illustrations from cadavers’ dissections and new scientific terminologies, ended Galenian anatomy and inspired the birth of Modem Medicine.
During the 18* and 19* centuries, surgery moved back to the battlefields. The abundance o f surgical scenarios improved surgical skills, but morbidity rates were still high. Pain, infection, haemorrhage and shock were the major obstacles to post-operation survival. However, some o f these problems were overcome with advances in inflammation control, sterilisation and pre-surgical planning. The most notable contribution came from the development o f anaesthesia in 1845 by William Morton.
Pr e l im in a r ie s
Vesalius’s vision for respect to the human patient became the driving force behind surgical developments during the last century. The power of medical imaging has been a significant factor for that. Nowadays, new imaging modalities, such as Computerised Tomography (CT) and Magnetic Resonance Imaging (MRI), allow surgeons to plan, perform and teach their task better than ever before.
The dawn o f the new century finds surgery facing new, great challenges. Computer graphics-generated images of the human body, new engineering models o f human- machine interfaces, and the technological prospects of Artificial Intelligence (AI), now unveil a new era in surgery.
2.4 The inquiry of Reality
At the beginning o f this chapter, the author presented Aristotle’s view o f nature through the eyes o f a man. This man acts as a sensory receptor in a natural environment, interpreting it through his vision and feel. The collection o f such information initiates a cognitive process from which ^reality' is formed. Real objects are identified through their form, material and behaviour. They are comprised o f tiny particles, called atoms^, and have motion characteristics.
The influence o f Christianity in the medieval period introduced a new essence o f reality, where religious symbols construct a reality that is not based on the materialistic nature o f things but on their superreal meanings.
The conflict between the Aristotelian and Clerical arguments o f what is "reaV ended in the early days o f the Renaissance, when the concept o f reality was re-examined by René Descartes (1596-1650). The French philosopher was the first to separate reality into mind and matter, observer and observed, subject and object. This bifurcation is called Cartesian dualism\ The objective part o f the duality is described as the external world; it occupies space and it is susceptible to being treated by mathematical sciences and geometry^. Other aspects, such as colour and feel, are subjective and belong to the
^ Aristotle did not innovate the idea o f atomic matter. He used the Democritean world model for which every body in the universe descends to molecules, which sequentially consist o f smaller units, the atoms.
Pr e l im in a r ie s
mental side of reality. Later on, Newton added that the external world is a classical order system, and the mind its epiphenomenon.
The Newtonian model of reality was expanded further during the 18* century by Immanuel Kant (1724-1804). Kant separated reality into Forms o f Sensibility and Understanding that follow three physical, a priori conditions. Space, Time and Order. These are imposed upon the external world by the nature o f our senses so that any object that is contained in it can be located in space while events that are associated with it take time and occur in an ordered temporal sequence.
Quantum physics attributes reality to atomic matter that has internal energy and is related through non-locality and interconnectedness but in general, Space-Time reality as devised by Kant, has formed the foundations o f how humans envisage and construct reality. What we appear to experience as real is a result of seeing in four dimensions. The model works out experimentally; hence, the construction o f a reality is always carried out through geometrical (x-y-z space) and arithmetic (time) methods. However, as Kant added to Aristotle’s metaphysical argument, our knowledge o f reality is limited by our finite perceptions.
The application o f mathematics to empirical experiment allows physical sciences to observe the external world through calculus. Mathematical models transform the observer from a contemplator to a calculator. Nevertheless, some calculations can be so complex and tiresome that the ability to understand and construct the external world is limited. The latter problem has been largely overcome with the invention o f computers.
Pr e l i m i n a r i e s
The construction of an environment that can be manipulated and modified through Human-Computer Interaction (HCI) has introduced a new form of reality, which is called virtual reality (VR). However, since the advent of this new reality, many questions have been asked regarding its nature, and while some epistemologists consider the term as a human experience, others claim that VR is just a new technology.
In many textbook definitions, VR is defined as the use of computer technology to create the effect of an interactive three-dimensional (3D) world in which the objects have a sense of spatial presence [13]. For others, VR is considered as the stimulation of human perceptual experience to create an impression of something that is not really there [14]. Heim believes that VR consists of three interrelated components: immersion, interactivity and information intensity [15]. Immersion refers to the type of interface used for the human to experience the technology. Based upon this criterion, VR systems can be either fully immersive or desktop-based. The former use helmets and gloves while the latter use 3D displays and pointers (both systems are analytically explained in Chapter 3). Interactivity relates to the HCI features of the system, the real-time feedback that the user obtains from experiencing the synthetic environment. This includes visual, aural and haptic feedbacks. Information intensity usually refers to the amount o f realism that the user enjoys when using the technology.
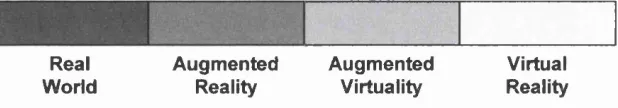
The realism of a VR system depends on the level of virtuality that the system produces. According to Milgram [16], between the extremes of real life and virtual reality lies the spectrum of mixed reality (see Figure 2.4). In mixed reality, views of the real world are linked with views of the virtual one. It can be divided in two categories, i.e. augmented reality (AR) and augmented virtuality (AV). In AR, the final view consists primarily of a real scene, with some computer graphics enhancements. In AV, the virtual environment is enhanced by added elements of the real environment.
Real Augmented Augmented Virtual
World Reality Virtuality Reality
Figure 2.4: Mixed Reality Spectrum.
-Pr e l im in a r ie s