FORECASTING WHEAT PRODUCTION USING TIME SERIES MODELS IN
PAKISTAN
M. Asif Masood,
Irum Raza
Saleem Abid
Social Sciences Research Institute, National Agricultural Research Centre, Pakistan
irumraza83@gmail.com (Corresponding author)
ARTICLE HISTORY:
Received: 07-Nov-2018
Accepted: 10-Jan-2019
Online Available:
08-Feb-2019
Keywords: Forecast, Production, Yield, Time series
ABSTRACT
The present paper was designed to forecast wheat production for 2017-18, 2018-19 and 2019-2020 respectively by using time series data from 1971-72 to 2016-17 with best selected time series models. Linear, Quadratic, Exponential, S-Curve, Double Exponential Smoothing, Single exponential smoothing, Moving average and ARIMA were estimated for wheat production. The results showed a mix trend in production of wheat for selected time period. ARIMA (2,1,2) was found best one keeping in view close forecasts with actual reported wheat production. So the preference inclined towards the ARIMA (2,1,2) than quadratic to forecasts of wheat production.
Contribution/ Originality
The present study focused on forecasting of wheat production in Pakistan by using various time series models. Keeping in view the close forecast values of production with previous years, ARIMA model was found to be appropriate. Data used in the present study is of different time period.
DOI: 10.18488/journal.1005/2018.8.2/1005.2.172.177 ISSN (P): 2304-1455/ISSN (E):2224-4433
How to cite: M. Asif Masood, Irum Raza and Saleem Abid (2018). Forecasting wheat production using time series models in Pakistan. Asian Journal of Agriculture and Rural Development, 8(2), 172-177.
© 2018 Asian Economic and Social Society. All rights reserved.
Asian Journal of Agriculture and Rural Development
Volume 8, Issue 2 (2018): 172-1771. INTRODUCTION
Forecasting techniques are extensively used for estimation of area, production and yield of major as well as minor crops with climatic data. Estimates are essential before sowing of crop especially for the Government to determine its targets regarding procurement, export and storage of wheat. For this purpose, time series techniques can be used for area, production and yield forecasting relying only on past historical data on area, production and yield of respective crop. Traditionally, analytical techniques namely linear trend, quadratic trend, simple exponential smoothing, double exponential smoothing, simple moving averaging, double moving averaging and ARIMA have already been exercised to forecasts of wheat area and production in Pakistan for different periods.
Wheat is among major crops of rabi* season and basic food for Pakistani people. Wheat crop contributes 9.6 percent of the value added in agriculture and 1.9 percent of GDP of Pakistan. During 2016-17 the area of wheat was 9052 thousand hectares with a decline of 1.9 percent as compared to area of last year which was 9224. The estimates of wheat production were 25.750 million tonnes in 2016 which was 0.5 percent higher than previous year wheat production that is 25.633 million tonnes. The rise in wheat production was due to better use of agricultural inputs
(Economic Survey of Pakistan, 2016-17).
Forecasting is the significant tool for crop production in any country due to which the quantity of produce can be assessed well in time. Reliable agricultural statistics provide a sound basis for agricultural planning and also serve as a yardstick to measure the progress of agriculture (Amin et
al., 2014).
The importance of forecasting techniques in agriculture with regards to production/yield, area of crops and sign of occurrence of crop pests and diseases (Ramasubramanianv, 2009). Forecasts that are made well timed before harvest of crop are useful for planning the policies related to storage, distribution, pricing, marketing, import-export etc. (Ranjana, 2010). Review of literature has shown a lot of studies about forecasting techniques in agricultural research such as barley (Naheed
et al., 2015), Major pulses and their price assessment in Pakistan (Rani and Raza, 2012) trend
analysis of tea import (Raza et al., 2015) forecasting wheat and rice prices in Pakistan (Abbasi et
al., 2015). In another study by (Ahmad et al., 2017) forecast of area, production and yield of major
crops have been made by using time series models This study is focused on two main objectives.
First to apply different linear, nonlinear and time series models to data and second to forecast the production of wheat crop in Pakistan by using best fitted model.
2. MATERIAL AND METHODS
Time series data on wheat production for the period 1971-72 to 2016-2017 was taken from government publications such as Agricultural Statistics of Pakistan and Pakistan Economic Survey. Trend analysis and time series models including Linear, Quadratic, Exponential, S-Curve, Double Exponential Smoothing, Single exponential smoothing, Moving average and ARIMA were estimated using MINITAB computer package Version 18 (Statistical Data analysis Software). Data on wheat production from 1971-72 to 2016-2017 was used to forecast wheat production for 2017-18, 2018-19 and 2019-2020 respectively by using best one selected time series models. The general forms of the above models are given in (Table 1).
Table 1: Statistical models used in the study
S # Model Mathematical Equation
1 Linear Yt = a + bt
2 Quadratic Yt = a + bt + ct2
3 Exponential Yt = a ebt
4 S-curve Yt = Exp (a + b/t)
5 Double Exponential Smoothing Lt = Yt + (1 - ) [Lt -1 + Tt -1]
6 ARIMA Zt = Ø 1 Z t-1+…+ Ø p Z t-p + U t
2.1. Accuracy measures
In order to assess the appropriate model for forecasting wheat production the accuracy measures also termed as forecasting errors were calculated from all of the trend models. They included Mean Absolute Percentage Error (MAPE), Mean Absolute Deviation (MAD) and Mean Squared Deviation (MSD). The model selection was based on the minimum values of these accuracy measures.
3. RESULTS AND DISCUSSION
The trends of wheat production showed an upward trend till year 1976-77 and then it fell down in 1977-78 (see Figure 1). An improvement in wheat production was found in 1978-79 with continued rise till 1982-83. In 1983-84 wheat production dropped, 10881.9 thousand tonnes but it again jumped higher and continued till 2016-17. These fluctuations might be the reason of change in the use of agricultural inputs, area of crop, some natural variations due to increase or decrease in the occurrence of rainfall and the variations in the minimum and maximum temperature.
Figure 1: Depicting trend of wheat area and production from 1971 to 2016
smoothing. Similarly regression and trend analysis techniques have been employed by Karim et al.
(2005) to forecast wheat production in Bangladesh.
Table 2: Linear and nonlinear models of wheat production in Pakistan
Fore casting Models Criteria for model selection
MAPE MAD MSD
Linear 4 673 690546
Quadratic 4 666 683407
Exponential 7 1024 1658875
S-curve 4 672 704175
Moving Average 7 1066 1759221
Single Exponential Smoothing 6 999 1569105
Double Exponential Smoothing 5 841 1075722
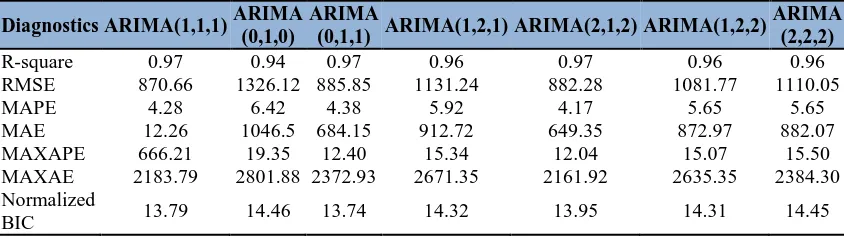
The data was also tested for ARIMA models and the results are given in table 2 and table 3 respectively. Initially plots of auto correlation function (ACF) and partial auto correlation function (PACF) were obtained and they showed non stationary series because auto correlation did not fall within the prescribed 5% significant limits. In order to make the series stationary for production differenced series was obtained by putting the value of ‘p’ equal to 2, the difference or ‘d’ value equal to 1 and finally the order of moving average value ‘q’ was set to be 2. Therefore, ARIMA (2,1,2) was used for estimating production of wheat by using this order. This confirms with the finding of a similar study by Najeeb et al. (2005) to estimate wheat area and production in Pakistan by using ARIMA model.
The forecasts with ARIMA (2,1,2) model are compared over quadratic model to find best one for production of the years 2014-15, 2015-16, 2016-17, 2017-18, 2018-19 and 2019-20, the preference inclines towards the ARIMA model due to close values of Forecasts of wheat production to actual values of wheat production than quadratic model (Table 2). Finally, ARIMA (2, 1,2) was identified best one due to close forecasts estimates with actual reported wheat production. Using ARIMA (2,1,2) 3 years ahead forecasts of wheat production and their 95 % confidence intervals are given in table 3. It is concluded that there is 95 percent probability, forecasts estimates lie between lower and upper limits.
Table 3: Time series models of wheat production in Pakistan
Diagnostics ARIMA(1,1,1) ARIMA (0,1,0)
ARIMA
(0,1,1) ARIMA(1,2,1) ARIMA(2,1,2) ARIMA(1,2,2)
ARIMA (2,2,2)
R-square 0.97 0.94 0.97 0.96 0.97 0.96 0.96
RMSE 870.66 1326.12 885.85 1131.24 882.28 1081.77 1110.05
MAPE 4.28 6.42 4.38 5.92 4.17 5.65 5.65
MAE 12.26 1046.5 684.15 912.72 649.35 872.97 882.07
MAXAPE 666.21 19.35 12.40 15.34 12.04 15.07 15.50
MAXAE 2183.79 2801.88 2372.93 2671.35 2161.92 2635.35 2384.30 Normalized
Table 4: Actual and forecast values of wheat production in thousand tones with the best models
Year Actual Quadratic ARIMA 95%limits
Lower Limits Upper limits
2014-15 25086.1 25827.1 24775.6 23083.7 26467.6
2015-16 25633.0 26316.4 26084.8 24362.8 27806.8
2016-17 25750.0 26808.1 25919.2 24197.1 27641.2
2017-18 27302.1 26824.3 25094.5 28554.1
2018-19 27798.5 26857.9 25123.8 28591.9
2019-20 28297.2 27635.8 25893.4 29378.3
4. CONCLUSION AND RECOMMENDATIONS
In this study, various forecasting models were tried to find best one in relation to future wheat production in Pakistan using historical/ large data of forty six (46) years, but ARIMA (2,1,2) was identified as best one to forecast of wheat production for three years ahead. For 2017-18, 2018-19 and 2019-2020 forecasts of wheat production 26824.3, 26857.9 and 27635.8 thousand tones can be with lower and upper limits 25094.5 to 28554.1, 25123.8 to 28591.9 and 25893.4 to 29378.3 respectively. It is suggested that different crops data can be used to fit models and also make forecast using other advanced forecasting models for provinces and districts.
Funding: This study received no specific financial support.
Competing Interests: The authors declared that they have no conflict of interest.
Contributors/Acknowledgement: All authors participated equally in designing and estimation of current
research.
Views and opinions expressed in this study are the views and opinions of the authors, Asian Journal of Agriculture and Rural Development shall not be responsible or answerable for any loss, damage or liability etc. caused in relation to/arising out of the use of the content.
References
Abbasi, S. S., Tahir, A., Raza, I., Abid, S., & Khan, M. N. (2015). Trend analysis and forecasting of wheat and rice in Pakistan. Pakistan Journal of Agricultural Research, 28(3), 310-317.
view at Google scholar
Ahmad, D., Chani, M. I., & Humayon, A. A. (2017). Major crops forecasting area, production and yield evidence from agriculture sector of Pakistan. Sarhad Journal of Agriculture, 33(3), 385-396. view at Google scholar /view at publisher
Amin, M., Amanullah, M., & Akbar, A. (2014). Time series modeling for forecasting wheat production of Pakistan for the year 2014. The Journal of Animal and Plant Sciences, 24(5), 1444-1451. view at Google scholar
Government of Pakistan (2017). Economic survey 2016-17 finance division. Economic Advisor ‘s Wing, Islamabad.
Karim, R., Awal, A., & Akhter, M. (2005). Forecasting of wheat production in Bangladesh.
Journal of Agriculture and Social Sciences, 01, 120-122. view at Google scholar /view at
publisher
Naheed, S., Raza, I., Anwar, M. Z., Habib, N., Zahra, N., & Siddiqui, S. (2015). Forecasting area and production of barley in Punjab, Pakistan. Pakistan Journal of Agricultural Research, 28(3), 304-309. view at Google scholar
Ramasubramanianv, V. (2009). Forecasting techniques in agriculture, Indian agricultural
statistics research institute. Library Avenue, New Delhi.
Rani, S., & Raza, I. (2012). Comparison of trend analysis and double exponential smoothing methods for price estimation of major pulses in Pakistan. Pakistan Journal of Agricultural
Research 25(3), 233-239. view at Google scholar
Ranjana, A. (2010). Forecasting techniques in crops. Indian agricultural statistics research institute, Library Avenue, New Delhi. view at Google scholar
Raza, I., Naheed, A. M. Z., & Masood, M. A. (2015). Trend analysis of tea import in Pakistan.
Global Journal of Researchers in Engineering, 15, 9-14.