2013 | IJEDR1301007 INTERNATIONAL JOURNAL OF ENGINEERING DEVELOPMENT AND RESEARCH | IJEDR
(All right reserved by www.ijedr.org) 33
Empirical Research on TQM Practices of
Organizations – Development and Validation of
Critical Factors
Anu P.Anil
M.Tech Student
Dept.Production Engineering Government Engineering CollegeThrissur, India 680009 [email protected]
Dr.Satish K.P
Associate Professor
Dept.Production Engineering Government Engineering CollegeThrissur, India 680009
Abstract—Total Quality Management (TQM) is an integrative management philosophy aimed at continuously improving the quality of products and processes to achieve customer satisfaction. The objective of this paper is to describe an empirical research on the development of a tool to measure the quality management in different organizations. It provides empirical evidence on top management’s awareness and understanding of the quality management and its role towards business survival and competitiveness. Through a detailed analysis of literature, this paper identifies thirteen critical factors of quality management .Using a survey of twenty organizations, the critical factors are empirically tested and validated. SPSS is used for this purpose. This provides reliable and valid critical factors of total quality management and develops a measurement instrument for evaluating the TQM implementation process and to target improvement areas.
Index Terms— Factor analysis, Internal consistency method, Multitrait multimethod matrix (MTMM), Reliability, Total quality management (TQM), Validity.
I.INTRODUCTION
Total quality management (TQM) allows firms to obtain, on the one hand, a high degree of differentiation, satisfying customer’s needs and strengthening brand image, and on the other, to reduce costs by preventing mistakes and waste of time and by making improvements in the corporation's processes. In this respect, both researchers and managers have been interested in studying quality management, and identified a number of elements for a successful implementation. Thus, various studies have been carried out for the identification of those critical factors ensuring its success, as a way to develop a theory of quality management from three different areas: contributions from quality leaders (Crosby, 1979; Deming, 1982; Ishikawa,1985; Juran, 1988; Feigenbaum, 1991), formal evaluation models (European Quality Award, Malcolm Baldrige National Quality Award, The Deming Award) and empirical research (Saraph, Benson and Schroeder, 1989; Flynn, Schroeder and Sakakibaru, 1994; Badri, Davis and Davis, 1995; Ahire, Golhar and Waller, 1996; Black and Porter, 1996; Grandzol and Gershon, 1998; Quazi et al., 1998) [2].
Thus, managers need to understand what elements are necessary in order to change a firm’s culture towards a quality culture. Starting from a review of these studies, the purpose of this paper is to contribute to: a) identify critical factors of total quality management b)developing measures for change towards a quality culture and c) testing these measures for reliability and validity using data collected from different organizations by using a suitable questionnaire.
II.CRITICAL FACTORS OF QUALITY MANAGEMENT The companies should develop a number of TQM constructs in an integrated way for successful quality management implementation. The theory of quality management has been studied from different areas: quality leaders' ideas, empirical research and formal evaluation models. This has helped to identify a set of critical factors for a successful implementation, as a way to improve customer satisfaction and performance. Through a detailed analysis of literature, this paper identifies thirteen critical factors with eighty five items for the successful implementation of TQM.
Table I Critical factors of quality management
Critical factors
Significance of critical factors
Leadership and top
management commitment
Management’s commitment to quality through communication with and motivation of employees. The behavioral patterns which show senior management’s personal involvement in the quality improvement process, acceptance of responsibility for quality performance, visibility in developing and maintaining an environment of organizational quality excellence and sharing the vision and quality goals with the entire company.
Customer focus
2013 | IJEDR1301007 INTERNATIONAL JOURNAL OF ENGINEERING DEVELOPMENT AND RESEARCH | IJEDR
(All right reserved by www.ijedr.org) 34 improving customer satisfaction.
Supplier quality management
Relation with suppliers in order to find the quality specifications demanded by the firm.
Continuous improvement
Indicates whether the firm has created an organizational structure (quality committee, a person in charge of quality and work teams) responsible for this improvement by identifying actions through information management.
Employee involvement
Employees, if they fully participate in quality improvement activities, will acquire new knowledge; realize the benefits of the quality disciplines; and obtain a sense of accomplishment by solving quality problems Companies need to develop formal systems to encourage, track, and reward employee involvement. Cross-functional quality improvement teams and quality circles, along with an appropriate evaluation and reward system for quality improvement projects, are helpful for improving quality Employees should be encouraged to submit suggestions and ideas for quality improvement.
Rewards and recognition
Companies must develop formal compensation systems to encourage, evaluate, reward and recognize the individual or team effort for quality enhancement and improved customer satisfaction. Employees should be made aware of the reward and penalty system.
Education and training
Measures whether the firm shows an interest in employees learning about all the basic aspects of the firm and its business by encouraging continuous learning. It should also include training in problem-solving and teamwork.
Strategic quality planning
The integration of quality management and customer satisfaction in the organizational strategic and operational plans, the organization’s long-term quality vision, and the deployment and understanding of quality goals and policy within the organization
Process management
Reflects how the organization controls and improves its processes by setting quality measures (level of customer satisfaction, quality cost).
Product innovation
Customer requirements should be thoroughly considered for product innovation. Approaches such as quality function deployment, and experimental design help companies translate customer requirements into action by cross functional product innovation teams.
Quality information and analysis
The availability of quality-related data, timeliness of quality-related data, and the usage of quality-related data at all levels in the organization
Quality citizenship
Consideration for public health, safety, and environmental issues as company’s responsibility. Extension of company’s quality leadership to the external community.
III. METHODOLOGY
Based on a review of TQM literature and expert opinions, thirteen TQM critical factors were identified. A detailed questionnaire was developed with the items for thirteen TQM factors along with the questions on quality performance and information about the respondents. The questionnaire was then sent to randomly selected manufacturing and service organizations in India. Based on the data from the survey, reliability and validity of the questionnaire was determined. Internal consistency analysis was done to ensure the reliability of the constructs. Content validity and construct validity were evaluated statistically to ensure that the set of measures correctly represents the constructs, and the degree to which they are free from any systematic or non-random error. A.Data Collection
2013 | IJEDR1301007 INTERNATIONAL JOURNAL OF ENGINEERING DEVELOPMENT AND RESEARCH | IJEDR
(All right reserved by www.ijedr.org) 35 used to test the reliability and validity of tool developed. It
comprises of
manufacturing
service
Figure 1: Manufacturing and Service Organizations
ISO
NON ISO
Fig 2 ISO and NON ISO Certified Organizations
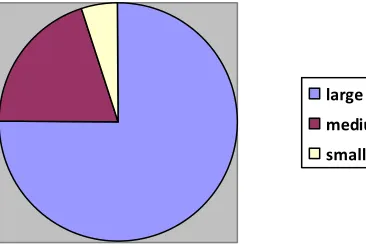
large
medium
small
Fig 3 Large, Medium, Small Scale Organizations
B.Reliability
Reliability is the ability of the instrument to measure consistently. Reliability is concerned with the dependability, stability, predictability, consistency and accuracy, and relates to the extent to which any measuring procedure yields the same results on repeated trials (Kerlinger, 1986; Carmines and Zeller, 1979). There are four methods which can be used for assessing reliability of empirical measurements. Among these four methods, the first three methods are rarely used in field studies, as it is difficult to administer the instrument twice with the same group of people or using two alternate forms of
measuring instrument (Saraph et al, 1989). In contrast, the internal consistency method is most commonly used in field research as it requires only one administration of the instrument. As the internal consistency method is the most general form of reliability estimation (Nunnally, 1978), it has been used in this study. The internal consistency method assesses the equivalence, homogeneity and inter-correlation of the items used in a measure.
The most popular test within the internal consistency method is the Cronbach’s coefficient α (Nunnally, 1978; Cronbach, 1951). Cronbach’s α computes internal consistency reliability among a group of items combined to form a single scale. It can also be computed for any subset of items. Nunnally (1978) advocates that new developed measures can be accepted with Cronbach’s α of more than 0.60, otherwise 0.70 should be the threshold. The measure with Cronbach’s α 0.80 or more is significant and reliable. For this purpose, the reliability for each set of items of the thirteen critical factors of TQM is calculated by using SPSS. Table 2 summarizes the Cronbach’s α for individual critical factors. The Cronbach’s α for the thirteen critical factors ranged from 0.9511 to 0.9908 indicating a high reliability of the instrument.
Table II Internal consistency method (Cronbach's Alpha (α)) using SPSS
Factor No: of
items
Cronbach's Alpha (α) Leadership and top
management commitment
7 .9707
Customer focus 7 .9917
Supplier quality management
5 .9511
Continuous improvement 7 .9609
Employees involvement 8 .9777
Rewards and recognition 4 .9700
Education and training 9 .9908
Strategic quality management
7 .9633
Process management/ operating procedures
7 .9693
Product innovation 5 .9612
Quality information and analysis
6 .9674
Quality assurance 7 .9807
Quality citizenship 6 .9646
C.Validity
The validity of a measure is defined as the extent to which a construct or a set of measures correctly represents the concept of study, and the degree to which it is free from any systematic or non-random error. Validity is concerned with how well the concept is defined by the measure(s), whereas reliability relates to the consistency of the measure(s).
2013 | IJEDR1301007 INTERNATIONAL JOURNAL OF ENGINEERING DEVELOPMENT AND RESEARCH | IJEDR
(All right reserved by www.ijedr.org) 36 by expert judges or other means. The objective of the content
validity is to ensure that the selection of construct items extends past empirical issues to also include theoretical and practical considerations (Robinson et al., 1991).
The ten critical factors for measuring TQM implementation should have content validity, as the measurement items were developed based on both an extensive review of the literature and detailed evaluations by academicians and practicing managers. Moreover, the pretest subjects indicated that the content of each critical factor was well represented by the measurement items employed.
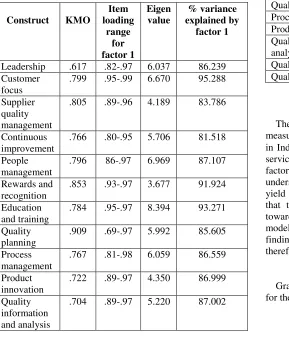
Construct validity. A measure has construct validity, if it measures the theoretical constructs that it was intended to measure. Factor analysis can be used for evaluating construct validity. Factor analysis helps to analyze the interrelationships among a large number of variables and explains these variables in terms of their common underlying dimensions (constructs). It also helps reduce data that do not correlate with any of the underlying dimensions. The general purpose of factor analysis is to find a way to condense the information contained in a number of original variables into a smaller set of new, composite dimensions or constructs with minimum loss of information – that is, to search for and define the fundamental constructs or dimensions assumed to underlie the original variables (Hair et al., 2005). This measurement is calculated through a factor analysis for each of the thirteen factors. In this analysis, each factor must be one dimensional. Hence the developed tool is found to be valid. The summary of factor analysis of each measure is shown in Table III.
Table III Summary of factor matrix for each measure
Construct KMO
Item loading
range for factor 1
Eigen value
% variance explained by
factor 1
Leadership .617 .82-.97 6.037 86.239 Customer
focus
.799 .95-.99 6.670 95.288
Supplier quality management
.805 .89-.96 4.189 83.786
Continuous improvement
.766 .80-.95 5.706 81.518
People management
.796 86-.97 6.969 87.107
Rewards and recognition
.853 .93-.97 3.677 91.924
Education and training
.784 .95-.97 8.394 93.271
Quality planning
.909 .69-.97 5.992 85.605
Process management
.767 .81-.98 6.059 86.559
Product innovation
.722 .89-.97 4.350 86.999
Quality information and analysis
.704 .89-.97 5.220 87.002
Quality assurance
.715 .91-.97 6.289 89.838
Quality citizenship
.668 .85-.96 5.131 85.516
The construct validity is also determined by using multitrait multimethod matrix (MTMM). Multitrait multimethod matrix analysis allows us to detangle correlations between instruments due to similarity of test methods form and similarities due to tapping the same attribute. The MTMM is simply a matrix or table of correlations arranged to facilitate the interpretation of the assessment of construct validity. The basic principle of MTMM matrix is coefficients in the reliability diagonal should consistently be the highest in the matrix. MTMM matrix of thirteen critical factors is shown in Table IV.Hence we conclude that the tool developed is valid.
Table IV Average Inter Attribute and Intra Attribute Correlations
Critical Factor Intra
Attribute Correlation
Inter Attribute Correlation
Leadership 0.843 0.697
Customer focus 0.922 0.700
Supplier quality management
0.866 0.586
Continuous improvement 0.831 0.640
People management 0.892 0.729
Rewards and recognition 0.926 0.703
Education and training 0.929 0.581
Quality planning 0.869 0.593
Process management 0.876 0.704
Product innovation 0.891 0.460
Quality information and analysis
0.887 0.689
Quality assurance 0.908 0.734
Quality citizenship 0.873 0.671
IV. CONCLUSION
The research develops an empirically based instrument for measuring the TQM implementation in different organizations in India. This tool can be applied to both manufacturing and service organizations. This study provides thirteen critical factors of TQM as a model allowing managers to have a better understanding of quality management practices .The results yield a reliable, valid scale and provide empirical support so that the managers know what to do in order to advance towards total quality management By periodically using this model, it may serve to evaluate a firm’s quality standards, finding those areas where improvement is necessary and, therefore, planifying the quality management effort.
ACKNOWLEDGMENT
2013 | IJEDR1301007 INTERNATIONAL JOURNAL OF ENGINEERING DEVELOPMENT AND RESEARCH | IJEDR
(All right reserved by www.ijedr.org) 37 REFERENCES
[1]. Ahire, S.L., Golhar, D.Y., Waller, M.A., 1996. Development and validation of TQM implementation constructs, Decision Sciences 27 (1) 23-56.
[2]. F.J. Conca ,Juan Llopis,Juan Jose Tari, Development of a measure to assess quality management in certified firms, European Journal of Operational Research 156 (2004) 683– 697.
[3]. Anupam Das, Himangshu Paul and Fredric W. Swierczek, Developing and validating total quality management
(TQM)constructs in the context of Thailand’s manufacturing industry./www.emeraldinsight.com/1463-5771.htm
[4]. Calculating, interpreting, and reporting Cronbach’s Alpha Reliability Coefficient for Likert-Type Scales. Joseph A. Gliem ,Rosemary R. Gliem