731 AN APPLICATION OF STEREO MATCHING ALGORITHM FOR WASTE BIN
LEVEL ESTIMATION
Md. Shafiqul Islam1 M.A. Hannan2
Hasan Basri3
ABSTRACT
In this paper, region based stereo matching algorithms are developed for extraction depth information from two colour stereo image pair of waste bin. Depth calculation technique from a
disparity map is a key part of this study. A filter eliminating unreliable disparity estimation was used for increasing reliability of the disparity map. Global Error Energy has calculated from the
stereo images and smoothing function has developed within the error energy matrix. Depth has calculated from the disparity map. A technique for depth estimation and various application of this algorithm has discussed, various algorithms for depth feature extraction are also discussed. GUI
has developed using Matlab for classifying the waste bin. It obtained results by algorithms were
presented and compared.
Key Words:Stereo matching; level estimation; feature extraction; image processing.
INTRODUCTION
Intelligent systems, which can move around by itself, could be developed by obtaining depth information from the sensors (Arebey et al. 2012). Depth information is required for various
automated systems like robotics, navigations, feature extractions, etc (ALAGÖZ, 2008). This study is conducted to develop an image-processing system for waste bin depth level estimation. There
are limited researchers studied the detection depth level of the waste bin (Arebey et al. 2011). The level for liquid's waste tanks has been investigated by many researchers, but it is not applicable for waste bin level detection (Hannan et al. 2011a). LEDs level sensors and wireless communication
equipment are used to estimate the level inside the container (Johansson 2006). The bins equipped
1
Department of Electrical, Electronic and Systems Engineering.
2 Department of Electrical, Electronic and Systems Engineering. 3
Department of Civil and Structural Engineering Universiti Kebangsaan Malaysia
Journal of Asian Scientific Research
732
with level sensors improved the collection process, dynamic scheduling and routing policies. This
system is not much economic for waste bin monitoring as there are large numbers of sensors and huge area of wireless network coverage is required. (Islam et al. 2012; Reverter et al. 2003). A point level capacitive sensor has developed for the bin which was built by low-cost adhesive
metallic (Patricia et al. 2010). Few researches so far utilized the image-processing techniques to estimate the bin level. Politecnico diMilano and Shanghai Jiao Tong University developed
automated bin collection and proposed set of sensors mounted onto the bin in which bin level was calculated on the basis of the interaction of image processing and a digital distance sensor (Rovetta et al. 2009). Some studies have compared the performance of the algorithms (Scharstein et al.
2002). Subtracting two images from each other is a simple technique in image processing. The contamination of the bin that affects the image quality is hard to estimate (Thomas 2003; Hannan et
al. 2011b). For these reasons new methods must be developed to achieve high efficiency. Obtaining reliable depth maps, indicating distance of surface from the stereo camera pair, have importance in robotic applications and autonomous systems for depth features extraction. Stereovision is the one
of methods that can yield depth information of the scene. It uses stereo image pairs from two cameras to produce disparity maps that can be easily turned into depth maps. Reliability of depth
maps and computational cost of the algorithm is key issue for implementing real time robust applications.
ALGORITHMS AND METHODS
Global Error Energy Minimization
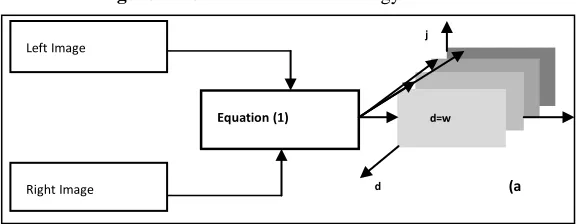
In this method, block-matching technique has been used in order to construct an Error Energy
matrix for every disparity. The left image in RGB format is denoted by L(i, j,c), the right image in RGB format by R(i, j, c) and error energy by e(i, j, d). For n x m window size of block matching, error energy e (i, j, d) has expressed as follows (Sayed and Rupp 1996),
3
2
1
1
( , , )
( ( ,
, )
( , , ))
3. .
j m i n
x i y j k
e i j d
L x y
d k
R x y k
n m
(1)Where, c is RGB components; d is the disparity; (i, j) is the RGB pixel dot. The error energy matrix from the disparity has shown in Figure 1.a
Figure -1. Construction Error Energy Matrix
Right Image Left Image
Equation (1)
j
d
d=w
733
For every error energy e(i, j, d) the matrix with respect to disparity is smoothed by applying
averaging filter. The averaging filter (linear filter) removes the sharp changes in energy, which possibly belongs to incorrect matching (Chan et al. 2001). Local filtering in iterations could solve a global total variation optimization problem. Considering a global trend in error energy naturally
makes this algorithm a region based algorithm. For n x m window size, averaging filtering of e(i, j, d) can be expressed as follows (Rabiner and Gold, 2000),
1
( , , )
( , , )
.
j m i n
x i y j
e i j d
e x y d
n m
(2)After iterative application of averaging filtering to error energy for each disparity (d), has minimum
error energy 𝑒 (i, j, d) as the most reliable disparity estimation for pixel (i, j) of disparity map shown in Figure 1.b The basic steps of algorithm are as follows,
Figure- 1. Depth Map by Min. Energy Point
Line Growing Based Stereo Matching
The algorithm is based on region growing, consider the region-growing mechanism it has two phases operation. Firstly, finding root point to grow region and secondly, growing region for
a root point corresponding to predefined rule. The disparity growing process steps are as followings,
Step 1:
Select a point and find its disparity using energy function equation (1). Set it root point and set its disparity to region disparity then go to step 2. If it didn’t find any disparity, repeat this step for the next point.
Step 2:
Calculate error energy of neighbour points for root point disparity, which were called region
disparity. If it is lower than the predetermined error energy threshold, associate this point to region. Otherwise, left it is free.
Step 3:
In the case region growing is completed, turn back to step 1 to find out new root point to repeat
these steps. When all points are processed, stop the algorithm. Grown disparity regions composes disparity map, d(i, j).
d=w Min {e(i,j,d)}
d(i,j)
Depth Map b
734
In order to reduce complexity of the algorithm the growing in the direction of rows since disparity
of stereo image is in row directions. So, only one neighbour, which is the point after searched point, is inspected for region growing shown in Figure 2. This type of algorithm is called as line growing.
Figure- 2. Region Growing Process
Depth Map Generation from Disparity Map
The depth and disparity relation with stereo projection has illustrated in the Figure 3. By
considering the figure, relation between depth (Z) and disparity (d) by using basic geometrical calculations as follows,
( , )
( , ) T Z i j f
d i j
(3)
If reallocation of object surface projected at pixel (i, j), then X and Y after calculation of Z:
X Z f i
f
; Y Z f f
f
(4
In order to obtain smoother depth map 5x5 window sized median filtering has applied to disparity (d) before computing depth (Z)
Figure-3. Stereo Camera
RESULT AND DISCUSSION
Test images and their ground-truth images are seen in the Figure 4. Results of algorithms has introduced in the paper for the test images. Global Error energy minimization by smoothing
735 Figure- 4. True Colour Test images: Right and Left Images; FIGURE 5: Error Energy Minimization for point matching window (1x1)
In the Figure 6 it presents RGB histogram of disparity, calculated from the stereo images using the
line growing algorithm. Increasing threshold value the algorithm becomes tolerant of the error energy, and it results increasing line wide in regions and reduce the point in idle status. Therefore,
higher threshold makes the disparity estimation smoother without additional cost of computation.
Median filtering application has suggested on the 𝑑 by a wide windows size in the practical applications. In the Figure 7, it shows GUI for waste bin level classification for test stereo images. The left image and right image is used to generate a disparity map. In this case error energy matrix
has created for stereo images and smoothing function is used for disparity map, it gives a better
result than subtraction algorithm. Here, 𝑑 was smoothed by a median filter with 5x5 window size.
Figure- 6. RGB Histogram for Stereo Imges
Figure- 7. GUI for Waste Bin Level Classification
CONCLUSION
Line growing method is more convenient for the sequential computing architectures because of promising higher speed. Filtering unreliable disparity estimation by average error thresholding
increased the reliability of disparity map. Median filtering with large window size makes the disparity and depth maps smoother. For the practical application of stereovision in level estimation
(5) (4)
(4)
(6)
736
quite smooth disparity estimation is needed to make the system vision robust against the faulty
decisions in bin classification application.
ACKNOWLEDGEMENT
The authors would like to thank Universiti Kebangsaan Malaysia and also to The Malaysian
Ministry of Science, Technology and Industry for sponsoring this work under “UKM-DLP-2012-002”.
REFERENCES
Arebey, M., Hannan, M.A., Begum, R.A., Basri, H (2012) "Solid waste bin level detection using gray level co-occurrence matrix feature extraction approach" Journal of Environmental Management Vol. 104, pp.9-18
ALAGÖZ, B.B (2008) "Obtaining Depth Maps from Color Images By Region Based Stereo Matching Algorithms" OncuBilim Algorithm And Systems Labs, Vol .08, No. 04, pp. 1-13
Arebey, M., Hannan, M.A., Hassan, B. Begum, R.A., Abdullah, H (2011) "Integrated technologies for solid waste bin monitoring system" Environ Monitoring Assess Vol.177, pp.399-408.
Hannan, M.A., Arebey, M., Begum, R.A., Basri, H (2011) Gray level aura matrix: An image processing approach for waste bin level detection, World Congress on Sustainable Technologies, WCST 2011, pp.77-82.
Johansson, M (2006) "The effect of dynamic scheduling and routing in a solid waste management system" Waste Management Vol. 26, pp.875-885.
Islam, M.S., Hannan, M.A., Arebey, M., Basri, H (2012) "An Overview for Solid Waste Bin Monitoring System" Journal of Applied Sciences Research Vol. 8, No.2, pp.879-886.
Rovetta, A., Fan X., Vicentini, F., Zhu, M., Giusti, A., He, Q (2009) "Early detection and evaluation of waste through sensorized containers for a collection monitoring application" Waste Management, Vol. 29, pp.2939-2949.
Vicentini, F., Giusti, A., Rovetta, A., Fan, X., He, Q., Zhu, Z (2009) "Sensorized waste collection container for content estimation and collection optimization" Waste Management, Vol. 29, pp. 1467-1472.
Thomas, V. M (2003) "Product self- management: evolution in recycling and reuse" Environmental Science and Technology, Vol. 37, pp.5297-5302.
Chan, T.F., Osher, S., Shen, J. J (2001) "The digital TV filter and nonlinear denoising, Image Processing" IEEE Transaction, Vol. 10, pp. 231-241.