FORESTRY
SECTOR
AND
POLICIES
ON
SUSTAINABLE
DEVELOPMENT IN VIETNAM: ANALYZE FROM THE INPUT -
OUTPUT MODEL
Duong Manh Hung1
Bui Trinh2+
1Director of Vietnam System of National Accounts Department, Vietnam
General Statistics Office, Vietnam.
2Association of Regional Econometrics and Environmental Studies
(AREES), Vietnam.
(+ Corresponding author)
ABSTRACT
Article History Received: 8 August 2019 Revised: 16 September 2019 Accepted: 18 October 2019 Published: 29 November 2019
Keyword
s
Deforestation Economic Forestry Input – output Greenhouse gas Vietnam.
Deforestation in Vietnam is among the most serious in the world, with many causes but the main reason is not seeing the importance of the forestry sector. Authorities seem to be "crazy loving" the GDP indicator, so it seems that everything is compared to GDP; If the ratio of a certain industry in GDP is low, it seems that the industry is not important enough! This study tries an attempt to estimate distribution of forestry to economy and environmental. This study uses an input - output system to highlight the importance of the forestry sector not only to the environment but also to the economy. The results from this analysis show that about 90% of the forest products are used for intermediate consumptions (for production) and only 10% for final uses, especially timber products. The imported value of the forest sector accounted for 43.76%, implying a need to change the plantation structure to increase the high value of timber from long rotation plantation forest to meet domestic and export demands. Researching also shows that in order to increase the value of timber exports, particular attention should be paid to the structure of the plantation forest towards converting to long rotation plantation forest. In term of environmet, the results show the role of afforestation in reducing emission. Moreover, the production of timber and wood processing sector also stimulates the planting and tending sector. Therefore, encouraging these sectors will spill over reducing emission.
Contribution/ Originality:
This study contributes to the existing literature by estimating distribution of forestry to economy and environmental.1. INTRODUCTION
The fact that deforestation in Vietnam is one of the top problems in Vietnam. According to FAO (2005)
Vietnam has the second highest rate of deforestation in the world, only behind Nigeria (Butler, 2005). There are many causes but the main reason is due to the weak management and corruption in forest protection. Types of deforestation are becoming more sophisticated and blatant such as forest conversion, approval of investment projects to deforest. In order to prevent deforestation, the Prime Minister of Vietnam issued a directive to close down natural forest exploitation (Notice No. 191 / TB-VPCP in 2016) (Vietnam Prime Minister, 2016). Moreover, in 2017, the Prime Minister approved the National Action Program on sustainable management of forest resources,
International Journal of Social and Administrative Sciences
ISSN(e): 2521-0556
DOI: 10.18488/journal.136.2019.42.253.266 Vol. 4, No. 2, 253-266.
conserving and enhancing forest carbon stocks associated with sustainable livelihoods until the year 2030 according to Decision No. 419 / QD-TTg in 2017 (VPM, 2017).
According to the survey results of Vietnam General Statistics Offical (GSO) showed that by the end of 2016, the country had 14,377,682 hectares of forest. In which natural forest is 10,242,141 ha and planted forest is 4,135,541 ha. If compared to the total natural area of the country is 33,095,250 ha, the coverage rate is now 41.19%, the end of 2018 and this ratio reached 41.65% (Ministry of Agriculture and Rural Development, 2019).
This study is concerned not only with the added value of the forestry sector which accounts for the percentage in total value added (GVA) or GDP but also the interdisciplinary relationship to show the impact of the forestry sectors group on economic and environmental in Vietnam
2. LITERATURE REVIEWS
In the 1930s, the general theory of Keynes.J.M was introduced to explain the phenomenon of crisis and economic recession of the world in these years. That changed the perception of economists of the time that they used only the notion of national income as the only economic measure of a nation (Keynes, 1931). Based on the general theory and economic schema of Francois Quesnay, in 1941 Wassily Leontief introduced the Input-Output model (IO). He published this model in the famous study "Structure of the US economy" (Leontief, 1941). The IO table is the model that reflects the picture of whole production activity of the economy. It reflects cross-sectoral/inter-regional relationships in the production and use of products for final consumption, asset accumulation, and the export of goods and services across the economy. In addition, the IO table shows how much of the product of the other sector / region is needed to produce the final product of an industry/region and how much of that product/sector is produced by the industry/region. This allows the analysis of relationships, the assessment of production efficiency and the calculation of other comprehensive indicators for macroeconomic management, economic analysis and forecasting. Input-output techniques is a deeper analysis being carried out to study and quantify direct and indirect as well as induced impact of forestry sector and its main components, in the economy as a whole and by various activities and sectors of the national economy.
Rohanabt (2008) showed that the IO model is widely used in the study of economic structural changes for several reasons. First, an IO table provides a comprehensive and consistent statistical account of an economy by taking into account the most important economic transactions (or direct input coefficients), which generally cannot be obtained from a national statistical book in most countries, especially in developing ones. Second, an IO table explicitly accounts for the interdependence of different economic activities by incorporating the size and composition of the various industries’ mutual input demands (measured by interdependent coefficients or the Leontief inverse), which enable us to incorporate both direct and indirect industrial interrelations into the analysis. Third, as the comparison takes two or more snapshots of the economy at different moments to analyze the changes over a period of time, it exploits most of the advantages of the IO framework and avoids the static nature of the method. Finally, the fourth, within the IO framework, it is possible to decompose the structure changes into different components, such as final demand, import substitution, export expansion, and technological change. According to Baumol and Gomory (1994) Input-output analysis becomes indispensable for rational policy formulation where two conditions hold: (1) inputs, as well as outputs, enter society's objective function directly (as in the case of employment, limited energy resources or pollution): and (2) where the economy in question is open, so that macroeconomic policy is largely powerless to increase employment or to influence the use of other inputs.
General Statistics, 2015). Sofilda and Hamzah (2016) used Input Output table to analyze three parts regarding (1) the performance consists of contributions of input, output and final demand (2) a multiplier analysis which consists of multiplier output, multipliers household income and the multiplier employment; (3) analyzing the structure consists of a link, either linkage to the front (forward linkage) and backward linkages, and the analysis of changes in economic structure by comparing Multiplier Product Matrix (MPM).
Chen et al. (2015) used the IO table to understand the state of forest resource utilization and correctly evaluating the role and function of forest resources in China economic development. The results show that demand for and input use of forest resources varies greatly across industrial sectors; the paper products and furniture manufacturing industries have the greatest direct consumption coefficient for timber use. Henderson et al. (2008)
had study evaluates the importance of the forest products industry to the state’s economy and the economy of five forest regions within the state established by the Mississippi Institute for Forest Inventory: north Mississippi, southeast Mississippi, southwest Mississippi, central Mississippi and the Delta. The result showed that forest product has the dynamic impact on Mississippi’s economy. Ochuodho and Alavalapati (2016) applied the computable general equilibrium model in order to analyze Integrating natural capital into system of national accounts for policy analysis
In Vietnam, there are also somestudies on using input-output model to analyzeandforecast the economic, which are related to the economic structure. Trinh et al. (2008) introduced the basic concepts of the importmultiplier, this research allowed us to calculate the power of dispersion on import ofall economic sectors. Trinh and Kobayashi (2011) presented an attempt to estimateair emission when changing economic structure.Besides several studies analyzing inputoutput model and economic structure in Vietnam, the IO table also used to analyze the economic structure and capital structure for a ―Greener‖ economy (Tu et al., 2016). These research analyzed Vietnam economic structure change based on Vietnam input-output table 2012 and 2016; they concluded that the structure in priority order of Vietnam should be Services, Agriculture and finally Industrial. In which, the agriculture-forestry-fishery sector has a good power of dispersion, sensitivity on production, the induced impact of final demand to value added. This sector needs capital and high-quality human resources as well as policy support to be able to develop sustainably. According to FAO (2005) the contribution of the forestry sector to national economies is one dimension of sustainable forest management. In countries and regions where the contribution to national economies is high, this information can be used to gain the attention of important policymakers. It can also be used to respond to the general perception that the sector is relatively unimportant and to highlight the contribution of the sector to poverty alleviation. In addition, there are a few studies on using input - output system to analyze and measure the linkages between economic and environment as Trinh and Quoc (2017); Trinh and Hoa (2017). In these studies, the authors used direct emission coefficient vector of China to estimate emission for Vietnam by sectors. By using the Vietnam input - output table in 2012, they measured the impacts of economic activities to environment.
In this study, the authors use updated IO table in 2016 and the direct emission coefficient vector of Vietnam to consider the interactions of the forestry sector not only in economics but also its impacts on the environment, especially greenhouse gas (GHG).
3. DATA SOURCES
The Vietnam national input – output table in 2012 and 2016 were classifed in 32 sectors and 18 sectors
Appendix 1 and Appendix 2, esseciallythe forestry sector group was divided four sectors in researching on economic and aggregated two sectors in researching in GHG emission1. Four sectors of forestry group include Forest
planting and tending products; Wood exploitation; Other forest products; harvested from the forest; and Forestry
service. In the case to research on GHG emission the four sectors of forestry were aggregated in two sectors: Forest planting and tending products and other forestry.
Data on greenhouse gas emission ratios directly by sector was collected from the Ministry of Natural Resources and Environment (MONRE) and published in the report "The Initial Biennial Updated Report of Vietnam to The United Nations Framework Convention on Climate Change‖ (Ministry of National Resource and Environment, 2014) - Name of sectors in the input - output table in Appendix 3. However, this report only include the GHG emission data from 2010 and 2013. Thus, GHG emission for 2016 was estimated according to the formula:
Ei(tn)/Ei(t0)(1/(tn-t0-1)).k.Ei(tn) = Ei(tk)
Where: E present emission of GHG, i present sector ith; tn present year n, t0 benchmark year, andtk present
year k with tk>tn>t0.
Direct GHG emission coefficient according to 18 economic sectors is shown in Appendix 3.
4. METHODOLOGY
W. Leontief put forward the linear function’s system for relationship between supply and demand of economy by sectors, solved at below:
∑njXij + Yi = Xi (1)
And ∑niXij + Vj = Xj (2)
Where: Xij present sector j used product i as input; i,j = 1….n with n is number of sectors in input-output
model; Yi is final product of product i; Xi is gross output of product i (total demand of product i) and Vj is value added of sector j. The Equation 2 was present by transposed the input – output system.
Put aij = Xij/Xj and Equation 1 we have:
∑njaijXj + Yi = Xi (3)
Rewrite the Equation 3 to matrix form:
A.X + Y = X (4)
With: A = (aij)(nxn); Y = (Yi)(nx1); X = (Xi)(nx1). The Equation 4 is Leontief’s standard, this equation can rewrite as
follow:
X = (I – A)-1.Y (5)
The Equation 5 present for input – output model with competitive – import type, in order to understand further on induced effects of change in domestic final demand to value added, the input – output model with competitive import type should move to the input – output model with non-competitive import type:
Call: Y = C + G + I + E – M (6)
Analysis of matrix A and vector Y using domestic and imported products, Equation 5 can be rewritten as below:
Ad.X + Am.X + Cd + Cm + Gd+ Gm + Id + Im +E = X (7)
Call: Cd + Gd+ Id +E = Yd
And notice Am.X + Cm + Gm + Im = M
From Equation 4, Equation 5, Equation 6 và Equation 7 we have:
Ad.X + Yd = X (8)
The Equation 8 can be rewritten as follow:
X = (I – Ad)-1.Yd (9)
With (I-Ad)-1 is the Leontief inverse matrix and Yd is the domestic final demand matrix, including the final
Let v be vector as value-added coefficient with vi = Vi/Xi, where, Vi is the added value of sector i and Xi is the
production value of sector i. Multiply both sides of Equation 9 with vector v, we have:
V = v. (I-Ad)-1.Yd (10)
Similarly, e is the direct emission coefficient matrix by sector with ej= Eij/Xj. Here, Eij is the amount of direct waste produced by sector j in the production process. Multiply both sides of Equation 9 with vector v, we have: E = e. (I-Ad)-1.Yd (11)
From these equations, we can estimate the induced impacts of factorial of final demand to output, value added and emission as follows: GOm = X ÷ ∑Y (12)
VAm = V ÷ ∑Y (13)
Em = E÷ ∑Y (14)
Where: ÷ shows scalar division In this research, the matrix A is divided to sub-matrices for forestry sectors group and other sectors in the economy as follow: A =
ss d sr d rs d rr dA
A
A
A
(15) Where: Adij is intermediate input matrix of sector j that used products i. Matrix B also includes sub-matrices corresponding as matrix A, then we have: B = (I- Ad)-1 =
ss d sr d rs d rr dB
B
B
B
(16)Bijd is sub–matrix of Leontief inverse matrix that shows one unit of change in the production of a certain sector can lead to a combination of both direct and indirect changes in other industrial sectors, the output vector (X) was created by final demand as follows: X =
rs sr ss ss ss rr sr rs rr ss rs sr rs rr rrY
B
Y
B
Yrc
B
Y
B
Y
B
Y
B
Y
B
Y
B
.
.
.
.
.
.
.
(17)Follow Miyazawa (1976) the matrix B can be divided as: Brr = (I – Arr – Ars.(I – Arr)-1.Asr) (18)
Bss = (I – Ass – Asr..(I – Ass)-1.Ars) (19)
Brs = Bss.Ars(I-Ass)-1 (20)
Bsr = Bss.Asr( I – Arr)-1 (21)
For this reason, Equations 18and19are multiplier and inter-industrial feedback effects, theEquation 20and
21are spillover effects, we can define the three constitutive elements in the above formula:
Inter – industrial feedback effects. After the unit of final demand in certain industry has influenced upon others industries, this influence will in its turn produce a feedback effect upon the very industry. In particular, it can be expressed as: Brr - (I – Arr)-1.
Spillover effects: The spill-over effect can be defined as the sum of both direct and indirect influence of the unit of final demand in a certain industry upon the output of intensive sectors and other sectors. These effects are a single-directional effect, reflecting the industry’s impact capacity. In particular, it can be expressed as: Bsr and Brs.
From equating 8, 9 and 15 we have:
XS = (I – ASS)-1.ASR.XR (22)
XR = (I – ARR)-1.ARS.XS (23)
Or
∆XS = (I – ASS)-1.ASR.∆XR (24)
∆XR = (I – ARR)-1.ARS.∆XS (25)
Relations 22, 23, 24, 25 show that when a sector/sector group changes will lead to other sector group change. When output of group sector R (S) increase a unit will lead to the change on output of S (R) are:(I – ASS)-1.ASRand (I – ARR)-1.ARS
In the case the output matrix (X) has form:
X =
Where: Xrr is output of sector group R that was induced by final demand of sector group R used products of sector group R, Xrs is output of sector group R when sector group S used products of sector group R. The same for Xss and Xsr
From the general relationship of Leontief system, we can estimate value added created by final demand of sector group R and S as follows:
(VR, VS) = (vr,vs).X (26)
Thus, the using products of sector group R induced to value added of both sector groups R and S. Total value added that induced by final demand of sector group R are solved: Vr.Xrr + Vs.Xsr.
And total value added that induced by final demand of sector group S is: Vr.Xrs + Vs.Xss.
Gross value added of a sector group was induced by final demand on products of them self and their products were used by other sectors. For example, gross value added of sector group R can be solved:
Vr.Xrr + Vr. Xrs (27) And gross value added of sector group S:
Vs.Xss + Vs. Xsr (28)
5. EMPIRICAL RESULTS
5.1. Economic AnalysisTable 1 show on the demand side, the total of 90% of the forest productsareused for intermediate consumptions (for production inputs of other sectors in the economy) and only 10% for final uses; in which, the intermediate demands of forest planting and tending products are very high exceeded 99.87%, only 0.13% products used for final demands, and the demand for timber products exceeded 35.2% of the timber production capacity and therefore imported value of the forest sector still accounted for 43.76%. To meet the domestic production and end-use demands, this needed volume of timbers must be imported. Table 2 shows that although imported volume of timbersis about 21% (of 2016) while value of imported wood extraction accounts for 71.6%, indicating that high
ss sr
rs rr
X X
quality/value wood is essential for intermediate demand of the country, especially for furniture industry. This implies a need to convert the plantation forest structure to increase the high value/qualitytimbers planted from long rotation plantation forest to meet domestic and wood processing industry. For wood extraction, the final demand accounts for only 15% and 85% for intermediate demand (wood processing industries e.g., indoor/out door furniture, paper and furniture etc.) This indicates the vital role of forest sector in inducing value added to other sectors in the economy in general and GDP in particular.
On the supply side, wood extraction value accounts for only 28.39%2 reflecting the fact that the price of wood
extracted products are very low while wood materials imported with very high price. The value added of the forest sector has most probably been incurred along processing and trading nodes of the forest value chain. The imported wood only has the effect on forest extraction (exploitation) but on the other subsector of the forest.
Table-1. Supply and Demand size of forest sub-sectors. Unit: %
Forest planting
& tending exploitation Wood products; harvested Other forest Forestry service Forestry sector
Demand size
Intermediate
demand 99.87 84.97 84.28 100.00 90.08
Final
demand 0.13 15.03 15.72 - 9.92
Total
demand 100.00 100.00 100.00 100.00 100.00
Supply size
Domestic
production 100.00 28.39 100.00 100.00 56.24
Import - 71.61 - - 43.76
Total supply 100.00 100.00 100.00 100.00 100.00
Source: Estimate from the Vietnam input-output table, 2016.
Table 2 shows that power of dispersion and sensitivity indexes of four sub forest sectors. The magnitude of both indexes of Forest planting and tending products are higher than the average of forest sector: the dispersion index and sensitivity index are 0.92 and 1.55 respectively, showing this subsector has the biggest effect to other forest sub-sector and 28 remaining sectors in the economy among the four subsectors of the forest while this subsector is also quite sensitivity to the changes of other sectors in the economics and so do other sectors be as this subsector’s changes. This means that if the forest plantation and tending is improved, it will have positive effects on the development of the other sectors in the economy. The wood extraction effect on domestic production is lower than that of the overall average, so does the forestry sector. It can be explained that products of wood extraction sub-sector are mainly inputs of the other sectors in the economy 3and while the Forest planting and tending
products are mainly inputs for other sub-sectors of forestry sector. The sensitivity index of the forest planting and tending subsector is higher than average (1.55) also illustrates that the products of this subsector are either inputs for itself or inputs for other subsectors of the forest sector and other sectors of the economy. All other three forest subsectors have the both power of dispersion and sensitivity indexes lower than average (on less than 1.0), this partly shows neither the forestry sector, in general, does spread very strongly effect on the others nor other economic sectors do on the forestry sector see the results in Table 2.
2The volume of imported wood in 2016 accounted for about 21.35% of total wood supply in the country (MARD).
3In this case, the input-output table with non-competitive – import type was used. The Equation 6, Equation 7 and Equation 8 show on as presented in the
Table-2. Power of dispersion and sensitivity for dispersion indexes of forest sector group. Unit: Times
Forest planting and
tending products Wood extraction products; harvested Other forest Forestry service
Spillover effect 0.92 0.75 0.84 0.79
Sensitivity 1.55 0.69 0.57 0.54
Sources: Calculated from Vietnam input-output table, 2016.
Table 3 shows while multiplier effects -inter-sectorial effects of forestry on the overall economy performance, are quite low, however, the spillover effects of forestry sector in general and wood extraction subsector in particular are very impressive; The irony is that the sub-groups in the forestry sector cause effects each other by themselves: group 1: Forest planting and tending products; group 3: Other forest products; harvested from the forest; and group 4: Forestry service).
Table-3. Multipliers analysis. Unit: Times
BL4 Multiplier
effects Induced effects Spillover Effects PoD 5on BL
PoD on multiplier
effects
PoD on induced effects
PoD on Spillover
effects
1 1.789 1.504 0.004 0.281 0.924 0.806 0.701 4.488
2 1.457 1.365 0.002 0.090 0.753 0.731 0.296 1.441
3 1.619 1.274 0.011 0.335 0.837 0.682 1.764 5.354
4 1.529 1.282 0.004 0.243 0.790 0.687 0.617 3.884
5 1.929 1.911 0.003 0.016 0.997 1.024 0.462 0.250
6 2.938 2.918 0.003 0.017 1.518 1.563 0.506 0.264
7 2.482 2.468 0.002 0.012 1.283 1.322 0.346 0.190
8 1.759 1.751 0.001 0.006 0.909 0.938 0.169 0.102
9 2.887 2.863 0.004 0.021 1.492 1.534 0.611 0.328
10 2.082 2.056 0.004 0.022 1.076 1.102 0.636 0.355
11 1.965 1.950 0.002 0.013 1.015 1.045 0.362 0.208
12 2.343 1.818 0.077 0.447 1.211 0.974 12.687 7.146
13 2.137 2.118 0.003 0.016 1.104 1.135 0.514 0.263
14 2.146 2.123 0.003 0.019 1.109 1.138 0.561 0.308
15 1.848 1.837 0.001 0.009 0.955 0.984 0.237 0.142
16 1.919 1.760 0.019 0.140 0.992 0.943 3.039 2.238
17 1.507 1.498 0.001 0.008 0.779 0.803 0.184 0.123
18 1.742 1.724 0.002 0.016 0.900 0.924 0.377 0.253
19 2.103 2.079 0.003 0.021 1.087 1.114 0.566 0.329
20 1.753 1.733 0.003 0.017 0.906 0.929 0.449 0.265
21 1.988 1.972 0.002 0.014 1.027 1.056 0.368 0.228
22 2.282 2.265 0.003 0.015 1.179 1.213 0.426 0.241
23 2.028 2.000 0.004 0.024 1.048 1.072 0.665 0.381
24 1.777 1.765 0.002 0.010 0.918 0.945 0.278 0.167
25 1.627 1.616 0.002 0.009 0.841 0.866 0.254 0.152
26 1.864 1.838 0.004 0.022 0.963 0.985 0.617 0.356
27 1.817 1.790 0.004 0.024 0.939 0.959 0.582 0.381
28 1.617 1.594 0.003 0.020 0.835 0.854 0.525 0.315
29 1.534 1.518 0.002 0.014 0.793 0.813 0.355 0.219
30 1.845 1.831 0.002 0.012 0.953 0.981 0.320 0.186
31 1.834 1.752 0.012 0.070 0.948 0.938 1.976 1.121
32 1.776 1.753 0.003 0.020 0.918 0.939 0.551 0.321
Source: Estimate from Vietnam input-output table, 2016.
4BL: Backward linkages
From the data of the input-output table, we can see that the economic sector 12 (manufacture of wood, paper & related products; printing) and sector 16 (manufacture of furniture & other goods; repair & installation) had been highly impacted by sector 2 (wood extraction) with the power of dispersions on spillover effect of 7.146 and 2.238 and powerof dispersion on induced effect of 12.687 and 3.039 for the manufacture of wood, paper & related products; printing (sector 12) and manufacture of furniture & other goods; repair & installation (sector 16) respectively. These results reflect the fact that products of wood extraction are main inputs for those two sectors. The positive change of wood extraction sectors towards meeting the high demands from wood processing related industries will have great contribution for the economic growth.
Table 4 shows that output of the forestry sector by the factor of domestic final demand, among the other factors of the final demand (final consumption and gross capital formation), was induced the highest by export sector, while induced impact of export to output of whole economy was quite similar among three components. As accounted in the input-output table, the export of the forest sector is basically the export of timber or other non wood products collected from the forest (not including furniture and other wood processed related products). Therefore, in order to increase the value of timber exports, particular attention should be paid to the structure of the plantation forest towards converting to long rotation plantation forest to produce high quality and value extracted wood.
Table-4. Output induced by factor of domestic final demand.
Unit: Times
C I E
Output of economy 2.073 2.093 2.082
Output of forestry 0.013 0.010 0.015
Note: C: Final consumption, I: Gross capital formation, E: Export. Sources: Estimate from the Vietnam input-output table, 2016.
Table 5 shows that the forest sector has the biggest induced impact on the value added of both the forest itself, value added of the other sectors in the economy and the gross value added (GVA) beside the inventory. However, the margnitude of the impact is quite small. This results one again suggest that the final demand of the forest sector would most probably induce value added to private consumptions, none for government consumptions and export services, and quite small on fixed assest.
Table-5. Induced impacts of final demand to forestry sector. Diffusion
rate from the final demand of the forest
sector
Final cons.6
Private
cons. Gov.
7
cons.
Gross capital formation
Fixed
asset Change in inventory
Export of goods
Export of services
Final export
To VA of the
sector itself 0.091 0.100 0.000 0.046 0.016 0.178 0.053 0.000 0.048
To VA of other sectors
in economy 0.047 0.052 0.000 0.027 0.010 0.106 0.021 0.000 0.019
to the GVA 0.137 0.152 0.000 0.073 0.026 0.284 0.074 0.000 0.068
Note: VA is Value added and GVA is Gross Value Added. Source: Estimate from Vietnam input-output, 2016.
6 Consumption
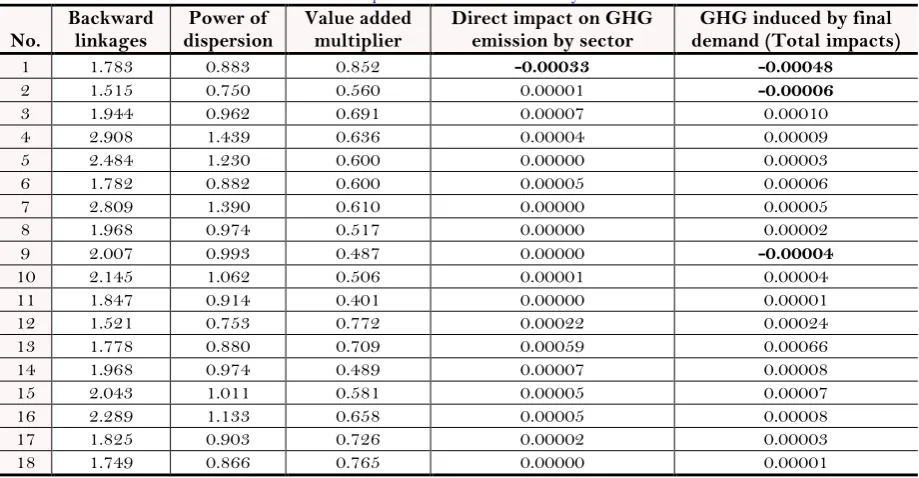
5.2. GHG Emission Analysis
Table 6 shows that the average annual growth of GHG emission in the period of 2010 - 2013 is about 1.6% and the period 2013-2016 is 4.3%. Sectors with higher GHG growth than the average are sector 6, 10, 11, 13, 16.
The average growth of Land Use, Land-Use Change and Forestry (LULUCF) in the period of 2010-2013 was 8.1%. Activities of planting and tending forests cause economic emissions to drop by 13%. According to estimates of greenhouse gas emissions with LuLucf by 2016 about 293.7 million tons, and without LuLuCF emissions of about 337.2 million tons of Use, Land-Use Change and Forestry (LULUCF).
The calculation results show that assuming the production value of afforestation increases by 10% (converted into forest cover), emissions decreased by 1.5%. The reduction is not so much because some industries as mentioned above) emit too much and tend to increase Appendix 3.
Interestingly, the induced impacts of forestation are not only for that itself but also for timber extraction and wood processing (sector 2 and sector 9). It is also important that the use of timber and wood processing products stimulates the planting and tending industry, leading to increase to absorb of CO2
Table-6. Impacts on economic and GHG by sector.
No. Backward linkages dispersion Power of Value added multiplier Direct impact on GHG emission by sector demand (Total impacts) GHG induced by final
1 1.783 0.883 0.852 -0.00033 -0.00048
2 1.515 0.750 0.560 0.00001 -0.00006
3 1.944 0.962 0.691 0.00007 0.00010
4 2.908 1.439 0.636 0.00004 0.00009
5 2.484 1.230 0.600 0.00000 0.00003
6 1.782 0.882 0.600 0.00005 0.00006
7 2.809 1.390 0.610 0.00000 0.00005
8 1.968 0.974 0.517 0.00000 0.00002
9 2.007 0.993 0.487 0.00000 -0.00004
10 2.145 1.062 0.506 0.00001 0.00004
11 1.847 0.914 0.401 0.00000 0.00001
12 1.521 0.753 0.772 0.00022 0.00024
13 1.778 0.880 0.709 0.00059 0.00066
14 1.968 0.974 0.489 0.00007 0.00008
15 2.043 1.011 0.581 0.00005 0.00007
16 2.289 1.133 0.658 0.00005 0.00008
17 1.825 0.903 0.726 0.00002 0.00003
18 1.749 0.866 0.765 0.00000 0.00001
Sources: Estimate from the Vietnam input-output table, 2016.
Table 7 shows output, value added and GHG emission induced by factors of final demand; it shows export of goods induced to value added to be low but induced to GHG emission is very high. Of the 294 million tons of greenhouse effect emissions including 40% of waste from export production, 39.6% due to the production of final consumer products and 20.4% due to the production of products to gross capital formation (including fixed assets and change in inventory). Note that the FDI sector accounts for 73% of the total export of goods [23] so it is likely that the FDI sector is one of the causes of air pollution in Vietnam. But ironically, exports and the FDI sector receive a lot of incentives from the Government of Vietnam, from tax policies, land and behavioral attitudes.
Table-7. Output, valued added and GHG emission induced by factors of final demand. Unit: times, ton
Consumption Gross capital formation of goods Export
Export of
services export Total
Volume of GHG emission (thousand tons)
Output 2.09 2.01 2.08 2.1 2.08
Value added 0.66 0.49 0.54 0.66 0.55
0.316 0.244 0.260 0.314 0.264
GHG Emission 116,313 59,889 99,557 17,969 117,527 293,729
Rate 39.6 20.39 33.89 6.12 40.01 100
Sources: Estimate from the Vietnam input-output table, 2016.
6. CONCLUSIONS
The study shows the importance of the forestry sector in both economic development and environment, especially the sub-sector of planting, caring and preserving forests.
The results from this analysis show that about 90% of the forest products are used for intermediate consumptions (for production) and only 10% for final uses, especially timber products. The imported value of the forest sector accounted for 43.76%, implying a need to change the plantation structure to increase the high value of timber from long rotation plantation forest to meet domestic and export demands. Researching also shows that in order to increase the value of timber exports, particular attention should be paid to the structure of the plantation forest towards converting to long rotation plantation forest.
In term of environmet, the results show the role of afforestation in reducing emission. Moreover, the production of timber and wood processing sector also stimulates the planting and tending sector. Therefore, encouraging these sectors will spill over reducing emission.
In order for the economy to develop sustainably:
Change the technological process of industries causing many greenhouse gas emissions to reduce emissions.
Do not encourage processing industries with large emission factors.
It is forbidden to destroy forests and pay attention to planting, tending and preserving forests to improve the quality of forests so that the coefficient of absorbing greenhouse wastes increases.
Funding: This study received no specific financial support.
Competing Interests: The authors declare that they have no competing interests.
Acknowledgement: Both authors contributed equally to the conception and design of the study.
REFERENCES
Baumol, W.J. and R.E. Gomory, 1994. On efficiency and comparative advantage in trade equilibria under scale economies. Working Papers 94-13, C.V. Starr Center for Applied Economics, New York University.
Butler, R.A., 2005. Nigeria has worst deforestation rate, FAO revises figures. Available from Mogabay.com, website: https://news.mongabay.com/2005/11/nigeria-has-worst-deforestation-rate-fao-revises-figures/.
Chen, W., D. Xu and J. Liu, 2015. The forest resources input–output model: An application in China. Ecological Indicators, 51: 87-97.Available at: https://doi.org/10.1016/j.ecolind.2014.09.007.
FAO, 2005. The state of food and agriculture 2005. Food and Agriculture Organization of the United Nations Rome.
Henderson, J.E., I.A. Munn, G. Perez-Verdin and D.L. Grebner, 2008. Forestry in Mississippi: The impact of the forest products industry on the post-Katrina Mississippi economy—an input-output analysis. Forest and Wildlife Research Center, Research Bulletin FO374, Mississippi State University. pp: 31.
Keynes, J.M., 1931. Mr. Keynes' theory of money: A rejoinder. The Economic Journal, 41(163): 412-423.
Ministry of Agriculture and Rural Development, 2019. Summary report on implementation of the agriculture and rural development plan in 2018 and implementation of the plan for 2019. Report of Ministry of Agricuture and Rural Development.
Ministry of National Resource and Environment, 2014. Viet Nam’s Initial Biennial Updated Report to the UNFCCC.
Miyazawa, K., 1976. Input-output analysis and interrelational income multiplier as a matrix. In Input-Output Analysis and the Structure of Income Distribution. Berlin, Heidelberg: Springer. pp: 22-42.
Ochuodho, T.O. and J.R. Alavalapati, 2016. Integrating natural capital into system of national accounts for policy analysis: An application of a computable general equilibrium model. Forest Policy and Economics, 72: 99-105.Available at: https://doi.org/10.1016/j.forpol.2016.06.020.
Rohanabt, K., 2008. An input-output analysis of sources of growth and key sectors in Malaysia. Modern Applied Science, 2(3): 94-109.Available at: https://doi.org/10.5539/mas.v2n3p94.
Sofilda, E. and M. Hamzah, 2016. Input output analysis to determine sustainable development planning in Indonesia. OIDA International Journal of Sustainable Development, 9(10): 11-22.
Tanaka, F.J., 2011. Applications of leontief's input-output analysis in our economy. Available from http://reposit.sun.ac.jp/dspace/bitstream/10561/874/1/v45n1p29_tanaka.pdf.
Trinh, B. and P.L. Hoa, 2017. Comparing the economic structure and carbon dioxide emission between China and Vietnam. International Journal of Economics and Financial Research, 3(3): 31-38.
Trinh, B., P.L. Hoa and B. Giang, 2008. Import multiplier in input-output analysis. Deponcen WP Series No. 23.
Trinh, B. and K. Kobayashi, 2011. The impact of energy and air emissions in a changing economic structure: Input-output approach. VNU Journal of Science, Economics and Business, 27(5E ): 20-24.
Trinh, B. and B. Quoc, 2017. Some problems on the sectoral structure, GDP growth and sustainability of Vietnam. Journal of Reviews on Global Economics, 6: 143-153.Available at: https://doi.org/10.6000/1929-7092.2017.06.12.
Tu, T.T.T., B. Trinh, N.T. Nhung and N.P. Thao, 2016. Finding economic structure and capital structure for a ―greener‖ economy. IJER Serial Publications, 13(7): 3153-3167.
Vietjnam General Statistics, 2015. Statistical yearbook. Vietnam Statistical Publishing House.
Vietnam Prime Minister, 2016. NA passes resolution on socio-economic development for 2020, Notice No. 191 / TB-VPCP.
Available from
http://news.chinhphu.vn/Home/NA-passes-resolution-on-socioeconomic-development-for-2020/201911/37997.vgp.
VPM, 2017. On approval of the national action programme on the reduction of greenhouse gas emissions through the reduction of deforestation and forest degradation. Sustainable Management of Forest Resources, and Conservation and
Appendix-1. 32 sectors in in research on economic.
Code Name
1 Forest planting and tending products 2 Wood exploitation
3 Other forest products; harvested from the forest 4 Forestry service
5 Agricultural cropping
6 Livestock & livestock products
7 Fishing
8 Mining & quarrying
9 Manufacture of food products 10 Manufacture of beverages & tobacco
11 Manufacture of textiles, clothing, footwear & leather goods 12 Manufacture of wood, paper & related products; printing 13 Manufacture of petroleum, chemical, rubber & plastic products 14 Manufacture of non-metallic mineral products
15 Manufacture of metal products, machinery & equipment 16 Manufacture of furniture & other goods; repair & installation 17 Electricity
18 Water supply; sewerage, waste management & remediation activities 19 Construction
20 Wholesale & retail trade; repair of motor vehicles & motorcycles 21 Transportation & storage
22 Accommodation & food service activities 23 Information & communications
24 Financial & insurance activities 25 Real estate activities
26 Professional, scientific & technical activities 27 Administrative & support service activities
28 Public administration &defense; compulsory social security 29 Education
30 Human health & social work activities 31 Arts, entertainment & recreation 32 Other service activities
Appendix-2. 18 Sectors in research on GHG emission.
Name of sector Code
Forest planting and tending products 1
Wood exploitation and otherforest products 2
Agricultural cropping 3
Livestock & livestock products 4
Fishing 5
Mining & quarrying 6
Manufacture of food products 7
Manufacture of textiles, clothing, footwear & leather goods 8 Manufacture of wood, paper & related products; printing 9 Manufacture of petroleum, chemical, rubber & plastic products 10
Manufacture of metal products, machinery & equipment 11
ELECTRICITY 12
Water supply; sewerage, waste management & remediation activities 13
Construction 14
Transportation & storage 15
Accommodation & food service activities 16
Other sectors: Commercial/Institutional 17
Appendix-3. GHG emission (Unit: ktCO2e).
No. Estimated GHG in 2016
e=E1*(a1)^3 Average growth in 2010-2013 Gross output Unit: kt/million dong GHG/output
1 (43,438) 1.081 133,635,128 -0.0003
2 777.50 0.679 86,906,635 0.0000
3 71,050.18 1.002 972,275,486 0.0001
4 19,664.45 1.015 490,305,688 0.0000
5 1,279.10 0.962 497,205,426 0.0000
6 37,978.94 1.217 822,058,619 0.0000
7 2,735.52 0.953 1,917,762,958 0.0000
8 5,923.77 1.016 1,280,809,140 0.0000
9 1,430.72 1.016 924,540,293 0.0000
10 13,140.68 1.444 1,870,848,097 0.0000
11 4,267.40 1.174 2,338,055,166 0.0000
12 46,923.55 1.024 213,714,709 0.0002
13 27,875.71 1.105 46,923,806 0.0006
14 54,739.76 1.004 827,957,817 0.0001
15 28,890.05 0.991 563,602,562 0.0001
16 16,689.98 1.162 364,489,714 0.0000
17 3,376.40 1.004 213,244,342 0.0000
18 422.81 0.599 2,516,822,816 0.0000
Total 293,728.57 1.043 4.28