Research Article
DEVELOPMENT AND VALIDATION OF A STABILITY INDICATING HPLC METHOD FOR THE
ESTIMATION OF RABEPRAZOLE IMPURITIES IN PHARMACEUTICAL DOSAGE FORMS BY
DESIGN OF EXPERIMENTS
1Analytical Research and Development, Integrated Product Development, Dr. Reddy’s Laboratories Ltd., Bachupally, Hyderabad- India, 2 School of Chemistry, Andhra University, Visakhapatnam- A.P., India. Email: [email protected].
Received: 28 June 2013, Revised and Accepted: 21 July 2013
ABSTRACT
A novel stability-indicating reverse phase liquid chromatographic method was developed for the determination of Rabeprazole impurities in Rabeprazole tablet formulations. One unknown impurity was isolated and characterized by using MS and NMR, which was formed in the formulated drug stability study. Rabeprazole was subjected to the stress conditions like oxidative, acid, base, hydrolytic, thermal and photolytic degradation. Chromatographic separation was achieved on HPLC in gradient elution mode by QbD-approach. The eluted compounds were monitored at 280 nm. All the impurities and degradation products were well resolved from the main peak, proving the stability-indicating power of the method. On the basis of spectral data, the unknown impurity was characterized as 1-(1H -Benzimidazol-2-yl)-4-(3-methoxypropoxy)-3-methylpyridinium-2-carboxylate. The developed method was validated as per International Conference on Harmonization (ICH) guidelines with respect to specificity, limit of detection, limit of quantification, precision, linearity, accuracy, robustness and ruggedness
Keywords: Rabeprazole, QbD approach, Degradation Products, Stability-Indicating, ICH Guidelines
INTRODUCTION
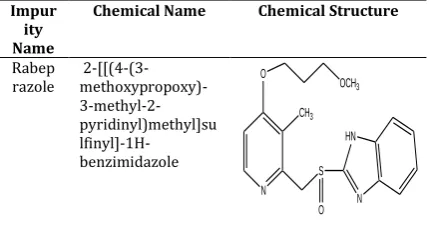
Rabeprazole sodium [RAB], chemically known as 2-[[(4-(3- methoxypropoxy)-3-methyl-2-pyridinyl)methyl]sulfinyl]-1H-benzimidazole sodium salt [1-4], is a proton pump inhibitor and used to treat gastroesophageal reflux disease (GERD), a condition in which backward flow of acid from the stomach causes heartburn and possible injury of the esophagus (the tube that connects the throat and stomach), it heals esophagus, and prevent further damage to the esophagus. RAB is also used to treat Zollinger-Ellison syndrome and ulcers (sores in the lining of the stomach or intestine) and is used in combination with other medications to eliminate Helicobacter pylori, a bacteria that causes ulcers [5]. The molecule structure is shown in Figure 1.
In general, solid active pharmaceutical ingredients (APIs) are formulated with excipients as tablets or capsules. Since the active ingredient is interacting with the excipients and the formulated product is stored at different conditions, the study of stability of APIs is critical in the drug development process. Many factors can affect the stability of a pharmaceutical product, some of them include the stability of the active ingredient, the manufacturing process, the environmental conditions (such as heat, light and moisture during storage), as well as some chemical reactions such as oxidation, reduction and hydrolysis that might occur [6]. RAB has been reported in literature as thermal, acidic and photo sensitive [7], as the RAB is sensitive to acid pharmaceutical dosage form is manufactured as enteric coated tablets [8-12].
Impur ity Name
Chemical Name Chemical Structure
Rabep
To estimate the purity of the drug in the formulations the analytical method should separate all the degradants and process related impurities from the excipients used in the formulation. In the literature, limited LC methods (LC- MS, HPLC, ELSD, NMR,
Preparative HPLC, TLC and ESI-MS/MS) [13-22]were reported for
the determination of RAB in pharmaceutical preparations. Few of the degradant and other impurities of RAB reported in the literature [23-26]. During stability study, it was observed that one unknown impurity is increasing to the level of 0.5% and merging with other unknown impurity when analyzed using UPLC method [25].
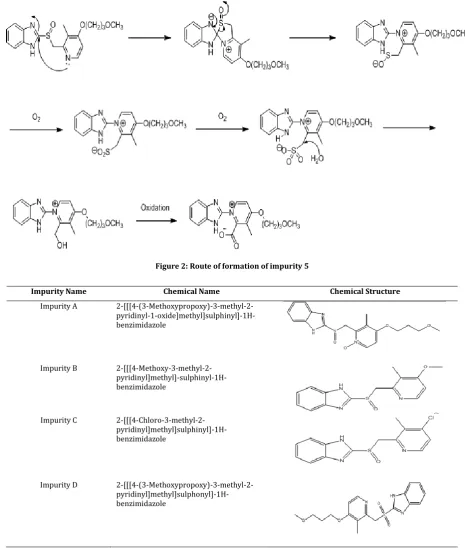
Hence it was decided to separate all the possible degradants and known impurities of RAB from the placebo peaks by QbD approach [27, 28]. RAB is having total 9 impurities as per literature. In the present work the author separated all the literature and degradant impurities from the placebo peaks in the tablets. One degradant impurity was observed during the stability study of drug product (12M), identified and characterized using LC-MS, NMR and HRMS study. The degradant impurity was named as impurity 5. The plausible route for the formation of impurity 5 is shown in Figure 2. In the present work author separated all the 10 impurities (Figure 3) from the excipients and degradant impurities during the stability study by QbD approach and validated the method as per ICH monitored and processed using empower-2 software. Cintex digital water bath was used for hydrolysis studies. Photo stability studies were carried out in a photo stability chamber (Sanyo, Leicestershire, UK). Thermal stability studies were performed in a dry air oven (Cintex, Mumbai, India).
Chemicals and Reagents
India. Potassium dihydrogen ortho phosphate, dipotassium hydrogen phosphate, triethyl amine, diethyl amine and ortho-phosphoric acid were purchased from Merck, Darmstadt, Germany. Acetonitrile and methanol were procured from J.T. Baker limited. High purity water was prepared by using Millipore MilliQ Plus water purification system (Millipore, Milford, MA, USA).
Experimental
Chromatographic conditions
The method was developed using Inertsustine, 250 x 4.6mm, 5 µm column with mobile phase containing a gradient mixture of solvent A and B. Mixed phosphate buffer of 0.018M di potassium hydrogen phosphate and 0.005M potassium dihydrogen ortho phosphate (after addition of 1 ml triethyl amine pH adjusted to 7.6 with diluted
ortho-phosphoric acid) and acetonitrile in the ratio 95:5, v/v; was used as solvent A. Water and acetonitrile in the ratio 20:80, v/v; was used as solvent B. The HPLC system operated at a flow rate of 1.0 mL/min and the column oven temperature was maintained at 40°C. The injection volume was 20 μl. UV detection was carried out at 280 nm and data acquisition time of 90 min. The gradient program (T/%B) was set as 0/7.5, 10/7.5, 25/20, 35/30, 55/50, 65/60, 75/60, 78/7.5 and 90/7.5.
Preparation of stock solutions
A stock solution of RAB (500 µg/mL) was prepared by dissolving an
appropriate amount of the drug in diluent. Working solution
containing 1 µg/mL was prepared from this stock solution for the determination of impurities. Individual stock solutions of all the impurities were prepared in diluent and used for method validation.
Figure 2:Route of formation of impurity 5
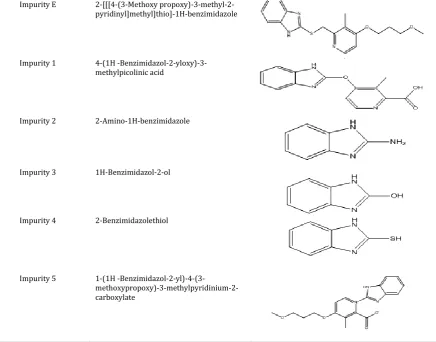
Impurity Name Chemical Name Chemical Structure
Impurity A
2-[[[4-(3-Methoxypropoxy)-3-methyl-2- pyridinyl-1-oxide]methyl]sulphinyl]-1H-benzimidazole
Impurity B
2-[[[4-Methoxy-3-methyl-2- pyridinyl]methyl]-sulphinyl-1H-benzimidazole
Impurity C
2-[[[4-Chloro-3-methyl-2- pyridinyl]methyl]sulphinyl]-1H-benzimidazole
Impurity D
Impurity E 2-[[[4-(3-Methoxy propoxy)-3-methyl-2-pyridinyl]methyl]thio]-1H-benzimidazole
Impurity 1 4-(1H
-Benzimidazol-2-yloxy)-3-methylpicolinic acid
Impurity 2 2-Amino-1H-benzimidazole
Impurity 3 1H-Benzimidazol-2-ol
Impurity 4 2-Benzimidazolethiol
Impurity 5 1-(1H
-Benzimidazol-2-yl)-4-(3- methoxypropoxy)-3-methylpyridinium-2-carboxylate
Figure 3:Structures of Rabeprazole impurities
Preparation of sample solution
20 tablets were taken and crushed to a fine powder .Transferred tablet powder equivalent to 50 mg of RAB into a 100 mL volumetric flask. Added 70 mL of diluent and sonicated for 30 minutes with intermediate shaking (maintain the sonicator temperature between 10°C - 15°C). Allow the flask to cool down to the room temperature and then make up the volume with diluent (500 μg/mL). The resulting solution was analyzed by HPLC.
Design of Experiments
The experimental design along with statistical analysis of data was performed by Design-Expert 8.0 software, Full Version (Stat Ease Stat-Ease, Inc., Minneapolis, MN, USA). An experimental design is an experimental set-up to simultaneously evaluate several factors at a given numbers of levels in a predefined number of experiments. Several types of experimental designs (Two level full factorial, two level fractional factorial, Placket-Burman, mixed level designs) are available and these designs allow the simultaneous examination of qualitative, quantitative and mixture related factors. A two level full factorial design is selected for the present study to determine the main effects and all interactions between the factors,
leading 2f experiments to be performed.
Isolation of impurity 5 by preparative HPLC
Enriching of Impurity 5
Tablet powder equivalent to 1000 mg of RAB was refluxed with 30 ml of water at 50°C for 2 hours. 40 mg/mL solution was prepared and injected into the liquid chromatography. Observed degradation was 10.75%
Preparative Isolation
Preparative HPLC was performed using a reversed phase X-Bridge C18, 250x21.2 mm, 5µm column on Agilent Preparative HPLC
system. Mobile phase-A consist of water and Mobile phase-B consist of acetonitrile. Preparative HPLC was carried out at a flow rate of 10 mL/min, column oven temperature maintained at ambient and Rheodyne injector used for injecting the samples into chromatographic system. Gradient programme for impurity 5 is as follows: (T/%B, 0/7, 10/7, 11/85, 21/85, 22.5/7, 25/7).
Peak cut criteria for the isolated impurity was set based on the peak retention time. Fractions > 98 % purity were pooled together and concentrated by rotavapour to remove solvents, then lyophilized using freeze drying to obtain a pure compound with more than 98 % purity.
LC–MS conditions
LC–MS/MS system (Agilent 1200 series liquid chromatograph coupled with Applied Biosystems 4000 Q Trap triple quadrupole mass spectrometer with Analyst 1.4 software, MDSSCIEX, USA) was used for identification of degradant formed during forced degradation studies. Inert Sustine (250 mm × 4.6 mm), 5 µm particle size column was used for the analysis. Ammonium acetate buffer 0.02 M (pH adjusted to 7.6 with Ammonia solution) & Acetonitrile in the ratio 95:5, v/v; was used as solvent A and water & Acetonitrile in the ratio 20:80, v/v; was used as solvent B. Injection volume was 20 μl, flow rate was 1.0 mL/min and column oven temperature maintained at 40°C. UV detection was carried out at 280 nm and data acquisition time was 90 min. The gradient program (T/%B) was set as 0/7.5, 10/7.5, 25/20, 35/30, 55/50, 65/60, 75/60, 78/7.5 and 90/7.5. The analysis was performed in positive electro-spray/positive ionization mode, the ion source voltage was 5000 V, and the source temperature was 450°C. GS1 and GS2 were optimized to 30 and 35 psi, respectively. The curtain gas flow was 20 psi.
1H NMR
shift values were reported on δ scale in ppm with respect to TMS (0.00ppm) as internal standard.
Method Validation
Specificity, precision, linearity, LOD-LOQ, Accuracy, Robustness and Solution stability parameters were verified as part of method validation.
Specificity
Specificity is the ability of the method to measure the analyte response in the presence of its potential impurities. The specificity of the LC method for RAB was carried out in the presence of its impurities namely impurity A, B, C, D, E, 1, 2, 3, 4 and 5. Stress studies were performed for RAB tablets to provide an indication of the stability-indicating property and specificity of the proposed method. Intentional degradation was attempted with a stress condition of Photolytic (1.2 Million Lux hours followed by 200 Watt
hours), thermal (105◦C, 2 hour 30 minutes), acid (0.1N HCl, 60 ºC, 5
minutes), base (0.1N NaOH, 60 ºC, 30 minutes), water hydrolysis (50 ºC, 30 minutes), Humidity (90% RH, 7 days) and oxidation (3.0% H2O2, 60 ºC, 30 minutes) to evaluate the ability of the proposed
method to separate RAB from its degradation products. Peak purity for the RAB peak was evaluated by using PDA detector in all stressed samples.
Precision
The precision of the method verified by repeatability by injecting six individual preparations of RAB tablets spiked with 0.20% of its 10 impurities (0.20% of impurities with respect to 0.5 mg/ml of RAB). %RSD of each impurity from six preparations was calculated. The same experiment was evaluated by using different instrument, different column and different analyst on different day as part of intermediate precision.
Limits of detection (LOD) and quantification (LOQ)
LOD and LOQ for impurities A, B, C, D, E, 1, 2, 3, 4 and 5 were determined at a signal-to-noise ratio of 3:1 and 10:1, respectively, by injecting a series of dilute solutions with known concentrations. Precision study was also carried out at LOQ level by injecting six individual preparations of impurities and % RSD was calculated.
Linearity
Linearity test solutions for the method were prepared by diluting stock solution to the required concentrations. The solutions were prepared at six concentration levels from LOQ to 500% of the specification level.
Accuracy
Accuracy of the method was evaluated in triplicate using concentration levels LOQ, 50%, 100%, 200%, 400% and 500% of the specification level on RAB tablets. Standard addition and recovery experiments were conducted on real sample to determine accuracy of the impurities method. The percentage of recoveries for all 10 RAB impurities and RAB were calculated.
Robustness
To determine the robustness of the developed method, experimental conditions were deliberately altered and the resolution between RAB & its impurities and tailing factor for RAB were recorded. The flow rate of the mobile phase was 1.0 ml/min, to study the effect of flow rate on the resolution; flow rate was changed by 0.2 units i.e., from 0.8 to 1.2 ml/min. The effect of the column temperature on resolution was studied at 35 and 45°C instead of 40°C. The effect of the pH on resolution was studied by varying pH by ±0.2 units while other mobile phase components were held constant.
Solution stability
Solution stability of RAB and its impurities in the impurities method was carried out by leaving spiked sample solutions in tightly capped volumetric flasks for 24h at room temperature and in refrigerator.
Content of impurities A, B, C, D, E, 1, 2, 3, 4 and 5 were determined for every 1h interval up to the study period.
RESULTS AND DISCUSSION
Initial method development
The main objective of the chromatographic method was to separate all the impurities of RAB, from each other and from the placebo peaks. A blend solution prepared from the tablets containing 500 µg/mL of RAB and spiked with 1 µg/mL (0.20%) of each impurity dissolved in diluent and used for method development. A placebo solution was prepared as per test preparation and used to identify the placebo peaks. Before starting the development impurity mix, placebo and degradation samples were analyzed by using UPLC
method; it was observed that placebo peaks and impurity peaks
were well separated. But when 12M stability samples were analyzed, one unknown impurity was crossing 0.5% limit and peak shape was not sharp. Later it was observed that this unknown peak contains two peaks. Method development was initiated to separate these two peaks by changing parameters like pH, polarity, flow and different columns on UPLC; but separation was not achieved. Later it was decided to work on HPLC by selecting Inertsustine, 250 x 4.6mm, 5 µm column with mobile phase containing a gradient mixture of solvent A and B. Mixed phosphate buffer of 0.018M dipotassium hydrogen phosphate and 0.005M potassium dihydrogen ortho phosphate (after addition of 1 ml triethyl amine pH adjusted to 7.6 with diluted ortho-phosphoric acid) and acetonitrile in the ratio 95:5, v/v; was used as solvent A. Water and acetonitrile in the ratio 20:80, v/v; was used as solvent B. Flow rate was 1.0 mL/min and the column oven temperature was maintained at 40°C. The injection volume was 20 μl and UV detection was carried out at 280 nm. Separation was achieved with the gradient program (T/%B) : 0/7.5, 10/7.5, 25/20, 35/30, 55/50, 65/60, 75/60, 78/7.5 and 90/7.5. After this initial optimization, method was subjected to Design of Experiments to study the variables which can influence the
resolution between the impurities.
Method Optimization by Design of Experiments
Based on the initial method development pH of the buffer, flow rate, organic phase composition in mobile phase B and column temperature were selected as critical parameters. Evaluating all of these parameters with a full factorial design would involve 24 = 16
trials. Total 21 runs including five runs at centre points were
performed. In all the experiments RS1 (Resolution between impurity
C & RAB), RS2 (Resolution between impurity C & D) and Rs3
(Resolution between Impurity 2 & 5) were monitored.
The results (Table 1) after completion of the 21 experiments were
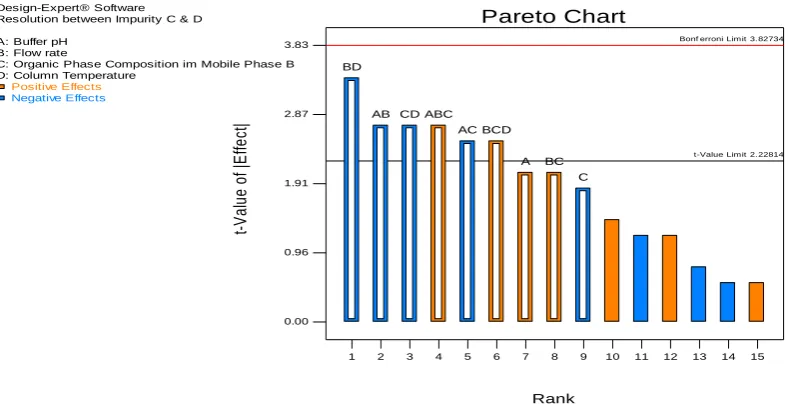
analyzed through Design Expert ®software. The effect on the three dependent variables with the independent variables was explained by using Pareto chart (Figures 4, 5 & 6). The resolution between
Rabeprazole and Impurity C (RS1) was majorly affected by flow rate,
pH of the buffer, organic phase composition followed by mixed interaction of pH of the buffer, column temperature and organic
phase composition. The resolution between impurity C & D was
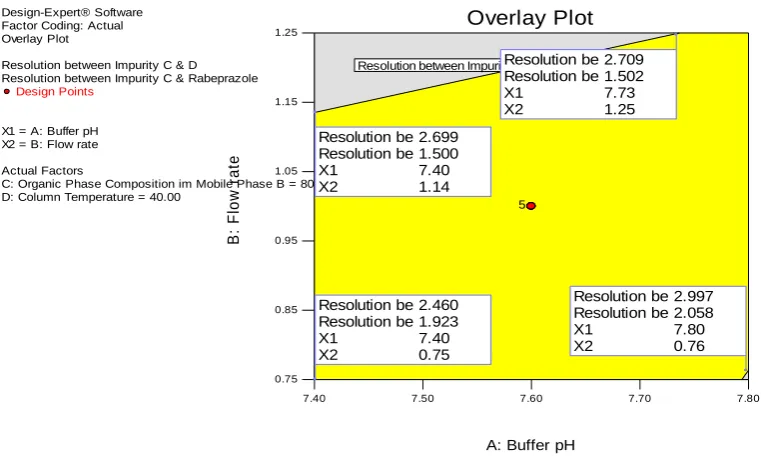
affected by mixed interaction of all the variables. The resolution between impurity 2 & 5 was affected by Flow rate, Organic phase composition followed by mixed interactions. Design space graph was shown in Figure 7. The definition for design space of a LC method can be “multidimensional combination and interaction of mobile phase variables (pH of the buffer and organic phase composition) and chromatographic parameters (Flow rate and column temperature) that have been demonstrated to provide assurance of result obtained with the method”. The yellow region in Design space graph indicates the responses are in acceptable range and the grey region shows the responses are below the desired level. The initial method development parameters were lying in middle of the design space; hence the initial developed method was finalized and performed method validation.
Design-Expert® Software
Resolution between Impurity C & Rabeprazole A: Buffer pH
B: Flow rate
C: Organic Phase Composition im Mobile Phase B D: Column Temperature
Figure 4:Pareto Chart for resolution between impurity C and Rabeprazole
Design-Expert® Software Resolution between Impurity C & D A: Buffer pH
B: Flow rate
C: Organic Phase Composition im Mobile Phase B D: Column Temperature
Figure 5:Pareto Chart for resolution between impurity C and impurity D
Method Validation
Specificity
RAB was found to degrade significantly in acid stress, peroxide stress and in water stress; and mild degradation was observed in thermal stress and base stress; and no degradation observed in photolytic (light) stress and humidity stress. The typical chromatogram of acid and water stressed samples were shown in Figures 10 & 11. It is interesting to note that all the peaks due to degradation were well resolved from the peaks of RAB and its impurities. Photodiode array detector was employed to check and ensure the homogeneity and purity of RAB peak in all the stressed sample solutions. Assay studies were carried out for stress samples
against RAB qualified working standard. The mass balance (% assay
+ % Total impurities) results were presented in Table 2. The purity
and assay of RAB was unaffected by the presence of its impurities and degradation products and thus confirms the stability-indicating power of the method.
Precision
The %RSD for the % of each individual impurity in method precision study was within 4.2. Results for set-2 precision (Intermediate precision) was within 3.1%. These results demonstrate that the
Design-Expert® Software Resolution Between Impurity 2 & 5 A: Buffer pH
B: Flow rate
C: Organic Phase Composition im Mobile Phase B D: Column Temperature
Figure 6:Pareto Chart for resolution between impurity 2 and impurity 5
Design-Expert® Software Factor Coding: Actual Overlay Plot
Resolution between Impurity C & D Resolution between Impurity C & Rabeprazole
Design Points
X1 = A: Buffer pH X2 = B: Flow rate
Actual Factors
C: Organic Phase Composition im Mobile Phase B = 80.00 D: Column Temperature = 40.00
Resolution between Impurity C & Rabeprazole : 1.500
5
Figure 7:Overlay plot of design of experiments
Table1: Design of experiments data
15 7.40 1.25 70.00 50.00 2.6 1.5 3.7
16 7.60 1.00 80.00 40.00 2.5 1.8 3.5
17 7.40 0.75 90.00 30.00 2.7 1.7 4.1
18 7.80 1.25 90.00 50.00 2.6 1.4 3.0
19 7.60 1.00 80.00 40.00 2.7 1.9 3.5
20 7.80 1.25 90.00 30.00 2.8 1.4 3.1
Structural Elucidation of Impurity
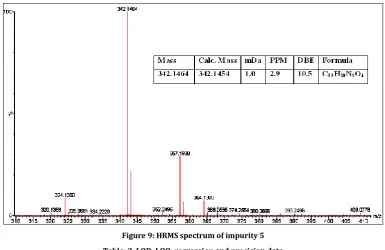
The ESI mass spectrum of RAB Impurity 5 displayed protonated molecular ion at m/z = 341, which corresponds to the molecular formula C18H19N3O4, HRMS data (Figure 9) confirms the molecular
formula of RAB impurity 5. Also NMR spectrum confirms the same structure.
Based on MS and NMR data the structure of Impurity 5 was characterized as 1-(1H -Benzimidazol-2-yl)-4-(3-methoxypropoxy)-3-methylpyridinium-2-carboxylate.
Figure 8:Overlaid Chromatogram of Rabeprazole placebo and spiked test preparation
Limits of detection and quantification
The determined limit of detection, limit of quantification and precision at LOQ values for RAB and its 10 impurities were reported in Table 3. The RSD for peak areas of RAB and its related 10 impurities at limit of quantification level were within 10.0%.
Linearity
Linear calibration plot for the related substance method was obtained over the calibration ranges tested, i.e. LOQ to 500% of the specification level. The correlation coefficient obtained was greater than 0.997 for all the components. The slope and y-intercept values were also provided in Table 3, which confirmed good linearity
between peak areas and concentration.
Accuracy
Recovery of impurities from drug substances in spiked studies ranged from 87.4-112.9% at six different levels. The % recovery
values for impurities and RAB were presented in Table 4.
Robustness
In all the deliberate varied chromatographic conditions (flow rate, column temperature, buffer pH and composition of organic solvent), the resolution between all pairs of compounds was greater than 1.5 and tailing factor for RAB and its impurities was less than 2.0.
Table 4: Accuracy data
Compound % Recovery at each level
LOQ 50% 100% 200% 400% 500%
Impurity A 101.2 95.7 100.6 100.8 98.6 99.4
Impurity B 108.0 102.2 101.1 103.3 96.2 97.8
Impurity C 103.8 105.1 105.0 104.0 93.9 95.3
Impurity D 93.6 107.5 105.4 102.2 95.2 97.0
Impurity E 102.0 109.7 92.3 112.9 92.7 93.7
Impurity 1 104.9 96.2 100.7 100.3 111.4 87.4
Impurity 2 104.9 95.5 100.6 100.1 99.0 99.2
Impurity 3 108.1 111.4 105.8 107.0 100.8 101.5
Impurity 4 93.6 109.7 106.9 104.8 92.8 94.6
Impurity 5 92.9 96.6 96.4 90.6 93.9 90.8
Figure 9: HRMS spectrum of impurity 5
Table: 3. LOD, LOQ, regression and precision data
Compound LOD
(%) LOQ (%)
Regression equation (y) Precision (%RSD)
Set-1
Precision (%RSD)
Set-2 Slope
(b)
Intercept (a)
Correlation coefficient
Impurity A 0.002 0.005 63401.66 721.40 1.000 0.7 0.3
Impurity B 0.002 0.007 44798.77 1200.23 0.999 1.2 2.1
Impurity C 0.002 0.006 52872.41 1184.67 0.997 1.7 3.1
Impurity D 0.002 0.008 40552.21 751.87 0.999 0.9 2.2
Impurity E 0.004 0.011 47446.58 672.38 0.999 1.2 1.2
Impurity 1 0.002 0.006 46566.55 3291.62 1.000 1.3 1.0
Impurity 2 0.002 0.006 74816.40 353.99 0.999 0.8 1.1
Impurity 3 0.002 0.007 61070.58 236.40 0.999 1.1 1.4
Impurity 4 0.002 0.005 91841.63 127.25 1.000 0.8 0.9
Impurity 5 0.005 0.014 23499.45 950.18 1.000 4.2 2.4
Rabeprazole 0.002 0.007 39971.59 953.65 1.000 1.5 1.3
Solution stability
Significant changes were observed in the content of 10 impurities during solution stability experiments. The solution stability experiment data confirms that the sample needs to be injected freshly every time.
CONCLUSION
One degradant impurity of RAB was isolated, identified and characterized using HPLC (HPLC and Preparative HPLC), MS and
NMR techniques, as 1-(1H
-Benzimidazol-2-yl)-4-(3-methoxypropoxy)-3-methylpyridinium-2-carboxylate. The simple gradient reversed phase LC method was developed for quantitative analysis of RAB and its 10 impurities in RAB tablets by QbD Approach was found to be precise, accurate, linear, robust and specific. Satisfactory results were obtained from validation of the method. The method was stability-indicating and can be used for routine analysis of production samples and to check the stability of samples of RAB formulations.
ACKNOWLEDGEMENT
The authors wish to thank the management of Dr. Reddy’s Laboratories Ltd. for supporting this work.
CONFLICT OF INTEREST
The authors confirm that this article content has no conflicts of interest.
REFERENCES
1. Richardson P, Hawkey C, Stack W. Proton pump
inhibitors- pharmacology and rationale for use in gastrointestinal disorders. Drugs 1998; 56: 307-35.
2. Feret B, Quercia R, Cappa J. Micromedex- Drugdex
Evaluations. Rabeprazole: A proton pump inhibitor for the treatment of acid-related disorders. Formulary 1999; 34: 313-23.
3. Reilly JP. Safety profile of the protonpump inhibitors. Am J
Health Syst Pharm 1999; 56: S11-7.
4. The Merck Index. Merck and Co., Inc., Whitehouse Station,
NJ. 1996; pp 1392.
5. Barth J, Hahne W. Rabeprazole based therapy in
Helicobacter pylori eradication. Aliment Pharmacol Ther 2002; 16: 31–33.
6. Kommanaboyina B, Rhodes CT. Trends in stability testing,
with emphasis on stability during distribution and storage. Drug Dev Ind Pharm 1999; 25: 857–868.
7. Cassia VG, Norma SN, Martin S, Elfrides ESS. Structural
elucidation of rabeprazole sodium photodegradation products. J PharmBiomed Anal 2008; 46: 88-93.
8. Janssen-Cilag. Pariet® –Rabeprazole, 1999.
9. Mathew M, Das Gupta V, Bailey R. Stability of omeprazole
solutions at various pH values as determined by high-performance liquid chromatography. Drug Dev Ind Pharm 1995; 21: 965–971.
10. Radi A. Adsorptive stripping square-wave voltammetric
11. Qaisi A, Tutunji M, Tutunji L. Acid Decomposition of Omeprazole in the Absence of Thiol: A Differential Pulse Polarographic Study at the Static Mercury Drop Electrode (SMDE). J Pharm Sci 2006; 95: 384–391.
12. Vadas EB, Genaro ARR. The Science and Practice of
Pharmacy, 20th ed., Lippincott Williams & Wilkins. Philadelphia 2000; 980–985.
13. Garcia CV, Nudelman NS, Steppe M, Schapoval EES.
Structural elucidation of rabeprazole sodium photo degradation products. J Pharm Biomed Anal 2008; 46: 88– 93.
14. Reddy GM, Bhaskar BV, Reddy PP, Sudhakar P, Babu JM,
Vyas K, Reddy PR, Mukkanti K. Identification and characterization of potential impurities of rabeprazole sodium. J Pharm Biomed Anal 2007; 43: 1262–1269.
15. Pingili RR, Jambula MR, Ganta MR, Ghanta MR, Sajja E,
Sundaram V, Boluggdu VB. Identification and synthesis of potential impurities of Rabeprazole sodium. Pharmazie 2005; 60: 814–818.
16. Reddy GM, Mukkanti K, Bhaskar BV, Reddy PP. Synthesis
of metabolites and related substances of rabeprazole, an anti-ulcerative drug. Synth Commun 2009; 39: 278–290.
17. Reddy PR, Himabindu V, Jayadeepkumar L, Reddy GM,
Kumar JV, Reddy GM. An improved process for the production of rabeprazole sodium substantially free from impurities. Org Process Res Develop 2009; 13: 896–899.
18. Buchireddy R, Mukkanti K, Srinivasulu P, Srinivas KSV. A
Validated Stability-Indicating, LC Method for Rabeprazole Sodium. Chromatographia 2008; 68: 275-280.
19. Srinivas KSV, Buchireddy R, Mukkanti K, Srinivasulu P. A
Validated RP-LC Method for Advanced Intermediate of Rabeprazole Sodium. Chromatographia 2009; 69: 381-384.
20. Shan Ren, Mi-Jin Park, Hongkee Sah, Beom-Jin Lee. Effect
of pharmaceutical excipients on aqueous stability of rabeprazole sodium. Int J Pharm 2008; 350: 197-204.
21. Kulkarni VL, Mahulikar PP. Estimation of Rabeprazole
Sodium in tablet dosage form by rapid isocratic reversed phase high performance liquid chromatography using volatile buffer additives. J Sci Ind Res 2006; 65: 992-994. 22. Halder A, Mandal BK, Sridevi R, Navalgund SG. Validated
RP-HPLC method for rabeprazole and its stability studies. NSHM J Pharm Healthcare Manage 2011; 02: 76-82.
23. Sreenivasa Rao P, Uttam Kumar Ray, Badarinadh Gupta P,
Srinivasa Rao DVN, Aminul Islam, Pradeep Rajput, Mukkanti K. Identification, isolation and characterization of new impurity in rabeprazole sodium. J Pharm Biomed Anal 2010; 52: 620–624.
24. Vasu Dev R, Sai Uday Kiran G, Venkata Subbaiah B, Suresh
Babu B, Moses Babu J, Dubey PK, Vyas K. Identification of degradation products in stressed tablets of Rabeprazole sodium by HPLC-hyphenated techniques. Magn Reson Chem 2009; 47: 443-448.
25. Raja Kumar S, Raghava Raju TV, Ravindra Kumar Y,
Suresh Babu B, Venkatasubbaiah B, Chakravarthy IE. Development and validation of a stability indicating UPLC method, Identification, and characterization of three degradant impurities in pharmaceutical dosage form of Rabeprazole Sodium. J Liq Chromatogr Related Technol 2013; 36: 2261-2278.
26. Churms SC. The essence of chromatography. J Chromatogr
A 1996; 720: 151.
27. McBrien M. Practical implications of quality by design to chromatographic method development. Chromatography Today 2010; 3: 30-33.
28. ICH, Q8 (R2). Pharmaceutical Development, International
Conference on Harmonization, 2009.
29. ICH, Q2 (R1). Validation of Analytical Procedures: Text
and Methodology, International Conference on